




TL;DR: Double top and double bottom patterns mark two failed tests of one price and only count once price closes through the neckline. A double top is an M after an advance and reads bearish; a double bottom is a W after a decline and reads bullish. The target is the pattern height projected from the neckline, and the stop sits beyond the outermost peak or trough. Entering on the close puts reward below risk, so confirmation, retests and position size decide whether the setup is worth taking.
Two highs at almost the same price look like a top long before they are one. That gap is where most of the damage happens. The double top and double bottom pattern is easy to spot and easy to trade badly, because the shape shows up early and the confirmation shows up late, and the temptation is to act on the shape. This guide covers how each formation is built, how to confirm it, what the entry, stop and target cost in points and dollars on ES and MNQ futures, how two real 2026 ES examples played out, and what the published research says about reliability.
What the Double Top and Double Bottom Pattern Means
The double top and double bottom are reversal patterns. Each one records price running into the same level twice, failing both times, and then breaking the swing point between the two attempts.
A double top forms after an advance. Price makes a high, pulls back to a low, rallies to roughly the same high again and fails. The low between the two highs is the neckline. When price closes below it, the formation is complete and reads bearish.
A double bottom is the mirror image after a decline. Price makes a low, bounces to a high, falls back to roughly the same low and holds. The high between the two lows is the neckline, and a close above it completes a bullish reading.
The shapes give the patterns their nicknames. A double top looks like the letter M and a double bottom looks like a W.
What the formation actually tells you is about supply and demand at one price. The first test uses up the buyers (or sellers) who made the move. The second test finds a thinner crowd at the same level, and the market cannot push through. The break of the neckline is the point where the swing structure of the trend changes: a double top's neckline break produces the first lower low after a series of higher lows.
That is also why the pattern is a level test, not a forecast. It tells you where the market failed twice. It does not tell you how far the reversal will run, and until the neckline breaks it does not tell you the trend has turned at all.
Related lesson: Market structure
Double Top and Double Bottom Structure and Neckline
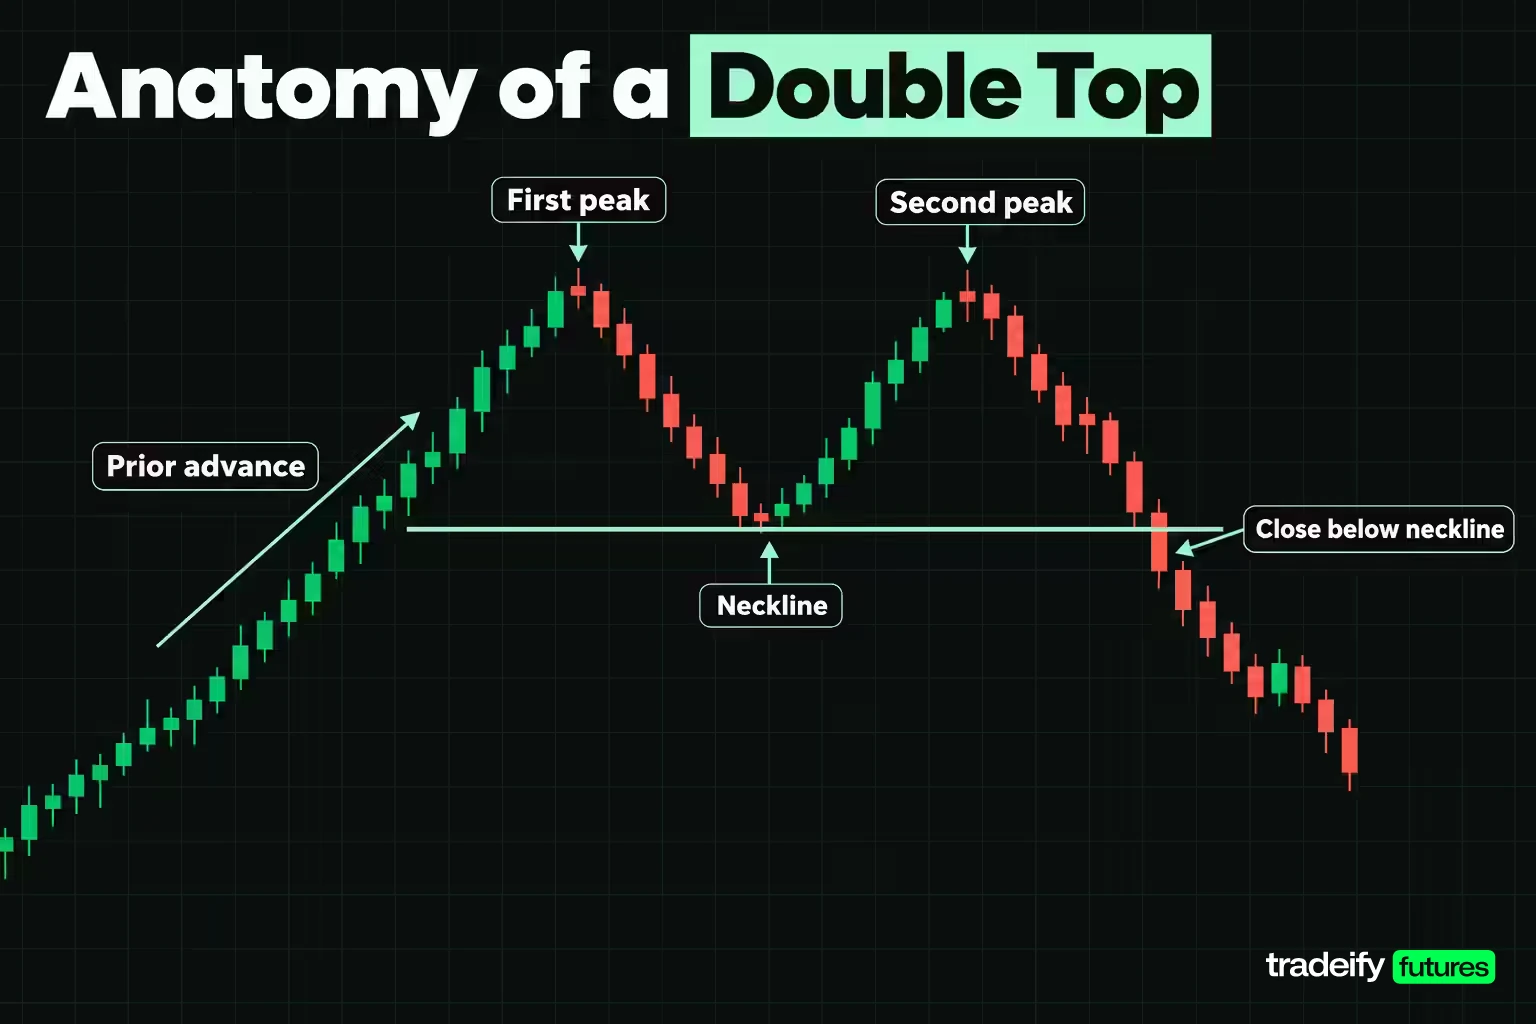
Every double top or double bottom has the same six parts. Missing one usually means you are looking at something else.
- Prior trend. A double top needs an advance to reverse, and a double bottom needs a decline. Without a trend into it, two equal highs are just the top of a range.
- First extreme. The first peak (top) or trough (bottom), usually printed on strong momentum.
- The swing between them. The valley between two peaks, or the rally between two troughs. Its extreme defines the neckline.
- Second extreme. A second peak or trough at or near the first one.
- Neckline. A horizontal level through the valley low (double top) or the rally high (double bottom). Treat it as a zone a few ticks wide, not a hairline.
- Breakout. A close through the neckline in the reversal direction. Only this turns two extremes into a confirmed pattern.
The most quoted guidelines come from Thomas Bulkowski's research on daily stock charts, summarized on his ThePatternSite pages. For double tops he describes peaks that usually differ by less than 3%, a valley between them of at least 10% (with exceptions allowed), and peaks usually several weeks apart. For double bottoms he gives an average variation between the two lows of 1% and a median separation of 16 days for the narrow Adam and Adam version.
Spacing matters for a simple reason. Two tops at the same price a few bars apart are more often a pause inside the trend than a reversal, which is why the separation guideline exists at all.
Pattern Tolerance on Futures Charts
Those percentages were built on daily stock data. Carry them onto an index futures chart and the units change enough to change the trade.
Here is the same rule set in ES (E-mini S&P 500) units at an illustrative index level of 7,700. ES moves in ticks of 0.25 index points worth $12.50 per contract, and MES (Micro E-mini S&P 500) ticks are worth $1.25.
| Double top and bottom guideline | Share of price | ES points at 7,700 | ES ticks | Per ES contract | Per MES contract |
|---|---|---|---|---|---|
| Peaks usually less than 3% apart | 3% | 231.00 | 924 | $11,550.00 | $1,155.00 |
| Average variation between two lows | 1% | 77.00 | 308 | $3,850.00 | $385.00 |
| Valley at least 10% deep | 10% | 770.00 | 3,080 | $38,500.00 | $3,850.00 |
Comparing the 3% Pattern Rule With ES Daily Ranges
Bulkowski's double top guideline of peaks less than 3% apart looks tight until you set it against how far ES (E-mini S&P 500) futures actually move. Across the 209 sessions from January 2 to October 30, 2026, the ES daily bar averaged a high-to-low range of 91.00 points (median 80.75). A 3% tolerance at 7,700 is 2.54 times the average daily range. Two daily peaks that far apart are not "the same price" in any useful sense, and on a five-minute chart the gap is even wider relative to bar size.
Setting a Volatility-Based Double Top Tolerance
Bulkowski's 3% peak guideline has not become wrong on futures. It has changed scale. One workable convention (a judgment call, not a published rule) is to set tolerance from the instrument's own volatility on the timeframe you trade, for example about a fifth of the average bar range. A fifth of the 91.00 point average 2026 daily ES range is about 18.20 points. If the two extremes are further apart than your tolerance, you are probably looking at a rising channel or a range, not a double top.
The 10% valley guideline has the same problem on index futures. A 770 point drop between two peaks is a correction, not a pullback, so most index traders judge the valley by whether it forms visible swing structure on their timeframe rather than by a fixed percentage.
Related lesson: Support and resistance
How to Spot a Double Top Pattern
Run these checks in order and stop at the first one that fails. Most double top candidates die at the first or second check.
- An advance into the formation. Bulkowski's tips put it simply: price must have something to reverse, so a small rise into a double top tends to produce a small decline.
- A first peak and a real pullback. The valley should be visible swing structure on your timeframe, not one quiet bar.
- A second peak at or slightly under the first. Inside your tolerance. A second peak that closes well above the first is a breakout, not a top.
- Enough time between the peaks. Bulkowski's double top pages describe the peaks as several weeks apart on daily charts, and most Eve and Adam double tops fall in a 2 to 6 week range. On intraday charts, ask whether the second test happened after the market had time to leave the level.
- Volume, as one vote. Bulkowski notes volume is usually higher on the left peak than on the right one. Lighter volume on the second test fits the story but is not required.
- A close below the neckline. Until then you have two peaks, not a double top.
Bulkowski also splits double tops by the shape of each peak. An "Adam" peak is narrow and pointed, often a one-bar spike. An "Eve" peak is wider and more rounded. The four combinations (Adam and Adam, Adam and Eve, Eve and Adam, Eve and Eve) have different published results, so the label is worth a glance before you set a target.
What Comes After a Double Top
After a confirmed double top, the usual sequence is a break of the neckline, a decline, and often a return to test the broken neckline from below. Bulkowski's pages report a 64% pullback rate for Adam and Adam and for Eve and Adam double tops, where a pullback means price returns to the breakout price within 30 days. A broken neckline that holds as resistance on that return is the retest many traders wait for.
What comes next is not guaranteed to be a decline. If price closes back above the highest peak, the double top is void and the level that looked like resistance has become a launch point.
Related lesson: Triple top and triple bottom
How to Spot a Double Bottom Pattern
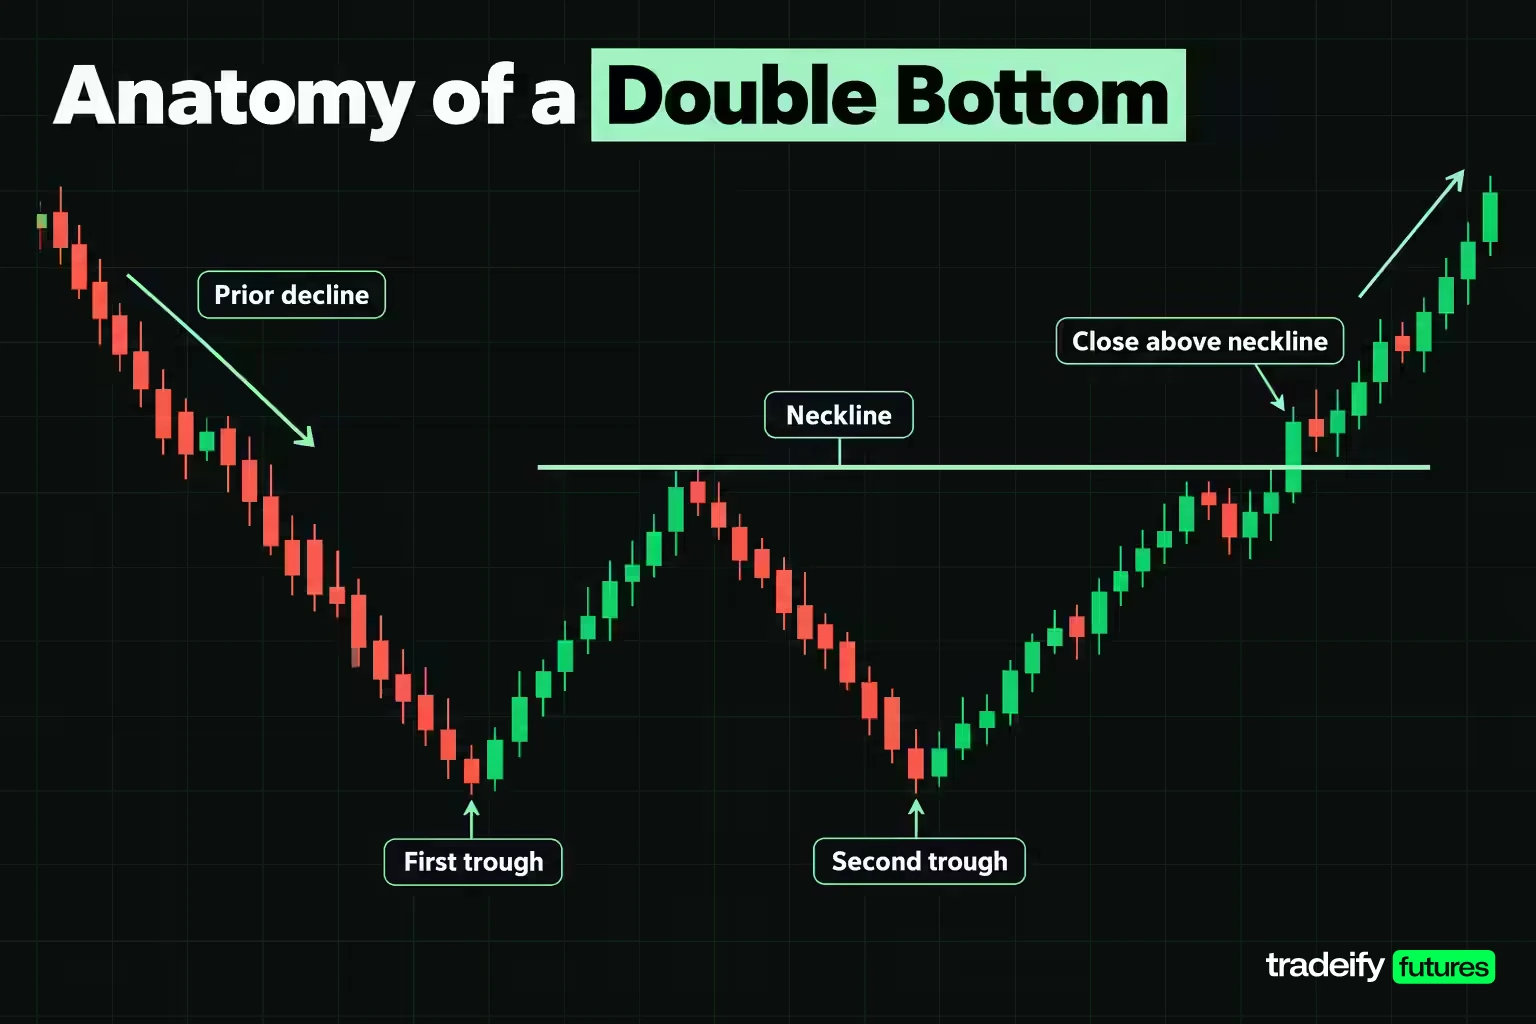
A double bottom uses the same checklist turned upside down: a decline into it, a first low, a rally that forms the neckline, a second low near the first, and a close above the neckline.
Bulkowski's double bottom guidelines describe two valleys that look similar and sit near the same price. The average variation between the lows is 1% for Adam and Adam bottoms, and the Eve and Eve version usually varies between 0% and 6%. Eve and Eve bottoms are usually 2 to 7 weeks apart. The rise between the bottoms should measure at least 10%, though he notes he often ignores that guideline.
A few double bottom details matter for trading decisions:
- Volume is usually higher on the first bottom. The second low printing on lighter volume suggests sellers are thinning out.
- A tall left side helps. Bulkowski's "Big W" tip looks for a steep decline into the pattern with few pauses on the way down, and expects price to return to near where that decline began.
- Throwbacks are common. His Adam and Adam and Eve and Eve double bottom pages report throwback rates of 67% and 65%, meaning price often returns to the breakout price within 30 days after the upward break.
- A small decline in means a small rise out. The same "price must have something to reverse" logic applies.
So is a double bottom bullish? In its normal reading, yes, once it confirms. Before the close above the neckline, a W that is still forming has no direction yet.
How to Confirm a Double Top or Double Bottom
Confirmation is the line between a pattern and two spikes. A double top confirms on a close below the neckline. A double bottom confirms on a close above it.
The research behind that rule is blunt. Bulkowski reports that twin peaks fail to become double tops 60% of the time, with price rising instead of falling. On the bottom side, buying before confirmation leaves a 48% chance that price continues lower without ever confirming the double bottom.
A touch is not a close. A wick through the neckline that closes back inside the formation is often a stop sweep. CMC Markets makes the same point in its own guide: completion requires a close beyond the neckline, not an intraday touch.
Supporting Evidence for a Double Top or Bottom Break
Other tools add weight to a confirmed neckline break on a double top or double bottom, but none of them replaces the close:
- Volume. Expanding volume on the neckline break suggests conviction. CMC Markets also warns that many valid patterns form without textbook volume and that heavy volume can accompany false breakouts just as easily. Treat it as one input.
- Momentum divergence. At a double top, price makes a matching high while an oscillator such as RSI makes a lower high. That shows the second push had less momentum behind it, which fits the reading without confirming it.
- Location. A double top at a prior swing high, a round number or a higher-timeframe resistance level carries more weight than one that forms in open space.
- Higher timeframe trend. A five-minute double top that forms straight into a rising daily trend is a pause more often than a top. Check one timeframe up before you act.
The hardest moment is the bar that is still forming. Price is a tick through the neckline, the move looks obvious, and waiting for the close feels like leaving money on the table. Decide in advance what your confirmation is (for example, a five-minute close beyond the neckline zone) and write it down. If you know the rule before the bar forms, the bar does not get to argue with you.
Related lesson: What is volume
How to Trade the Double Top and Double Bottom Pattern
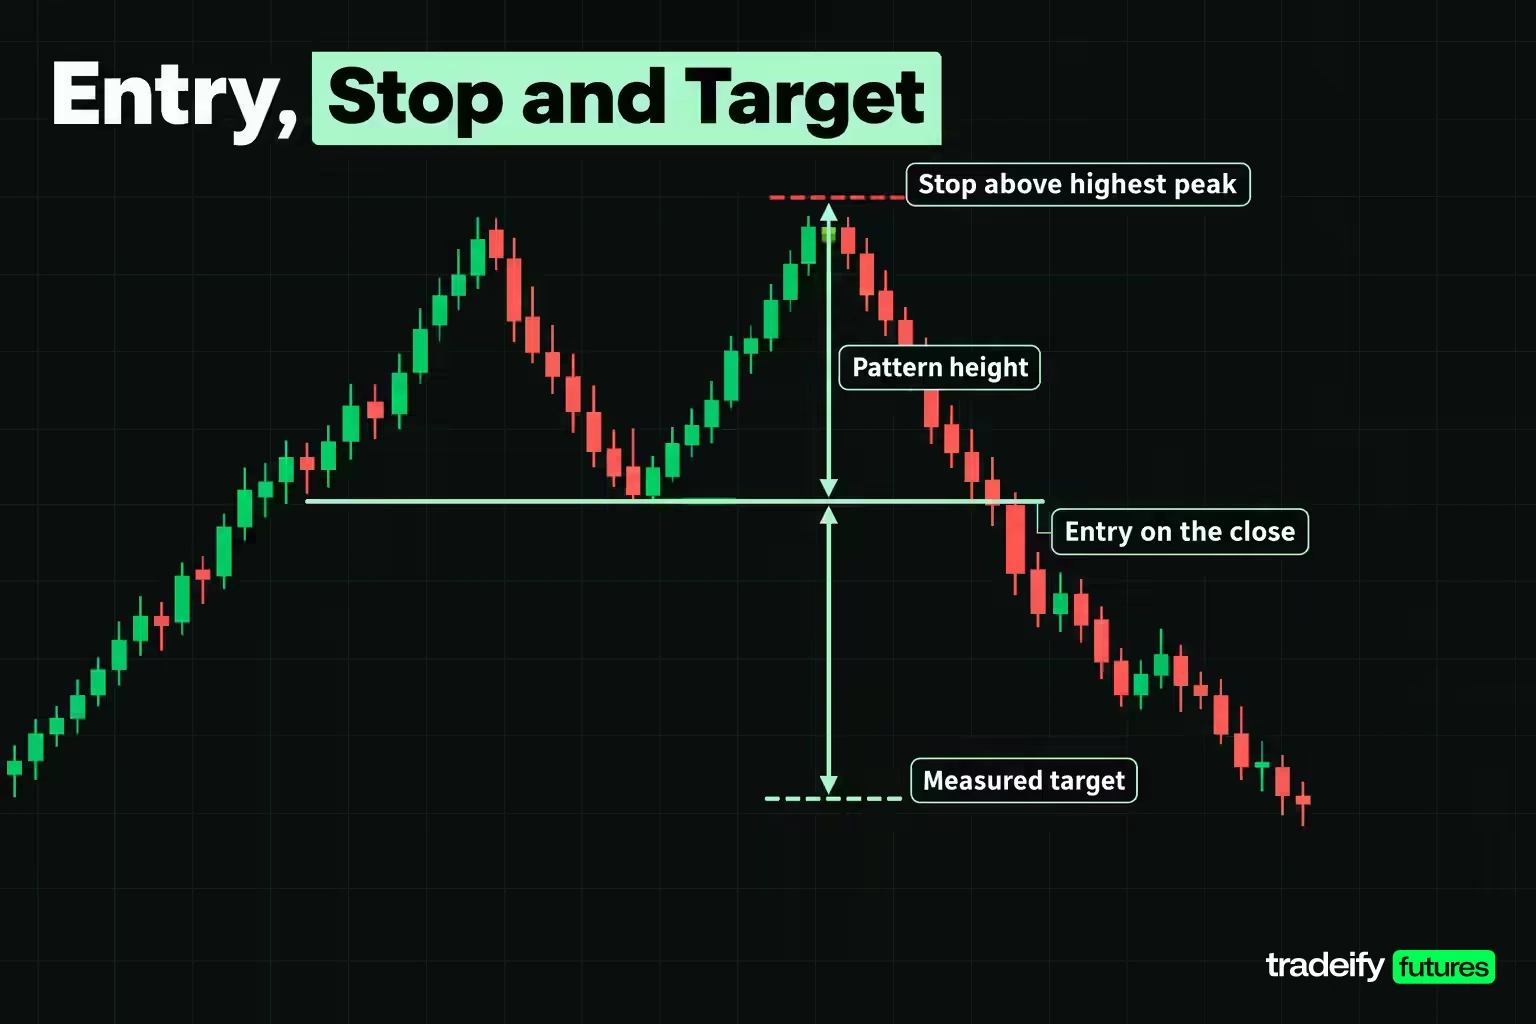
Trading the double top and double bottom pattern comes down to three decisions made before the break: where you enter, where you are wrong, and where you take profit.
Entry, Stop and Target Choices for Double Tops and Bottoms
There are three common entries:
- On the confirming close. Enter when the bar closes beyond the neckline. This is the textbook entry and it fills every confirmed pattern.
- On the retest. Wait for price to return to the broken neckline and hold it from the other side. This entry gives a better price but does not always arrive.
- Before confirmation. Enter at the second extreme. This gives the tightest stop, but Bulkowski's unconfirmed failure figures (60% for twin peaks, 48% for twin troughs) apply in full.
The stop usually goes beyond the outermost extreme of the pattern: a little above the highest peak of a double top or below the lowest trough of a double bottom. That is the price where the reading is wrong. Bulkowski's own tip is a stop just past that extreme, or a volatility stop if it is too far away.
The target is the measure rule. Take the pattern height (highest peak to neckline for a top, neckline to lowest trough for a bottom) and project it from the neckline. Bulkowski also suggests a more conservative version: multiply the height by the pattern's "percentage meeting price target" before projecting it.
Here is the part most guides skip. If you enter on the confirming close, your stop is at least one full pattern height away, because it sits beyond the extreme and you are already past the neckline. Your full target is at most one height away, because it is measured from the neckline you have already crossed. So the textbook confirmed-close trade always has reward smaller than risk, which means it needs a win rate above 50% just to break even. The retest entry and a tighter stop rule are the two ways to change that.
Worked Double Top on a Five-Minute ES Chart
The prices in this example are illustrative round levels, not a record of a real session.
- First peak: 7,700.00. Neckline (the low between the peaks): 7,668.00.
- Second peak: 7,698.00, eight ticks under the first.
- A five-minute bar closes at 7,666.00, below the neckline. The double top confirms.
- Height: 7,700.00 minus 7,668.00 = 32.00 points, which is 128 ticks or $1,600.00 per ES contract.
- Full target: 7,668.00 minus 32.00 = 7,636.00.
- Stop: 7,701.00, four ticks above the highest peak.
| ES double top entry | Entry price | Risk | Reward to target | Reward to risk | Breakeven win rate |
|---|---|---|---|---|---|
| Confirming close | 7,666.00 | 140 ticks, $1,750.00 | 120 ticks, $1,500.00 | 0.86 | 53.8% |
| Retest of the neckline | 7,670.00 | 124 ticks, $1,550.00 | 136 ticks, $1,700.00 | 1.10 | 47.7% |
| Second peak, before confirmation | 7,698.00 | 12 ticks, $150.00 | 248 ticks, $3,100.00 | 20.67 | 4.6% |
The third row is the one that catches traders. A 12 tick stop against a 248 tick target looks like the trade of the month. The math is fine. The assumption under it is not: a three point stop on ES sits inside ordinary five-minute noise, and the entry is taken before the pattern exists, when the published follow-through for twin peaks is worse than a coin flip.
The retest is the only version where reward grows while risk shrinks. It is also the version that sometimes never comes. Decide before the break whether you will chase a move that does not retest, by how many ticks, or whether a missed retest is simply a missed trade.
Execution Cost on Each Double Top Entry
Fills are rarely perfect. Add one tick of slippage on the entry and one tick on the stop, which is modest for a market order and a stop order in a normal session:
| Entry with one tick of slippage each side | Net risk | Net reward | Net reward to risk | Net breakeven win rate |
|---|---|---|---|---|
| Confirming close | 142 ticks, $1,775.00 | 119 ticks, $1,487.50 | 0.84 | 54.4% |
| Retest of the neckline | 126 ticks, $1,575.00 | 135 ticks, $1,687.50 | 1.07 | 48.3% |
| Second peak, before confirmation | 14 ticks, $175.00 | 247 ticks, $3,087.50 | 17.64 | 5.4% |
Two ticks of slippage barely move the wide-stop entries. On the 12 tick stop they add about 17% to the risk. Commissions push the same way, so the tighter the stop, the more of it you give away before the market moves.
Worked Double Bottom on MNQ
The same logic runs in reverse on MNQ (Micro E-mini Nasdaq-100), where a tick of 0.25 index points is worth $0.50. Prices are illustrative.
- Lows at 28,000.00 and 28,004.00. Neckline (the rally high between them): 28,216.00.
- A close at 28,218.00 confirms the double bottom.
- Height: 216.00 points, 864 ticks, $432.00 per MNQ contract. Full target: 28,432.00.
- Stop: 27,990.00, ten points below the lower trough.
- Risk: 228.00 points, 912 ticks, $456.00. Reward to the full target: 214.00 points, 856 ticks, $428.00. Reward to risk 0.94, breakeven win rate 51.6%.
Now apply Bulkowski's conservative target. His Adam and Adam double bottom page lists a 73% "percentage meeting price target", so the scaled target is 28,216.00 plus 73% of 216.00, which rounds to 28,373.75 on the tick grid. The reward drops to 155.75 points (623 ticks, $311.50), reward to risk falls to 0.68 and the breakeven win rate rises to 59.4%.
That is the tradeoff in one line: the closer target is reached more often but pays less, so the entry has to improve (a retest, or a tighter stop justified by structure) for the trade to make sense.
Related lesson: Risk reward ratio
Double Top Pattern Examples on Real ES Charts
These examples use daily ES bars (Yahoo Finance's continuous ES=F series) for 2026. They are historical observations, not trades anyone took, and the continuous series joins contract months at each roll, so levels can shift slightly around expiration.
ES Double Top From January 2026 That Reached Its Target
- First peak: January 28, 2026, high 7,043.00.
- Second peak: February 11, 2026, high 7,011.50. That is 31.50 points (0.45%) under the first peak, well inside a volatility-based tolerance.
- Neckline: the February 6 low at 6,751.50. Height 291.50 points, 4.14% of the peak.
- The touch that was not a close: on March 3, ES traded down to 6,718.75, under the neckline, then closed at 6,824.75, back above it. Anyone who sold the touch sat through a bounce.
- Confirmation: March 6 closed at 6,743.75, below the neckline, 16 sessions after the second peak.
- Target: 6,751.50 minus 291.50 = 6,460.00. ES reached it on March 27, when the low was 6,389.00. The stop above the highest peak was never touched.
Look at what that trade asked of you. From the confirming close to a stop one tick above 7,043.00, the risk was 299.50 points (1,198 ticks), or $14,975.00 per ES contract and $1,497.50 per MES contract, for 283.75 points of reward. Reward to risk was 0.95. On March 9 ES opened at 6,685.50, fell to 6,584.50 and closed at 6,801.00, back above the neckline, so holding to the target also meant sitting through a close on the wrong side of the line. The pattern worked. The ride was not clean, and a trader who needed it to be clean would probably have been shaken out before the target.
ES Double Top From July 2026 That Failed
- Peaks: June 22, 2026, high 7,599.25, and July 16, 2026, high 7,632.00 (32.75 points, 0.43% apart). An earlier June 1 high at 7,632.25 sat at the same level, so the market had tested it three times.
- Neckline: the June 26 low at 7,357.25. Height 274.75 points, 3.60%.
- Confirmation: July 29 closed at 7,351.25, six points under the neckline.
- What happened next: July 30 closed at 7,472.50, back above the neckline. On August 3, ES traded to 7,637.75, through the stop above the highest peak, and on August 4 it reached 7,786.00.
- Target never reached: the measured target was 7,082.50.
The stop from that confirming close was 281.00 points, $14,050.00 per ES or $1,405.00 per MES. A confirmed break of a few points with no follow-through is one of the most common ways the pattern fails, and it is why a neckline drawn as a zone (with confirmation requiring a close clearly beyond it) filters some of these out.
Ten-Year Scan of ES Daily Double Tops and Bottoms
To see how often the textbook sequence happens on one index future, this guide ran a mechanical scan of ES=F daily bars from January 4, 2016 to October 30, 2026 (2,724 sessions) with rules fixed before looking at the results:
- A swing high (or low) is a bar whose high (or low) exceeds the five bars on each side.
- Two consecutive swing highs (or lows) 10 to 60 sessions apart, within 1% of each other, with a valley (or rally) between them at least 3% deep.
- Confirmation is a close through the neckline within 20 sessions of the second extreme, before any close beyond the outermost extreme (which voids the pair).
- From the confirming close, the outcome is whichever comes first within 60 sessions: the full measured target or the outermost extreme. A bar touching both counts as a stop.
What the ES Double Top and Bottom Scan Found
The results of this guide's own ES daily scan (2016 to 2026, rules as listed in the scan method):
| ES daily scan result | Double tops | Double bottoms |
|---|---|---|
| Qualifying pairs of extremes | 26 | 15 |
| Confirmed by a close through the neckline | 8 | 9 |
| Voided by a close beyond the outer extreme first | 14 | 4 |
| Neither within 20 sessions | 4 | 2 |
| Confirmed, then full target reached first | 3 | 5 |
| Confirmed, then stop reached first | 4 | 4 |
| Confirmed, neither within 60 sessions | 1 | 0 |
| Reward to risk below 1 at the confirming close | 8 of 8 | 9 of 9 |
Only 30.8% of the double top candidates confirmed, and 53.8% were voided by a close above the higher peak first. That is the same story as Bulkowski's 60% figure for unconfirmed twin peaks, told on an index that rose for most of the decade. Double bottoms confirmed more often (60.0%), which fits the same upward drift.
Treat the scan as an illustration, not a statistic you can trade on. The samples are small, one market and one timeframe were tested, the continuous contract jumps at rolls, and daily bars cannot show which of the target or stop was touched first inside a bar. The bottom row is not a sample result at all; it follows from the geometry of entering beyond the neckline with a stop beyond the extreme.
Related lesson: Multiple timeframe analysis
Risk Management for Double Top and Bottom Trades
The pattern sets the stop distance. Your risk budget sets the position size. Get those in the wrong order and a reasonable setup turns into an oversized loss.
Take a 140 tick stop, which is the distance in an illustrative five-minute ES double top entered on the confirming close. The same stop costs very different amounts per contract:
| Instrument for a 140 tick stop | Tick value | Risk per contract | Contracts within a $500 risk budget | Contracts within a $1,000 risk budget |
|---|---|---|---|---|
| ES (E-mini S&P 500) | $12.50 | $1,750.00 | 0 | 0 |
| MES (Micro E-mini S&P 500) | $1.25 | $175.00 | 2 | 5 |
| MNQ (Micro E-mini Nasdaq-100) | $0.50 | $70.00 | 7 | 14 |
A pattern that needs a wide stop is not a smaller opportunity. It is a larger risk per contract, and the honest answers are a smaller contract or a skip. Moving the stop inside the pattern to fit one ES contract just puts the stop where the market can hit it without the pattern being wrong.
Execution Cost and Tight Double Top Stops
Cost works against tight stops on any double top or double bottom trade. Assume two ticks of total cost per trade (slippage on the way in and out):
| Stop distance in ticks | ES points | Risk per ES contract | Risk per MES contract | Two ticks of cost as a share of risk |
|---|---|---|---|---|
| 12 | 3.00 | $150.00 | $15.00 | 16.7% |
| 24 | 6.00 | $300.00 | $30.00 | 8.3% |
| 48 | 12.00 | $600.00 | $60.00 | 4.2% |
| 140 | 35.00 | $1,750.00 | $175.00 | 1.4% |
Daily Double Top Patterns and Intraday Risk
Daily-chart double tops and bottoms are a different scale again. The January to March 2026 ES double top needed 299.50 points of stop room from its confirming close, $14,975.00 on one ES contract, and three weeks to reach its target. Daily patterns are useful as context for intraday trades, but holding one as a trade is a multi-week swing position with a stop most intraday risk budgets cannot carry.
Some traders use simple caps such as the informal 3-5-7 rule (3% of the account at risk per trade, 5% across all open positions). Whatever cap you use, size every double top or bottom trade from the stop the pattern requires, and decide in advance what happens if the retest never comes.
On our accounts, every position is closed by 4:45 PM ET and nothing is held overnight, so a daily double top that takes weeks to play out cannot be carried as a swing trade on a Tradeify account. The daily pattern can still frame the session, but the trade itself has to be an intraday setup that fits one session and our contract limits, for example 4 minis or 40 micros on a 50K account, where 10 micros count as one mini. Our evaluation and funded accounts are simulated.
Related lesson: Position sizing futures contracts
Strengths and Limitations of Double Tops and Bottoms
The strengths are practical. The formation is easy to define, it gives a clear invalidation level, it supplies a measured target, and it works on any liquid market and timeframe because it is built from swing highs and lows rather than a specific indicator.
The limitations are in the numbers. Bulkowski's bull-market results for daily stock charts:
| Double top and bottom variant | Overall rank | Break-even failure rate | Average move after breakout | Percentage meeting price target | Sample |
|---|---|---|---|---|---|
| Adam and Adam double top | 19 of 36 | 25% | 15% decline | 64% | 1,114 |
| Adam and Eve double top | 10 of 36 | 21% | 16% decline | 54% | 651 |
| Eve and Adam double top | 16 of 36 | 21% | 15% decline | 55% | 662 |
| Eve and Eve double top | 12 of 36 | 20% | 16% decline | 43% | 942 |
| Adam and Adam double bottom | 26 of 39 | 16% | 39% rise | 73% | 1,154 |
| Adam and Eve double bottom | 17 of 39 | 12% | 43% rise | 69% | 1,020 |
| Eve and Adam double bottom | 20 of 39 | 12% | 42% rise | 72% | 759 |
| Eve and Eve double bottom | 5 of 39 | 12% | 50% rise | 65% | 952 |
Bulkowski's break-even failure rate is the share of patterns that failed to move at least 5% after the breakout. Read the table with three cautions. These are confirmed patterns, so the 60% and 48% unconfirmed failure rates come first. They are daily stock results in his bull-market periods, not intraday futures. And "percentage meeting price target" counts patterns that reached the target at any point, not before a stop, so it is not a win rate.
Even so, the shape of the evidence is clear. Double bottoms have the stronger record in his data, the Eve and Eve double bottom ranks 5 of 39 in his performance ranking, and double tops sit mid-pack with a quarter or less of confirmed patterns failing to move 5%.
Common Double Top and Bottom Failure Modes
| Double top or bottom failure mode | What it looks like on the chart | The correction |
|---|---|---|
| Entering at the second extreme | A tiny stop and a huge paper reward | Wait for the close through the neckline and accept the wider stop |
| Copying the 3% tolerance | Two extremes far apart read as the same price | Set tolerance from the instrument's average range on your timeframe |
| Second extreme overshooting | The "top" closes above the first peak and gets relabelled after the loss | Past your tolerance, treat it as a breakout, not a top |
| Trading a wick as a close | Entry triggers on a sweep that closes back inside the formation | Define confirmation as a close beyond the neckline zone |
| Neckline drawn as a hairline | A few ticks of noise trigger and reverse the trade | Draw the neckline as a zone and require a clear close past it |
| Assuming volume | No volume signature, pattern taken anyway, or volume treated as proof | Use volume as one input, not a gate |
| Retest that never comes | A missed entry turns into a chased one | Pre-commit to a chase limit or to skipping the trade |
| Nothing to reverse | A double top after a small rise, or late in a long decline | Ask what the formation is reversing before sizing the target |
Two of those rows do most of the damage. The early entry and the copied tolerance both come from reading the pattern as a shape instead of a level test, and both produce a stop the market can reach without anything being invalidated.
Related lesson: Head and shoulders patterns
Double Top and Double Bottom FAQ
Is a double bottom bullish?
Yes, a double bottom is a bullish reversal pattern once price closes above the neckline between the two lows. Before that close, Bulkowski's research shows a 48% chance price keeps falling without confirming. The bullish reading starts at confirmation, not at the second low.
Is the double top pattern bullish or bearish?
A double top is bearish. It forms after an advance, and a close below the low between the two peaks signals a possible reversal lower. If price instead closes above the highest peak, the pattern is void and the move often continues higher.
What comes after a double top pattern?
After a confirmed double top, price often declines, then returns to test the broken neckline from below. Bulkowski reports a 64% pullback rate for Adam and Adam double tops. The measured target is the pattern height subtracted from the neckline, but it is an estimate, not a destination.
Which chart pattern is most profitable?
No chart pattern is reliably the most profitable; results depend on the market, the timeframe and your entry and exit rules. In Bulkowski's daily stock rankings, the Eve and Eve double bottom ranks 5 of 39 patterns with upward breakouts. Test any pattern on your own instrument before trusting a published ranking.
What is the 3-5-7 rule in trading?
The 3-5-7 rule is an informal risk guideline that caps risk at 3% of the account per trade and 5% across all open positions, and aims for winners at least 7% larger than losers. It is not an industry standard, and the third number is applied differently by different traders. Many traders use a lower per-trade figure than 3%.
Do double tops and double bottoms work on a five-minute chart?
They form on intraday charts and follow the same logic, but the tolerance has to be rescaled. A 3% band at 7,700 on ES is 231.00 points, far more than an average 2026 ES daily range of 91.00 points. Scale the tolerance to the average bar range of the timeframe you trade.
What invalidates a double top?
A close above the highest peak in the formation invalidates a double top. That is why the stop usually sits just above that peak. A second peak that overshoots the first by more than your tolerance was never a double top.
What is the difference between a double top and a triple top?
A double top tests one resistance level twice before breaking its neckline, while a triple top tests it three times. The neckline logic, confirmation rule and measure rule are the same. A level that holds three times often marks stronger resistance, but the break still has to close through the neckline.
Double Top and Bottom Trading Risk Note
This article is education, not investment advice, and nothing in it recommends buying or selling any instrument. Futures are leveraged, and losses can exceed what you expect or the amount you planned to risk; stop orders can fill at worse prices in fast markets. The five-minute and MNQ examples use illustrative prices, the 2026 ES examples are historical observations, and the ten-year scan is a small study that says nothing about future results. Published pattern statistics come from historical stock data. Evaluation and funded accounts are simulated, and simulated results do not predict live trading outcomes.


