




TL;DR: A triple top and triple bottom pattern is three failed tests of one level, confirmed only by a close through the swing between them. A triple top is bearish and a triple bottom is bullish. In Bulkowski's data, 74% of triple bottoms met their target against 49% of triple tops. The stop you choose changes the trade more than the pattern does.
A triple top and triple bottom pattern is a reversal chart pattern in which price tests the same level three times, fails each time, and then breaks in the opposite direction. The triple top is three failed attempts at a new high and is bearish. The triple bottom is three failed attempts at a new low and is bullish.
What Is a Triple Top and Triple Bottom Pattern

A triple top and triple bottom pattern is a pair of mirror-image reversal patterns built from three tests of one price level. Both are classed as reversal patterns because they appear at the end of a trend and, once confirmed, point the other way.
A triple top forms after an uptrend. Price rallies to a high, pulls back, rallies to roughly the same high, pulls back again, and makes a third attempt that also fails. The level that stopped all three rallies acts as resistance. The pattern turns bearish only when price closes below the lowest valley between the three peaks.
A triple bottom forms after a downtrend. Price falls to a low, bounces, falls to roughly the same low, bounces again, and makes a third attempt lower that also fails. The level that held all three declines acts as support. The pattern turns bullish only when price closes above the highest peak between the three valleys.
Every valid triple top or triple bottom has the same four parts:
- A trend leading into the first touch, up for a top and down for a bottom.
- Three touches of roughly the same level.
- Two intervening swings between the touches.
- A close beyond the confirmation line, which is the lowest of the two valleys in a top or the highest of the two peaks in a bottom.
Many traders call that confirmation line the neckline, borrowing the term from head and shoulders patterns. The name does not matter. What matters is that a triple top or bottom without the close is only a shape that might become a pattern.
Related lesson: Support and resistance
The Market Psychology Behind a Triple Top or Bottom
The psychology behind a triple top starts with a trend that is still winning. Buyers push price to a new high, and sellers meet them there. The first rejection looks like an ordinary pullback, so dip buyers step in and drive price back up.
The second rejection at the same level is where doubt starts. Buyers who chased the second rally are now holding a position that has gone nowhere. Sellers have learned where to wait.
The third rejection is the important one. It shows that buyers had a third chance, with the level clearly visible to everyone, and still could not clear it. Each test also leaves trapped longs above the confirmation line. When price finally closes under the lowest valley, those traders hold losing positions, and their exits can add to the decline.
A triple bottom runs the same story in reverse. Sellers press price to a low three times, buyers absorb the selling each time, and the shorts who sold the third test are trapped once price closes above the highest peak in the pattern.
This is also why volume matters to the story. In Bulkowski's triple top data, volume trends downward across the pattern 62% of the time, though it is usually high beneath each peak. In his triple bottom data, volume trends downward 61% of the time and is usually heavier on the first bottom than the last. Fading volume fits a trend that is running out of participants.
The temptation is to treat the third touch as the signal. It is not. The third touch is the moment everyone can see the level, which makes it the most crowded point in the formation, not the most informative one. The close through the confirmation line is the point where one side actually gives up.
How to Identify a Triple Top or Triple Bottom
Identifying a triple top or triple bottom comes down to a short set of checks, run in order, before any trade idea forms.
- Find the trend into the pattern. A triple top needs a rise leading in, and a triple bottom needs a decline leading in.
- Mark three touches of the same level. Bulkowski describes the triple top as three peaks near the same price and the triple bottom as three valleys that look similar, with small variations allowed. The touches do not need to match to the tick.
- Mark the two swings between the touches. For a top, these are two valleys. For a bottom, these are two peaks.
- Check the middle swing. In a triple top, if the middle peak is clearly above the other two, the pattern is a head and shoulders top. In a triple bottom, if the middle valley is clearly lower than the other two, it may be a head and shoulders bottom.
- Mark the confirmation line at the lowest valley (top) or highest peak (bottom), and measure the height from the pattern extreme to that line.
- Check volume. A falling volume trend across the formation supports the reversal read.
Touch tolerance for a triple top or bottom
There is no official tolerance for how close the three touches must be. A practical approach is to judge the touches relative to the pattern height. If the peaks spread across a band that is small next to the distance down to the confirmation line, they are testing one level. If the spread is a large share of the height, you are probably looking at a rising or falling sequence, not a triple.
Take an illustrative ES triple top with peaks at 6900.00, 6895.00 and 6902.00 and a lowest valley at 6840.00. The peaks sit inside a 7.00-point band while the pattern is 62.00 points tall. That is a tight cluster. If the same peaks had spread across 30 points of a 62-point pattern, you would be stretching the label to fit the trade you wanted.
Lookalike patterns to rule out
Bulkowski flags a few patterns that can pass for a triple top or bottom:
- Head and shoulders top or bottom, when the middle touch is the extreme.
- A right-angled descending broadening formation, which can look like a triple top.
- A right-angled ascending broadening formation, which can look like a triple bottom.
Bulkowski also notes that in a triple top the middle peak is sometimes priced marginally below the other two. That still counts as a triple top. The test is whether the middle peak clearly stands out as the high, not whether the three peaks are identical.
Related lesson: Head and shoulders patterns
Why the Trend Into a Triple Pattern Matters
The trend leading into a triple pattern decides whether three touches are a reversal or just a range. A reversal pattern needs something to reverse. Three equal highs inside a sideways market are a range with a ceiling, and trading them as a triple top means selling a market that was never trending up.
Bulkowski's trading tips make the same point in plain terms. For triple tops, if the rise leading to the pattern is small, expect a small decline. A high-velocity rise into the pattern often leads to a larger decline after the breakout. His glossary measures the prevailing trend as the intermediate-term trend, about 3 to 6 months, leading into the pattern on his stock charts.
For triple bottoms, the guidance cuts the other way. He advises avoiding triple bottoms that appear after an extensive uptrend, because the breakout is apt to disappoint, and notes that patterns with a short- to intermediate-term decline of up to 6 months leading in perform best. If a triple bottom forms just under an earlier peak, the rise after the breakout is apt to stall at that peak.
A simple trend filter for a futures chart works like this:
- For a triple top, the swing lows before the first peak should be rising, and the first peak should be a new high for that leg.
- For a triple bottom, the swing highs before the first valley should be falling, and the first valley should be a new low for that leg.
- If you cannot name the trend in one sentence, treat the three touches as a range and skip the reversal trade.
Related lesson: Market structure highs lows and trends
Triple Top and Triple Bottom Confirmation Rules
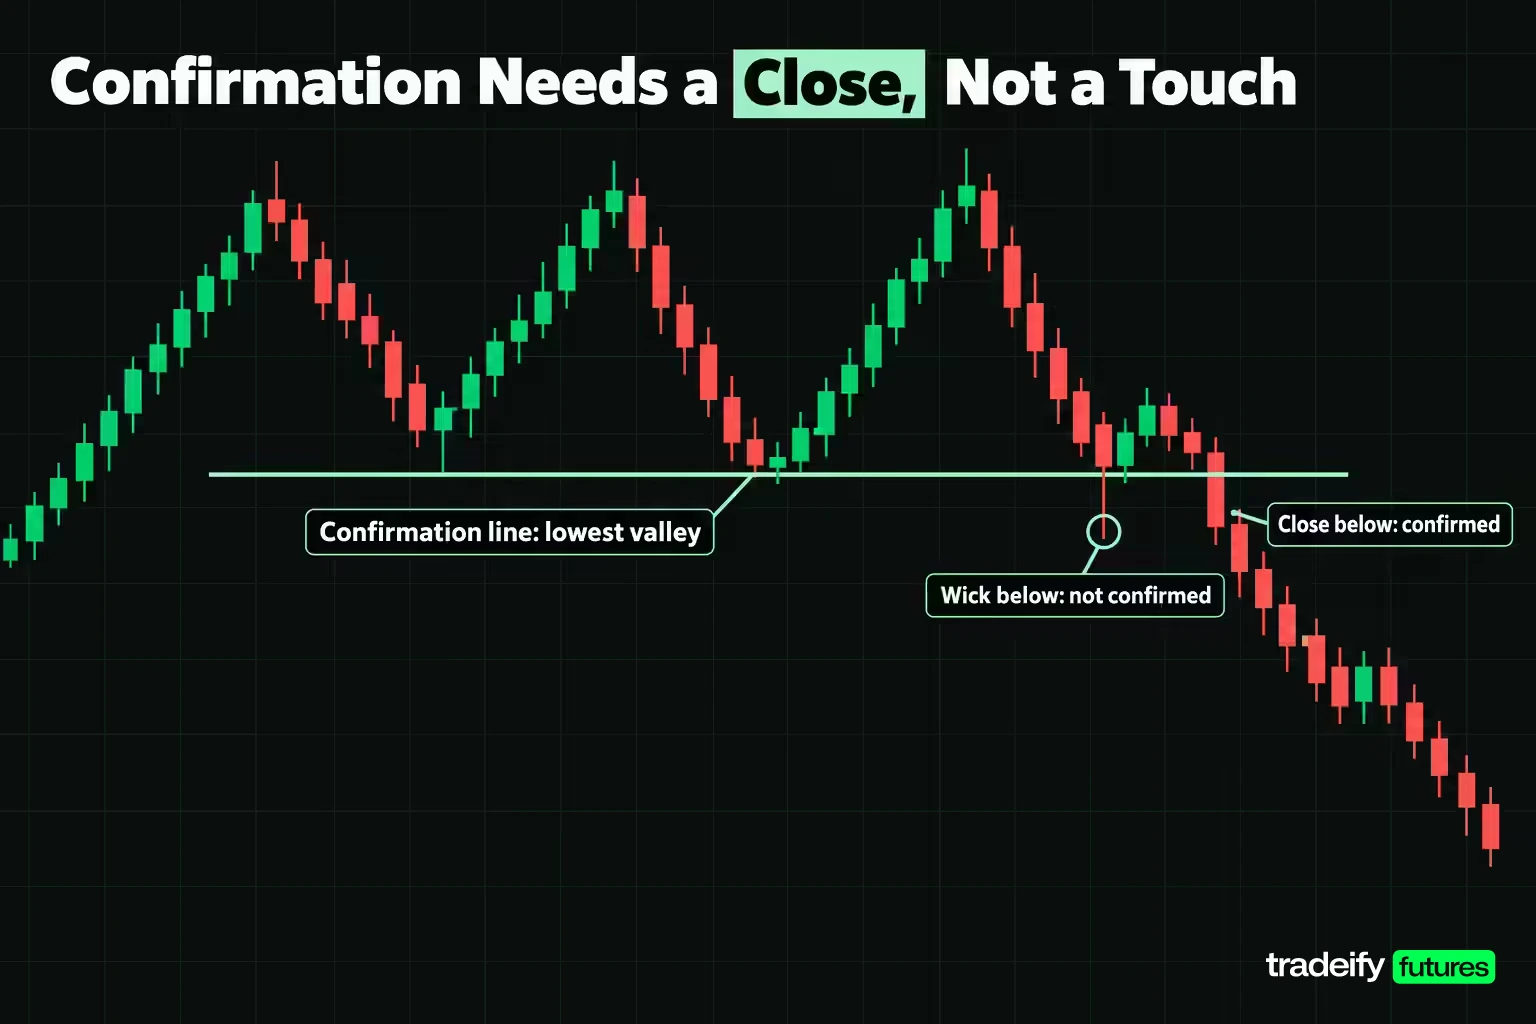
Confirmation for a triple top or triple bottom is a close beyond the confirmation line on the timeframe you are trading. Bulkowski's rule for the triple top is that the pattern becomes valid when price closes below the lowest valley in the pattern, and he says to wait for that close before placing a trade. For the triple bottom, the pattern confirms once price closes above the highest peak between the valleys.
The rule has three details that change how you trade it.
First, it is a close, not a touch. An intraday poke through the line that closes back inside the pattern is not confirmation. On a 15-minute chart, that means the 15-minute bar must close through the line. On a daily chart, it means the session close.
Second, the line is the extreme swing, not the nearest one. In a triple top with valleys at 6840.00 and 6846.00, the confirmation line is 6840.00. A close at 6844.00 breaks one valley but not the pattern.
Third, many triples never confirm. Bulkowski writes that triple bottoms are rare and that price often continues down without confirming the pattern. A third touch that holds, followed by a bounce that stalls short of the confirmation line, is not a failed triple bottom. It is a pattern that never formed.
Volume at the break is a secondary check. A close through the line on rising volume suggests real participation. A thin break on a quiet session is more likely to be pulled back inside the pattern. Bulkowski found that a downward volume trend across a triple top helps post-breakout performance only slightly, by about one percentage point, so do not treat volume as a required trigger.
Related lesson: Trade setups and confirmation
Triple Top vs Triple Bottom in the Published Data
The triple top and the triple bottom are mirror images on the chart, but the most-cited study of them says they are not the same trade. Thomas Bulkowski's results, published on his pattern site with the triple top statistics updated on 8/27/2020, separate them clearly.
| Measure (Bulkowski data) | Triple top | Triple bottom |
|---|---|---|
| Direction | Bearish reversal | Bullish reversal |
| Trend leading in | Upward | Downward |
| Confirmation | Close below the lowest valley | Close above the highest peak between valleys |
| Overall performance rank | 24 out of 36 | 12 out of 39 |
| Break even failure rate | 25% | 13% |
| Average move after breakout | 14% decline | 46% rise |
| Return to breakout price | 66% pullback rate | 65% throwback rate |
| Percentage meeting price target | 49% | 74% |
| Sample | 1,964 perfect trades | more than 2,500 perfect trades |
Two definitions matter for reading that table. Bulkowski's break even failure rate counts patterns that fail to move at least 5% in the breakout direction. So a 13% failure rate for triple bottoms does not mean 87% of trades won. It means 87% moved at least 5% the right way after the breakout. A pullback or throwback is a return to the breakout price within 30 days.
His own summaries are blunt. Of triple tops, he writes that the failure rate is higher than he likes to see and the average decline is meager. Of triple bottoms, he describes a reasonable failure rate and decent rise that give them a solid performance rank.
Why the triple bottom outperforms the triple top
The statistics do not explain why, so treat any explanation as interpretation. Two are worth holding in mind.
The first is market drift. Bulkowski's numbers are bull market results on stocks, and a reversal that trades with a rising market has a tailwind that a bearish reversal does not.
The second is what each pattern sells into. A triple top asks you to sell a market that is still in an uptrend and has not broken anything yet. A triple bottom asks you to buy a market whose sellers have failed three times. Uptrends often resume after a stall, which may be part of why the triple top's average decline is so small.
The practical takeaway is not to avoid triple tops. It is to ask more of them before you commit: a tighter stop, a nearer target, or a better location.
Triple Patterns vs Double Tops and Double Bottoms
A triple top or bottom is a double top or bottom with one more failed test. The extra touch sounds like extra strength, but the published data does not reward it in a simple way.
| Pattern (Bulkowski data) | Performance rank | Break even failure rate | Average move | Meeting price target |
|---|---|---|---|---|
| Triple top | 24 out of 36 | 25% | 14% decline | 49% |
| Adam and Adam double top | 19 out of 36 | 25% | 15% decline | 64% |
| Head and shoulders top | 9 out of 36 | 19% | 16% decline | 51% |
| Triple bottom | 12 out of 39 | 13% | 46% rise | 74% |
| Adam and Adam double bottom | 26 out of 39 | 16% | 39% rise | 73% |
| Head and shoulders bottom | 13 out of 39 | 11% | 45% rise | 71% |
Source for every row: Bulkowski's bull market results on his pattern site. The Adam and Adam rows are one of his four double-top and double-bottom variants (narrow, pointed turns), used here because it is a common shape. Other variants have their own numbers.
Read the table this way. On the bearish side, the triple top does not beat the double top it grows out of: same failure rate, smaller average decline, and a lower share meeting target. On the bullish side, the triple bottom outranks the Adam and Adam double bottom with a lower failure rate and a larger average rise.
Structural differences between triple and double patterns
Structurally, the differences between triple and double patterns are simple:
- A double top has one valley between two peaks, so the confirmation line is that valley. A triple top has two valleys, and the lower one is the line.
- A triple pattern takes longer to form, which gives you more time to plan but also more time for the trend to resume.
- A double top that holds and turns down again may be turning into a triple top, which is why a trader who shorted the second peak early often ends up stopped out on the third.
Bulkowski's double top page puts a number on that early-entry risk. He writes that twin-peak patterns fail 60% of the time, meaning price rises instead of drops, while confirmed Adam and Adam double tops fail 25% of the time. Confirmation does the heavy lifting in both patterns.
Related lesson: Double top and double bottom
Entry Timing on a Triple Top or Bottom Breakout
Entry timing on a triple top or bottom comes down to three choices. None is correct for every chart; each one trades price for certainty in a different way.
Anticipation entry at the third touch
Selling the third peak or buying the third valley gives the best price and the smallest stop, because the stop sits just beyond the touch. The cost is that you are trading a pattern that does not exist yet. The same level could hold a fourth time, or break in the trend direction. Bulkowski's double top figure, that unconfirmed twin peaks fail 60% of the time, is a reminder of how often the early read is wrong. Anticipation is a separate strategy (fading resistance or support) and should be judged on its own record, not borrowed from the triple pattern's statistics.
Close-confirmation entry
Entering on, or just after, the close beyond the confirmation line is the textbook entry. It is the version the published statistics describe, since Bulkowski measures from confirmed patterns. The cost is price: by the time the bar closes, price may be several points beyond the line, and the stop sits further away.
Retest entry after a pullback or throwback
A retest entry on a triple top or bottom waits for price to return to the confirmation line after the break and enters there. Bulkowski's data says this return is common: a 66% pullback rate for triple tops and a 65% throwback rate for triple bottoms, measured as a return to the breakout price within 30 days. The retest entry usually gives a better price and a tighter stop.
The cost is missed trades. About a third of the time, price never comes back, and the retest trader watches the move leave without them. Bulkowski also notes that pullbacks and throwbacks hurt post-breakout performance, so a pattern that does retest tends to move less afterward.
A workable rule is to decide in advance which entry you are using and write it down. The hard moment is watching price leave the line without you. Switching from "I wait for the retest" to "I chase the close" after the move starts is how a planned trade turns into an impulse trade, usually at the worst price of the day.
Stop Loss Placement for Triple Tops and Bottoms
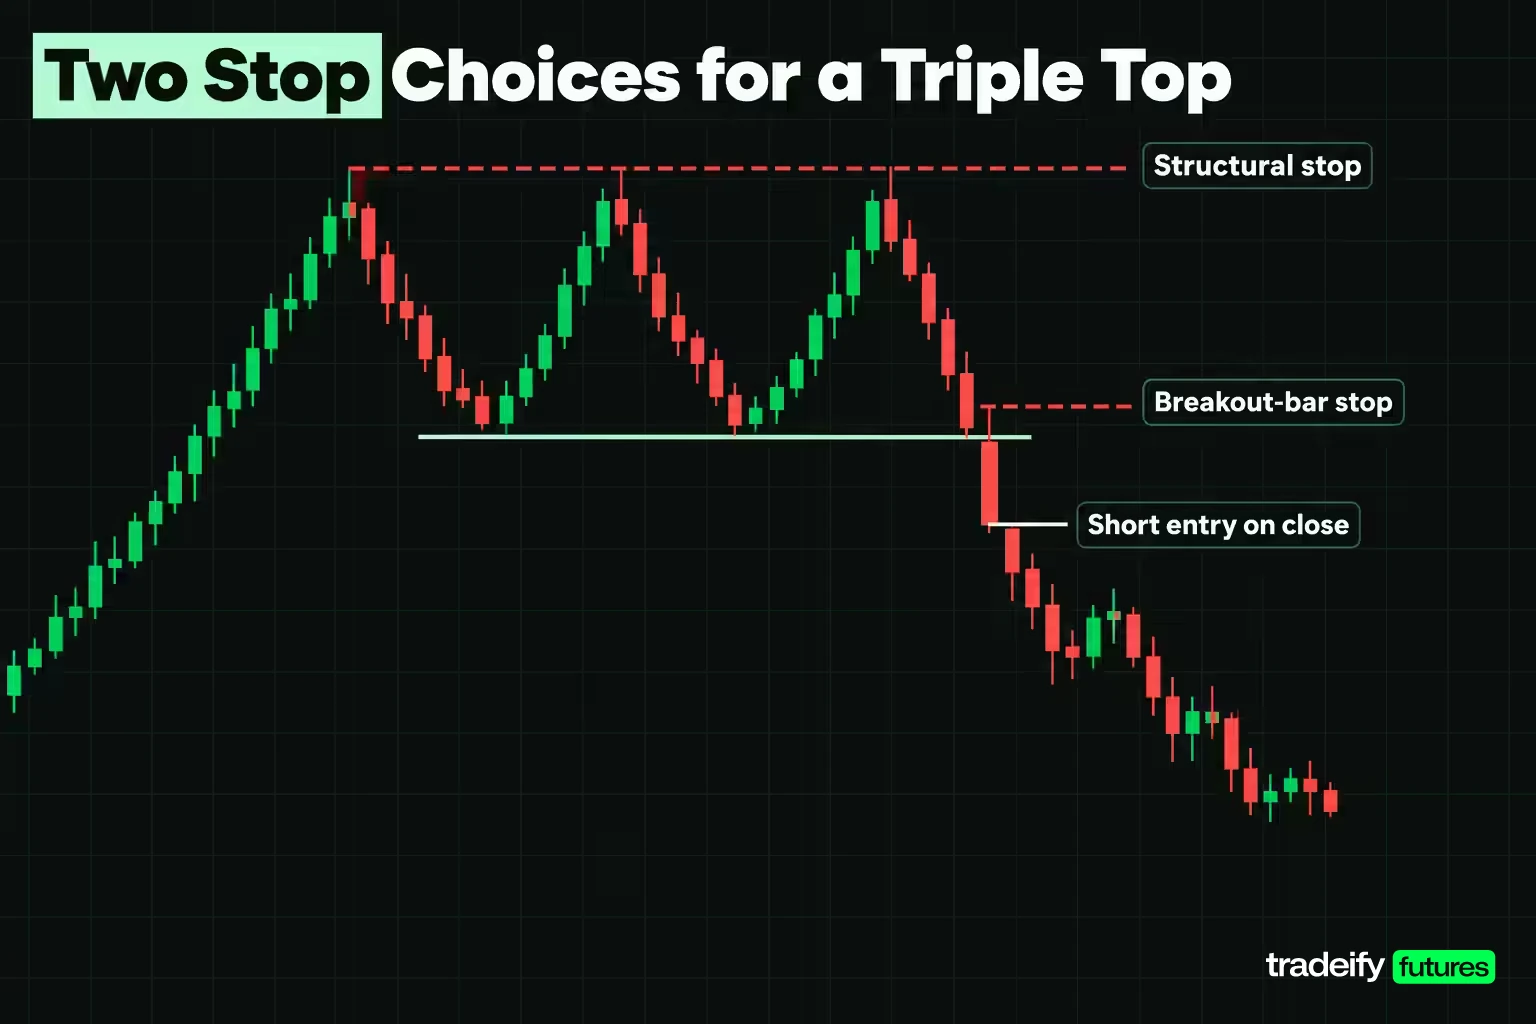
Stop loss placement for triple tops and bottoms has two defensible answers, and they produce very different trades.
The structural stop goes one tick beyond the pattern extreme: above the highest peak in a triple top or below the lowest valley in a triple bottom. Price cannot reach it on a normal retest of the confirmation line, and if it is hit, the pattern is clearly wrong. The problem is size. In a triple top, the distance from a confirmation entry to the highest peak is roughly the full pattern height, while the realistic target is often less than the height. That combination produces a reward-to-risk ratio below 1 to 1.
The breakout-bar stop goes one tick beyond the bar that produced the confirmation close: above that bar's high for a top, below its low for a bottom. It risks far less, often a third of the structural stop or less. The problem is the pullback. With Bulkowski's pullback and throwback rates around two thirds, a retest of the confirmation line is the normal case, and a retest that overshoots by a few points can take out a tight stop before the move resumes.
Choosing a stop for a triple top or bottom
A practical way to choose between the structural stop and the breakout-bar stop:
- Use the structural stop only when the target is large enough to keep the ratio above 1 to 1, which usually means a very wide pattern relative to recent bar ranges.
- Use the breakout-bar stop when the breakout bar is of normal size and the stop clears the confirmation line by a margin you can live with on a retest.
- Size the position from whichever stop you pick. If the stop is wide, trade fewer contracts or a micro contract, rather than tightening the stop to fit a position size you chose first.
- If the breakout bar is unusually large, neither stop works well. Waiting for the retest entry gives a smaller bar to reference.
On ES, one point is worth $50 and the minimum tick is 0.25 points, or $12.50. On the Micro E-mini (MES), one point is $5 and one tick is $1.25. The same stop distance in points costs one tenth as much on MES, which is why micros suit a first attempt at sizing this pattern.
Related lesson: Stop loss orders and placement
A Worked Triple Top and Triple Bottom Trade on ES
This worked triple top and triple bottom trade uses the E-mini S&P 500 (ES) and its micro contract (MES). The prices are illustrative round numbers chosen to make the geometry easy to follow. They are not market data, a forecast, or a recommendation. The calculations use ES at $50 per point and MES at $5 per point, with a 0.25-point tick.
Related lesson: Tick size and tick value
The ES triple top setup
- Peaks at 6900.00, 6895.00 and 6902.00, inside a 7.00-point band.
- Valleys between them at 6840.00 and 6846.00.
- Confirmation line: 6840.00, the lower valley.
- Pattern height: 6902.00 minus 6840.00, or 62.00 points (about 0.90% of price).
- A bar closes at 6838.00, under the confirmation line. Entry is short at 6838.00. The breakdown bar's high is 6858.00.
Two targets. The full measured move subtracts the 62.00-point height from the confirmation line, giving 6778.00. Bulkowski's version of the measure rule multiplies the height by the 49% of triple tops that meet their target: 62.00 times 49% is 30.38 points, so the target is 6809.62, rounded toward the entry to 6809.75.
| Triple top plan | Stop | Risk in points | Risk on one ES | Risk on one MES | Target | Reward to risk | Break-even win rate |
|---|---|---|---|---|---|---|---|
| Structural stop, full target | 6902.25 | 64.25 | $3,212.50 | $321.25 | 6778.00 | 0.93 to 1 | 51.7% |
| Structural stop, 49% target | 6902.25 | 64.25 | $3,212.50 | $321.25 | 6809.75 | 0.44 to 1 | 69.5% |
| Breakdown-bar stop, full target | 6858.25 | 20.25 | $1,012.50 | $101.25 | 6778.00 | 2.96 to 1 | 25.2% |
| Breakdown-bar stop, 49% target | 6858.25 | 20.25 | $1,012.50 | $101.25 | 6809.75 | 1.40 to 1 | 41.8% |
The break-even win rate is risk divided by risk plus reward. It is the share of trades that must reach the target, with every other trade losing the full stop, just to finish flat before costs.
The structural stop with the realistic 49% target needs a 69.5% hit rate to break even, on a pattern where only 49% of cases reach that target in Bulkowski's sample. That plan does not survive contact with the data. The breakdown-bar stop with the same target needs 41.8%, a much more forgiving number. The pattern, entry and target did not change. Only the stop did.
The ES triple bottom setup
- Valleys at 6700.00, 6704.00 and 6702.00, inside a 4.00-point band.
- Peaks between them at 6756.00 and 6762.00.
- Confirmation line: 6762.00, the higher peak.
- Pattern height: 6762.00 minus 6700.00, or 62.00 points (about 0.93% of price).
- A bar closes at 6764.00, over the confirmation line. Entry is long at 6764.00. The breakout bar's low is 6748.00.
The full measured move adds 62.00 points to the confirmation line, giving 6824.00. Bulkowski's rule multiplies the height by 74%, the share of triple bottoms meeting target: 45.88 points, so the target is 6807.88, rounded toward the entry to 6807.75.
| Triple bottom plan | Stop | Risk in points | Risk on one ES | Risk on one MES | Target | Reward to risk | Break-even win rate |
|---|---|---|---|---|---|---|---|
| Structural stop, full target | 6699.75 | 64.25 | $3,212.50 | $321.25 | 6824.00 | 0.93 to 1 | 51.7% |
| Structural stop, 74% target | 6699.75 | 64.25 | $3,212.50 | $321.25 | 6807.75 | 0.68 to 1 | 59.5% |
| Breakout-bar stop, full target | 6747.75 | 16.25 | $812.50 | $81.25 | 6824.00 | 3.69 to 1 | 21.3% |
| Breakout-bar stop, 74% target | 6747.75 | 16.25 | $812.50 | $81.25 | 6807.75 | 2.69 to 1 | 27.1% |
Same height, same contract, same distance to the structural stop. The difference is the realistic target. Because 74% of triple bottoms in Bulkowski's sample met their target against 49% of triple tops, the bullish version's realistic target sits 43.75 points from entry, while the bearish version's sits only 28.25 points away.
The ES retest version of both triple trades
If you wait for the pullback or throwback instead of entering on the close:
- Triple top: sell 6839.75 on the pullback to the line, stop 6858.25. Risk is 18.50 points, $925 on one ES or $92.50 on one MES. Reward to 6809.75 is 30.00 points, a 1.62 to 1 ratio with a 38.1% break-even win rate.
- Triple bottom: buy 6762.25 on the throwback to the line, stop 6747.75. Risk is 14.50 points, $725 on one ES or $72.50 on one MES. Reward to 6807.75 is 45.50 points, a 3.14 to 1 ratio with a 24.2% break-even win rate.
The retest improves both trades, but only when it happens. Plan for both cases before the break: where you enter if price comes back, and what you do if it does not.
False Breakouts Around the Triple Pattern Confirmation Line
False breakouts in a triple pattern happen in two places, and each needs its own response.
The first is at the third touch. Price pokes a few ticks beyond the resistance of a triple top, triggering buy stops and breakout buyers, then closes back under the level. For a trader waiting on the triple top, that poke is not a problem as long as the third peak stays roughly level with the others. It becomes a problem only if it turns into a close well above the prior peaks, which means the uptrend has resumed and the triple top idea is gone.
The second is at the confirmation line. Price closes through the line, the trader enters, and the next bars reclaim the line and close back inside the pattern. Bulkowski's trading lessons for triple bottoms describe a related trap: after an uptrend, price moves sideways in a series of peaks and valleys, a bullish pattern forms slightly under the prior valleys, price rises to the top of the tallest peak, and then tumbles. He calls that setup the basis of a bear trap.
How to handle false breaks at the confirmation line:
- Decide in advance what a failed break looks like. A close back inside the pattern on your trading timeframe is a clear rule.
- Do not widen the stop when the break fails. The structural stop exists for a pattern that is wrong, and a reclaimed confirmation line is early evidence that it may be.
- Watch for warnings before the break. Bulkowski's lessons flag gaps on bad news and tall bars that close near where they opened as signs to skip a triple bottom.
- Do not flip direction automatically. A failed triple top can become a strong move up, but trading the failure is a separate setup with its own entry and stop.
Related lesson: Breakout trading
When a Triple Top or Bottom Is Invalidated
A triple top or bottom is invalidated by any of these, whichever comes first:
- Before confirmation, price closes clearly beyond the pattern extreme: above the highest peak in a triple top, or below the lowest valley in a triple bottom. The trend has resumed. Bulkowski's guidance that the decline into a triple bottom should not drop below the first bottom is the same idea.
- Before confirmation, the middle swing turns out to be the extreme, so the pattern is a head and shoulders rather than a triple.
- After confirmation, price closes back through the confirmation line and keeps going, so the break has failed.
- After confirmation, the structural stop is hit.
Write the invalidation level down before entry. If you cannot say what would prove the triple top or bottom wrong, you do not have a trade yet, just an opinion with a position attached.
Common Triple Top and Triple Bottom Mistakes
Most triple top and triple bottom losses trace back to a short list of decisions made before the trade, not to the market doing something strange.
Related lesson: Risk reward ratio
| Mistake | What it looks like | What it costs | Fix |
|---|---|---|---|
| Trading the third touch | Selling the third peak or buying the third valley before any close through the confirmation line | A full stop-out on a pattern that never formed | Make the close through the confirmation line the trigger |
| Ignoring the trend | Calling three equal highs in a sideways market a triple top | A reversal trade in a market with nothing to reverse | Name the trend into the first touch, or skip the setup |
| Wrong pattern name | The middle peak sits above the others, or the middle valley sits under them | Using triple-pattern rules on a head and shoulders | Check the middle swing before anything else |
| Wrong confirmation line | Treating the nearer valley or peak as the line | Entering on a break that has not happened | The line is the lowest valley (top) or highest peak (bottom) |
| Full measured-move target | Assuming every pattern travels its full height | A plan whose break-even win rate exceeds the hit rate | Use the published percentage of height, or a nearer level |
| Stop wider than the target | A structural stop with a short realistic target | 0.44 to 1 on the worked triple top example | Use the breakout-bar stop or a retest entry, and size from the stop |
| Panic on the pullback | Exiting at break-even when price returns to the line | Losing the move that follows the normal retest | Decide before entry whether you hold through a retest |
| Treating both patterns as equal | Same targets and stops on tops and bottoms | Overestimating the triple top | Use each pattern's own target-hit rate |
Limitations and Risks of Triple Top and Bottom Patterns
The limitations of triple top and bottom patterns are practical, and they matter more than the pattern's reputation.
They are rare. Bulkowski calls triple bottoms somewhat rare, noting that three bottoms seldom line up like soldiers at attention. A trader who wants a triple top every day will start labeling ranges and double tops as triples.
They are subjective. There is no fixed rule for how close the touches must be, how much time must pass between them, or how strong the trend leading in must be. Two traders can look at the same chart and disagree on whether a triple exists.
The statistics come from a specific sample. Bulkowski's numbers are bull market results on stock charts. Futures trade nearly around the clock, intraday charts carry more noise, and a triple top on a 5-minute ES chart may behave nothing like one on a daily stock chart. Use the published figures as a relative benchmark between patterns, not as an expected hit rate on your own chart.
The target is a projection, not a forecast. Even in the best case, 74% of triple bottoms met Bulkowski's reduced target, so roughly a quarter did not.
Late confirmation is built in. By the time a triple top confirms, price has already fallen from the third peak to the confirmation line. That move is gone, and on a short pattern the remaining room can be small once costs are counted.
No pattern removes the risk of loss. Futures are leveraged, stops can slip in fast markets, and a well-formed triple top can still fail.
Timeframes for Trading Triple Tops and Bottoms
Triple tops and bottoms appear on every timeframe, but the timeframe changes how much the pattern can be trusted and how it should be traded.
Higher timeframes, such as daily and weekly charts, take weeks or months to form a triple pattern. Each touch represents a lot of trading, and the published statistics were built on longer swings of this kind (Bulkowski measures pullbacks within 30 days of the breakout). The trade-off is that patterns are rare and stops are wide in points.
Intraday timeframes, such as 5-minute or 15-minute charts, produce many more candidate triples. Each one carries less information, the confirmation line gets crossed by noise more often, and commissions and slippage take a larger share of a smaller measured move.
Multiple-timeframe checks for intraday triple patterns
A multiple-timeframe check helps on intraday triple tops and bottoms:
- Use a higher timeframe (for example 60-minute) to identify the trend and the major levels.
- Look for the triple top or bottom on the trading timeframe (for example 5-minute) where it forms against that higher-timeframe trend's exhaustion, at a level that matters on the higher chart.
- Skip intraday triples that form in the middle of a higher-timeframe range, since there is little to reverse.
Practicing on historical charts before trading the pattern live is worth the time. Bar-by-bar replay lets you mark the touches, the line and the stop before the outcome appears, which is a fairer test than looking at finished charts.
On our accounts, ES and MES are both on the supported product list, and positions must be closed by 4:45 PM ET, so a daily-chart triple top cannot be held overnight; any triple pattern you trade has to play out inside one session. Size is capped by contract limits, for example 4 minis or 40 micros on a 50K account, with 10 micros counting as one mini. WealthCharts, one of our supported platforms, has a Chart Replay mode for practice on historical data. Our funded accounts are simulated.
Related lesson: Multiple timeframe analysis
Triple Top and Triple Bottom FAQ
Is a triple top bullish or bearish?
A triple top is bearish. It forms after an uptrend and confirms when price closes below the lowest valley between the three peaks. The triple bottom is its bullish mirror and confirms on a close above the highest peak between the three valleys.
How accurate is the triple top pattern?
In Bulkowski's sample of 1,964 trades, the triple top had a 25% break even failure rate, a 14% average decline and 49% of patterns meeting the price target. It ranked 24 out of 36 bearish patterns. Those are stock-chart results in bull markets, so treat them as a benchmark, not an expectation.
What is the success rate of a triple bottom?
In Bulkowski's sample of more than 2,500 trades, the triple bottom had a 13% break even failure rate, a 46% average rise and 74% meeting the price target. It ranked 12 out of 39 bullish patterns, well ahead of the triple top.
What is the difference between a triple top and a double top?
A double top has two failed tests of a high and confirms on a close below the single valley between them. A triple top has three tests and confirms below the lower of two valleys. In Bulkowski's data the triple top does not outperform the Adam and Adam double top.
How do I tell a triple top from a head and shoulders top?
Look at the middle peak. If the middle peak is clearly the highest, the pattern is a head and shoulders top. In a triple top all three peaks sit near the same price.
Does volume matter for these patterns?
Volume trends downward across the pattern about 62% of the time for triple tops and 61% for triple bottoms. A falling trend supports the reversal read, but Bulkowski found the effect on triple top performance was minor, about one percentage point.
Where do I put the stop on a triple top or triple bottom?
The two common choices are one tick beyond the pattern extreme, or one tick beyond the breakout bar. The first is safer from retests but often too wide for the realistic target. The second risks far less but can be hit by a normal pullback.
Can triple tops and bottoms be traded on intraday futures charts?
Yes, the structure is the same on any timeframe. Intraday triples are more common, noisier and smaller, so costs take a bigger share of the move. A higher-timeframe trend check filters out many weak ones.
Triple Top and Bottom Pattern Risk Disclaimer
This guide is education, not investment advice or a recommendation to trade any instrument. Futures are leveraged, losses can be larger than expected on a single trade, and a stop order does not guarantee your exit price in a fast market. Every price, stop and target here is an illustrative example, not a record of a real trade or a promise of any result. Published pattern statistics come from specific markets and periods and may not carry over to yours. Simulated and funded account results are simulated and do not reflect live trading conditions.
Related lesson: Technical analysis complete beginner guide


