



TL;DR: Footprint charts split each bar into price rows and show how much traded at the bid and at the ask on every row. Read them for location and absorption, not as buy or sell signals. In 120 BTC-USD minute bars, flagged buy imbalance rows broke 73.5% of the time, plain bar lows 68.4%. Check how your feed labels bid and ask before you trust any delta number.
Price taps your level, the footprint lights up with buy imbalances, and every instinct says get long. That is the moment footprint charts are most useful and most dangerous.
A candlestick tells you where a bar opened, how far it travelled and where it closed. Footprint charts answer the question the candle skips: who was doing the trading at each price inside that bar, and how hard were they pushing? That detail is useful, and it is easy to over-read. This guide rebuilds one real one-minute bar from its 1,100 individual trades, reads every row, then tests the popular footprint signals on 120 consecutive bars so you can see what the markings actually did.
What Footprint Charts Are and What They Record
A footprint chart is a bar chart where each bar is cut into horizontal price rows. On every row the chart prints the volume that traded there, usually split into two numbers: volume that traded at the bid and volume that traded at the ask.
The raw material is the trade tape. Every trade (a "print") carries a price, a size and a side. A footprint chart sorts those prints into rows by price, adds them up, and draws the result inside the bar. Nothing is forecast. Every number on a footprint is a count of something that already happened.
Most footprint charts add a few summary values to each bar:
- Total volume for the bar.
- Delta, which is ask volume minus bid volume.
- The point of control (POC), the row with the most volume.
- Imbalance markings where one side heavily outweighed the other.
Here is the limit that matters most. A footprint chart shows executed trades, not resting orders. It cannot tell you whether the buyer who absorbed selling at a price is still there, or whether a large order is sitting one tick away waiting. That is the job of the order book, and it is why footprint charts are usually read next to a depth-of-market ladder rather than instead of one.
Related lesson: Time and sales
Bid and Ask Volume on a Footprint Chart
Bid and ask volume on a footprint chart describes which side was aggressive, not who "won." Every trade has two parties. One had an order resting in the book (the passive side, also called the maker). The other sent an order that crossed the spread and took that liquidity (the aggressive side, the taker).
- A trade at the bid means a resting buyer was filled by an aggressive seller. It lands in the bid column.
- A trade at the ask means a resting seller was filled by an aggressive buyer. It lands in the ask column.
So a big number in the ask column says buyers were impatient at that price. It does not say price will rise. Plenty of aggressive buying ends up feeding a large passive seller, and that is exactly the pattern called absorption.
The Side Label Trap in Raw Trade Data
The side field in a trade feed does not always mean what it looks like. Coinbase Exchange documents that the "side" on each public trade is the maker order side. A trade labelled "buy" means the resting order was a buy, so an aggressive seller hit the bid. Read that field the obvious way and every footprint you build is upside down, with buying and selling swapped on every row.
A study of BTC-USD prints from November 4, 2026 assigned sides the way the exchange documents them, and the reconstruction checked out: all 131 rebuilt one-minute bars matched the exchange's own candle exactly on open, high, low, close and volume. Before you build anything on bid and ask volume from a new feed, rebuild a few bars and check the side convention against the vendor's documentation.
Inferred Footprints Put Volume on the Wrong Side
Not every footprint chart reads the aggressor flag at all. TradingView's documentation says its volume footprint categorizes volume as buy or sell from the direction of lower-timeframe bars (close above open counts as buy volume), working down from 1 tick on professional plans to 1 second, 1 minute and 60 minutes as history runs out.
That approximation has a measurable cost. In a measurement made for this guide on 143,221 Coinbase Exchange BTC-USD prints from November 4, 2026, two common inference methods were checked against the exchange's real aggressor side:
- The tick rule (uptick counts as a buyer, downtick as a seller, unchanged price keeps the previous label) matched the real side on 76.7% of prints.
- A one-second candle-direction method, similar in spirit to how footprint charts on some platforms estimate sides, put 69.6% of volume on the correct side in that same Coinbase measurement.
Roughly three in ten units of volume landing in the wrong column is a lot when the whole point of the chart is to compare the two columns. If your platform infers sides, treat its delta and imbalance readings as rough.
How to Read Footprint Charts Row by Row
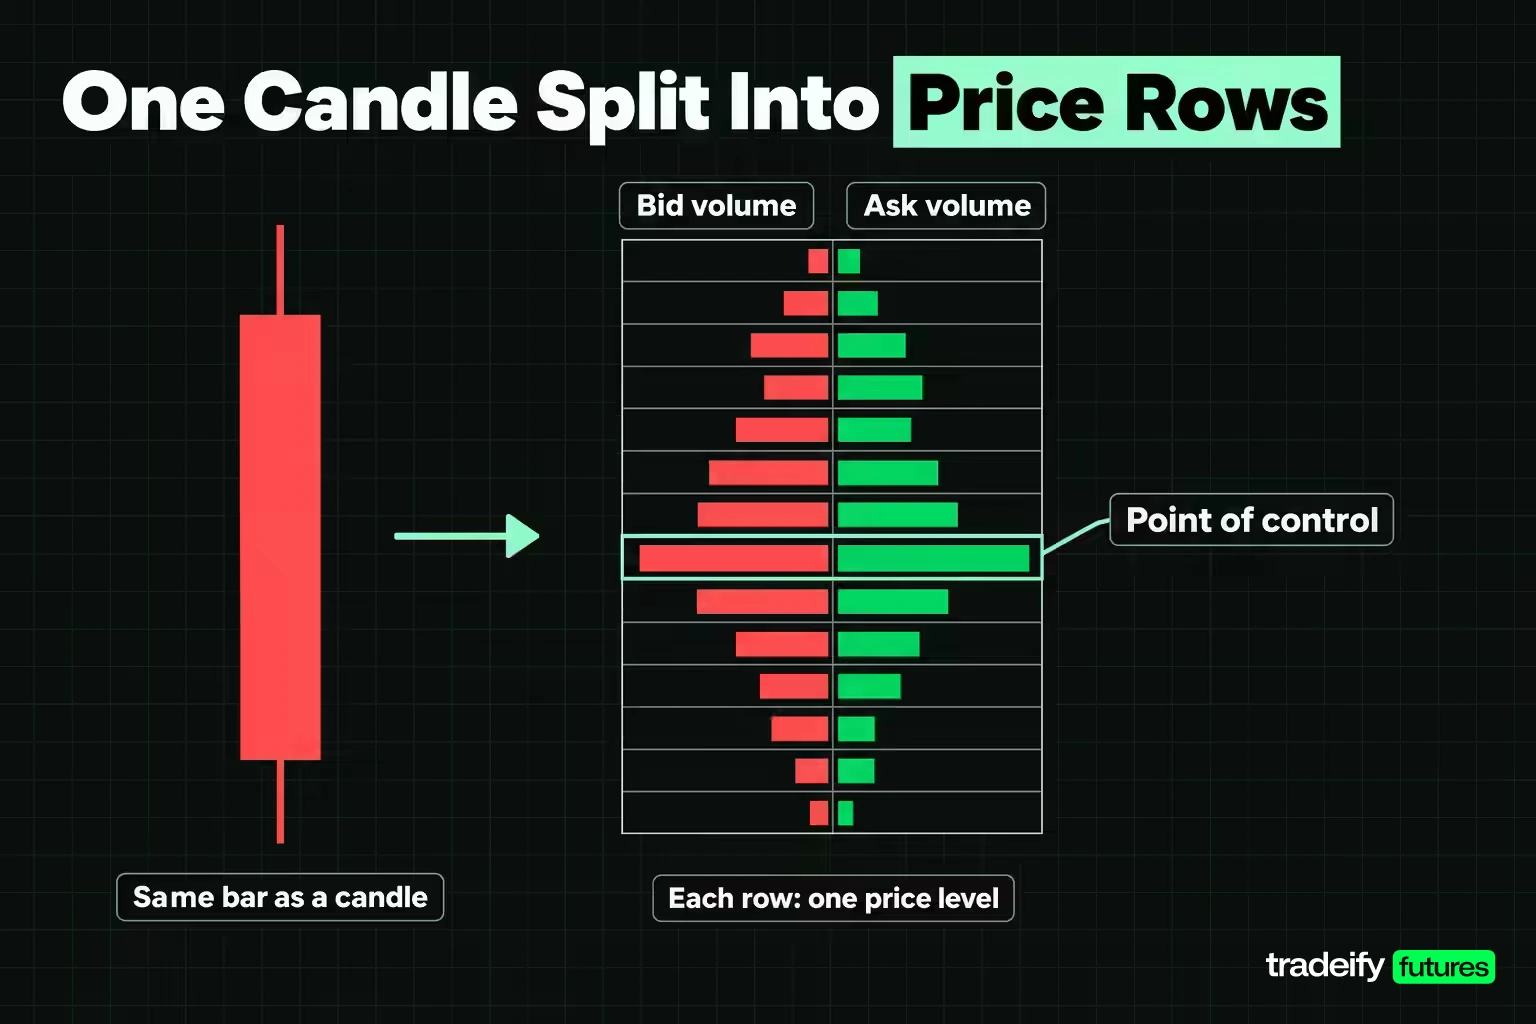
The clearest way to learn footprint charts is to read one bar slowly, row by row. The bar used here is BTC-USD on Coinbase Exchange, 10:51 AM ET on Wednesday, November 4, 2026. It contains 1,100 prints. Crypto is used because its full trade tape is public, so every number can be rebuilt; the reading method is identical on ES or NQ futures, where a row is typically one or a few ticks.
First, the reconciliation. The bar rebuilt from 1,100 prints matched the exchange's one-minute candle exactly.
| Bar value | Rebuilt from prints | Exchange candle |
|---|---|---|
| Open | 80403.58 | 80403.58 |
| High | 80429.24 | 80429.24 |
| Low | 80331.23 | 80331.23 |
| Close | 80350.66 | 80350.66 |
| Volume (BTC) | 39.012 | 39.012 |
The candle alone says this: a $98.01 range and a close $52.92 below the open. A red bar that finished near its low.
The Same Bar Split Into $10 Rows
Here is the footprint of that bar at $10 rows. Each row runs from the price shown up to the next row. Volume is in BTC.
| Price row | Bid volume | Ask volume | Row delta | Prints | Flag at 300% |
|---|---|---|---|---|---|
| 80420 | 0.004 | 1.190 | +1.186 | 28 | buy 7.4x |
| 80410 | 0.161 | 2.600 | +2.439 | 73 | buy 4.3x |
| 80400 | 0.599 | 4.462 | +3.863 | 113 | buy 14.6x |
| 80390 | 0.305 | 2.765 | +2.460 | 77 | none |
| 80380 | 1.392 | 4.971 | +3.579 | 133 | buy 4.6x, POC |
| 80370 | 1.077 | 4.969 | +3.892 | 128 | buy 3.5x |
| 80360 | 1.413 | 3.409 | +1.997 | 205 | none |
| 80350 | 2.964 | 2.579 | -0.384 | 163 | buy 3.0x |
| 80340 | 0.855 | 2.512 | +1.657 | 136 | buy 13.3x |
| 80330 | 0.188 | 0.595 | +0.407 | 44 | none |
What the Rows of This Footprint Say
Read a footprint chart in this order, and the 10:51 AM ET bar tells a clear story.
- Start with the totals. Ask volume was 30.053 BTC against 8.959 at the bid, so 77% of the volume came from buyers lifting the offer. Bar delta was +21.094.
- Find the POC. The heaviest row was 80380, with 6.363 BTC across 133 prints, in the middle of the bar.
- Check where the extremes formed. The low printed on trade 188 and the high on trade 612, so the bar dropped first, rallied to the high, then sold back to close near the low.
- Look at the rows near the close. The 80350 and 80360 rows hold the most prints (163 and 205) and the most bid volume, right where the bar finished.
- Only then read the flags. Seven buy imbalances and zero sell imbalances.
A trader scanning only the flags sees seven green markers and heavy positive delta, and that looks a lot like permission to buy. A trader reading the whole bar sees buyers spend most of the minute lifting the offer and still lose $52.92 of price. Both views use the same numbers. The second one asks why the buying did not move price, and that question is where the useful reading starts. For the record, the next bar closed at 80313.44, and over the following 10 minutes price fell to 80053.95, $277.28 below this bar's low. One bar proves nothing, but it shows why a footprint full of buy flags is not a buy signal.
Reading Footprint Delta Against the Candle
Delta on a footprint chart is ask volume minus bid volume. Row delta does it for one price row; bar delta does it for the whole bar. Positive delta means aggressive buyers traded more than aggressive sellers. It measures effort, not result.
The 10:51 AM ET BTC-USD bar from November 4, 2026 is a clean example of effort and result pulling apart. Its delta was +21.094 BTC, about 77% of the bar's volume on the ask side, and the candle still closed $52.92 lower. When strong positive delta shows up on a red candle, the usual reading is that a passive seller absorbed the buying. When strong negative delta shows up on a green candle, the mirror applies.
This is not a rare event you can wait for and then exploit. In a measurement made for this guide on 120 one-minute Coinbase Exchange BTC-USD bars (9:30 AM to 11:29 AM ET on November 4, 2026), delta and candle color disagreed in 51 of 120 bars: an up close with negative delta, or a down close with positive delta.
Delta also did not call the next bar. The same Coinbase BTC-USD measurement gives these next-bar figures, which describe one morning, not a forecast:
| Condition in the current bar | Bars | Next bar closed higher |
|---|---|---|
| All bars (baseline) | 120 | 48.3% |
| Positive bar delta | 71 | 42.3% |
| Negative bar delta | 49 | 57.1% |
| More buy than sell imbalance rows | 73 | 50.7% |
| More sell than buy imbalance rows | 35 | 45.7% |
On this sample, positive delta was followed by an up bar less often than the baseline. That fits the absorption idea more than the "delta shows who is in control" idea, but 120 bars from one rising morning is far too small to build a rule on. The takeaway is narrower: delta is one input, and reading it without the candle and the location is how traders get trapped.
Related lesson: Cumulative delta
Footprint Imbalances and Absorption
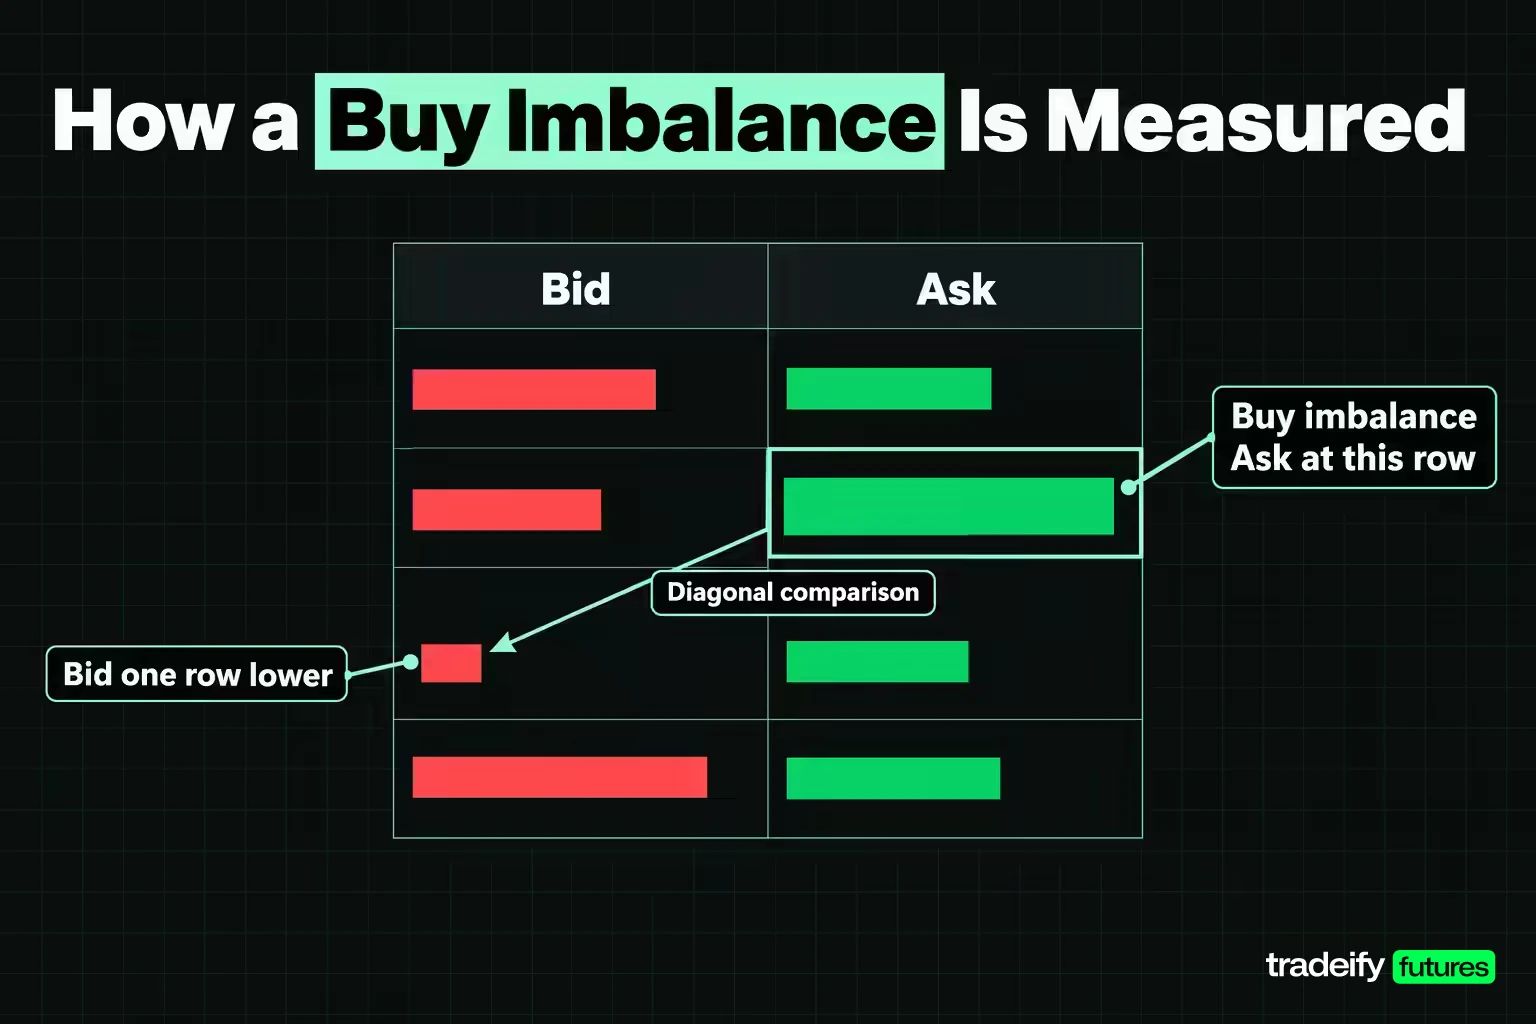
A footprint imbalance compares volume diagonally, not on the same row. The reason is mechanical: a buyer lifting the offer at one price is trading against sellers whose bids sat one row lower. TradingView documents the standard rule and a 300% default:
- Buy imbalance: ask volume at a row is at least three times the bid volume one row lower.
- Sell imbalance: bid volume at a row is at least three times the ask volume one row higher.
In the 10:51 AM ET BTC-USD bar from November 4, 2026, the 80350 row shows why the diagonal matters. Its own row delta was negative (2.964 bid against 2.579 ask), yet it carries a buy imbalance flag, because its 2.579 of ask volume is 3.0x the 0.855 of bid volume in the 80340 row.
Thin Rows Make Big Ratios
An imbalance on footprint charts is a ratio, and a ratio with a tiny denominator looks dramatic without meaning much. In the 10:51 AM ET BTC-USD bar from November 4, 2026, the top row, 80420, shows a 7.4x buy imbalance built on 1.190 BTC of ask volume across 28 prints. A flag built on a handful of prints and a flag built on hundreds look identical on screen.
In a measurement made for this guide on 120 Coinbase Exchange BTC-USD one-minute bars at $10 rows, 101 of 1,032 flags had a zero denominator (no volume at all on the comparison row), and 404 of 1,032 (39%) rested on a comparison row with under 0.05 BTC. A volume filter that hides flags on thin rows is one of the most useful settings a footprint chart has.
Absorption on a Footprint Chart
Absorption is heavy aggressive volume at a price that fails to move price. On a footprint it shows up as large numbers in one column, often with imbalance flags, while the bar stalls or reverses. The 10:51 AM ET bar is a textbook case: 30.053 BTC of aggressive buying, seven buy flags, and a close near the low.
The catch is that absorption is easy to spot in hindsight and hard to call while it is happening. While the bar is still forming, the same rows are equally consistent with buyers who are about to break the seller. Absorption becomes useful only when it lines up with a level you already cared about, and when the next bars confirm that price is failing to continue.
Do Flagged Footprint Rows Act as Support and Resistance
A common claim is that imbalance rows on footprint charts become support or resistance. A measurement made for this guide tested it on 120 Coinbase Exchange BTC-USD one-minute bars (9:30 AM to 11:29 AM ET, November 4, 2026). For each bar, it took the lowest buy imbalance row and asked whether price traded below it within the next 10 bars, then asked the same question of the same bar's plain low. The sell side used the highest sell imbalance row against the bar's plain high.
| Level tested (120 BTC-USD one-minute bars, $10 rows) | Bars with the level | Traded through within 10 bars |
|---|---|---|
| Lowest buy imbalance row | 117 | 73.5% |
| Same bars' plain low | 117 | 68.4% |
| Bottom of a stacked buy imbalance | 41 | 75.6% |
| Same bars' plain low (stacked cases) | 41 | 65.9% |
| Highest sell imbalance row | 105 | 89.5% |
| Same bars' plain high | 105 | 84.8% |
In that Coinbase BTC-USD measurement, every flagged level broke a little more often than the plain extreme of the same bar. That is not how imbalance flags are usually described. Part of that is location: the lowest buy imbalance row sat a median $6.64 above the bar low, so it was closer to price and easier to reach. That is the honest conclusion. In this sample the flag added no holding power beyond where it happened to sit. The sell-side rates are also high because BTC-USD climbed about $2,300 during the window, which broke almost every high.
Footprint Chart Types and Display Modes
Footprint charts come in several display types, and the same prints can look very different depending on the mode. Platforms use different names, but most offer some version of these:
- Bid by ask (bid x ask). Two numbers per row, bid volume on the left and ask volume on the right. This is the classic footprint and the one used for imbalance reading.
- Delta footprint. One number per row, ask minus bid. Faster to scan for where aggression concentrated, but it hides how much total volume sat behind each number.
- Volume (total) footprint. One number per row, total volume. Useful for finding the POC and high-volume rows without the bid and ask split.
- Profile footprint. Each row drawn as a horizontal bar whose length is proportional to its volume, like a tiny volume profile inside every candle.
- Ladder or highlight modes. Color marks the heaviest rows so you can spot concentration at a glance.
TradingView's volume footprint, for example, offers Buy and Sell, Delta, Total and Ladder types, and a Cluster or Profile display. Pick the mode for the question you are asking. Bid by ask answers "who was aggressive here," total volume answers "where did trading concentrate," and delta answers "where did one side push hardest."
Footprint Charts vs Candlesticks
Footprint charts and candlesticks are built from the same trades. The candle keeps four prices and a volume total; the footprint keeps the whole distribution. The 10:51 AM ET BTC-USD bar from November 4, 2026 shows the difference: as a candle it was a red bar with a $98.01 range, while as a footprint it showed 77% of its volume lifting the offer.
| Question | Candlestick | Footprint chart |
|---|---|---|
| Where did the bar open, peak, bottom and close | Yes | Yes |
| How much traded at each price inside the bar | No | Yes |
| Which side was aggressive at each price | No | Yes |
| Where the heaviest trading happened (POC) | No | Yes |
| Easy to read across many bars at once | Yes | Harder |
| Data needed | OHLC and volume | Tick-level trades with side |
Candlesticks are enough for trend, structure and most swing-level decisions. Footprint charts earn their screen space when the decision depends on what happened at one price: whether a breakout had real participation, whether a level was defended, or where trading concentrated inside a reversal bar. If your trading plan has no rule that uses that detail, the extra columns are mostly noise.
Footprint Charts vs Volume Profile and the Point of Control
Footprint charts and volume profile use the same idea, volume at price, over different time windows. A footprint aggregates volume by price inside one bar. A volume profile aggregates it across a session, a week or a range you choose, and draws it as a histogram on the side of the chart.
Both share a vocabulary:
- Point of control (POC). The price level with the most traded volume in the window.
- Value area. The range of prices that holds a set share of the window's volume, typically 70%, built outward from the POC.
- Value area high and low. The top and bottom of that range.
TradingView's footprint, for example, draws a value area and POC for each bar using an algorithm similar to its volume profile tools. In the 10:51 AM ET BTC-USD bar from November 4, 2026, the POC at $10 rows was the 80380 row, with 6.363 BTC.
The two tools answer different questions. A session volume profile tells you where the market spent its time and accepted price over hours. A footprint tells you what happened inside one specific bar as price reached a level. A common workflow uses the profile to mark the levels in advance (session POC, value area edges, low-volume gaps) and the footprint to judge how price behaves when it actually gets there.
Related lesson: Volume profile
Footprint Charts vs the DOM
Footprint charts and the depth-of-market (DOM) ladder show the two halves of the order book story. The footprint shows trades that already happened, sorted by price. The DOM shows limit orders resting right now at each price, waiting to be filled, and it changes every time someone adds, cancels or modifies an order.
- Footprint chart. History of executed volume. It cannot be cancelled or faked after the fact, but it is always late.
- DOM. Live resting liquidity. It is current, but orders can be pulled before price reaches them, so a large bid on the ladder is a statement of intent, not a commitment.
The two are strongest together. Imagine a trader watching a level where the DOM shows a large resting bid. If the footprint then shows heavy selling at that price and price holding, the bid absorbed the selling. If the bid vanishes from the DOM just before price arrives and the footprint shows almost nothing traded there, the "wall" was never tested. Neither tool alone can tell those two cases apart.
DOM depth beyond the best bid and ask usually needs a Level 2 data feed, which many brokers and platforms sell separately. A footprint needs only the trade feed (price, size and side), not the full book.
Related lesson: Market depth and level II data
Footprint Chart Settings and Row Size
Row size is the setting that changes footprint charts most, and most traders never think about it. It decides how many rows a bar has, which row becomes the POC, and how many imbalance flags appear.
Here is the 10:51 AM ET BTC-USD bar from November 4, 2026 at four row sizes:
| Row size | Rows in the bar | Buy flags | Sell flags | POC row |
|---|---|---|---|---|
| $5 | 20 | 14 | 0 | 80355 |
| $10 | 10 | 7 | 0 | 80380 |
| $25 | 5 | 2 | 0 | 80350 |
| $50 | 3 | 1 | 0 | 80350 |
Same 1,100 prints, and the POC moved from 80355 to 80380 to 80350 just by changing the grouping. The flag count fell from 14 to 1.
Across the full 120-bar study, the pattern held:
| Row size across 120 bars | Flagged rows | Bars flagged on both sides | Bars with no flag | Median rows per bar |
|---|---|---|---|---|
| $5 | 2,224 | 118 | 0 | 27.5 |
| $10 | 1,032 | 102 | 0 | 14 |
| $25 | 392 | 68 | 5 | 6 |
| $50 | 200 | 39 | 14 | 4 |
At $5 rows, 118 of 120 bars carried both buy and sell flags at once. A marker that appears on almost every bar cannot separate anything. The median one-minute range in the window was about $129, so $10 rows gave around 14 rows per bar, readable without being a wall of numbers.
Choosing Footprint Row Size for Futures
A practical rule: size rows so a typical bar has roughly 8 to 20 rows, and fix that setting before the session. On ES, the finest possible row is one tick, 0.25 index points, worth $12.50 per contract ($1.25 on MES). If ES bars on your timeframe usually span 8 to 12 points, one-tick rows produce 32 to 48 rows, which is hard to read, while grouping 2 to 4 ticks per row brings that to between 8 and 24 rows. Never change row size in the middle of a trade to make the chart agree with you.
TradingView Footprint Settings
TradingView offers footprint charts as a Supercharts chart type, with plan availability set by TradingView. The settings that matter most:
- Row size. Auto sizes rows from the instrument's ATR; Manual uses a fixed number of ticks per row. TradingView itself recommends manual ticks per row when you want alerts and chart visuals to match.
- Imbalance. The threshold, 300% by default.
- Value area and POC. Per-bar value area percentage and POC display.
- Type and Display. Buy and Sell, Delta, Total or Ladder, drawn as Cluster or Profile.
TradingView also notes that its footprint repaints by design. A bar may be calculated from 1-tick data in real time and recalculated later from 1-second data, so imbalances you saw live may look different when you review the chart afterwards. Keep that in mind before you backtest from a historical footprint screenshot.
Related lesson: Tick charts
Footprint Trading Strategies Tested on 120 Bars
Footprint trading strategies mostly come down to four patterns. Each pattern here comes with what it assumes and what a measurement made for this guide found on 120 Coinbase Exchange BTC-USD one-minute bars (9:30 AM to 11:29 AM ET, November 4, 2026, $10 rows, 10-bar forward window).
Stacked Imbalances
A stacked imbalance is three or more imbalances on consecutive rows, read as one side pushing through several prices in a row. The usual idea is that the bottom of a stacked buy imbalance becomes support. In the Coinbase BTC-USD measurement made for this guide, the bottom of a stacked buy imbalance was traded through within 10 bars in 75.6% of 41 cases, against 65.9% for the same bars' plain lows. Stacked sell imbalances broke 95.2% of the time (20 of 21), in a morning when price rose. The stack described aggression, but it did not mark a stronger floor than the low itself.
Unfinished and Finished Auctions
At a bar's high, a finished auction is usually read as no buyers left at the top (little or no ask volume on the top row), and an unfinished auction as trades on both sides at the extreme, suggesting price may come back to finish the job. In the Coinbase BTC-USD measurement made for this guide, unfinished highs (both bid and ask volume on the top row) were exceeded within 10 bars 86.1% of the time, finished highs 85.4%. At the lows, unfinished lows broke 65.8% of the time and finished lows 75.6%, the opposite of what the idea predicts. On this sample, the auction label did not change the outcome in a useful way.
Absorption Reversals
The absorption trade waits for heavy aggressive volume at a known level, a failure to continue, and then trades the reversal with a stop beyond the absorption area. The 10:51 AM ET bar shows the shape: heavy buying, no progress, a close near the low. The pattern only becomes a trade when it happens at a level you marked before the session and the next bar confirms. Without that, it is a description of the past.
Delta Divergence
Delta divergence is price making a new high while delta weakens, or a new low while delta improves. TradingView's documentation frames it as a sign that pressure may be fading, and tells readers to validate it with other tools. In a measurement made for this guide on 120 Coinbase Exchange BTC-USD one-minute bars from November 4, 2026, bar delta and candle color disagreed in 51 of them, so single-bar disagreement is common. Divergence across several bars at a meaningful level carries more weight than one bar's mismatch.
None of these results mean the patterns never work. They mean that on one morning of real data, the labels on their own added little. Test any footprint rule on your own instrument and timeframe, with a matched comparison like the plain bar high or low, before trusting it.
How Traders Use Footprint Charts for Entries, Stops and Breakouts
The most practical use of footprint charts is answering a specific question at a specific price. Used that way, they help with a short list of jobs.
- Breakout checks. When price breaks a range high, a footprint shows whether the break came with heavy ask volume through the level or on a few small prints. A thin break is easier to reverse.
- Entry location. At a level marked in advance, absorption or a sudden drop in aggressive volume can mark where a pullback stalled, giving a tighter, more specific entry than the candle alone.
- Stop placement. The POC or a heavily traded row near your entry gives a concrete place to put a stop beyond, rather than a round number.
- Exits. Heavy aggressive volume that stops moving price near your target is a reason to take profit rather than hope for more.
- Review. Replaying footprints of your own trades shows whether you entered into absorption or alongside real participation.
Combining Footprint Charts With Other Indicators
Footprint charts work best with a few context tools that tell you where to look, because footprint charts on their own have no idea which prices matter:
- Market structure. Prior highs, lows and range edges decide which footprints are worth reading at all.
- Volume profile and VWAP. Session POC, value area edges and VWAP give levels where footprint behavior matters.
- ATR. ATR tells you a typical bar range, which helps set row size (TradingView's Auto row size is built from ATR) and keeps stops wider than normal noise.
- Cumulative delta. Running delta across the session shows whether the aggression in one bar fits a longer trend.
Adding more indicators does not create a setup. If price is chopping in the middle of a range, a footprint just gives you more numbers to talk yourself into a trade with. The footprint answers "what happened at this price," and the other tools answer "why does this price matter." You need both answers before a footprint reading becomes a trade.
Related lesson: Order flow analysis
Advantages of Footprint Charts
The main advantage of footprint charts is that they show the inside of a bar. The 10:51 AM ET BTC-USD bar from November 4, 2026 makes the case: the candle showed a plain red bar, and the footprint showed 77% of its volume lifting the offer while price fell. That is information a candle cannot carry.
- Volume at every price. You see where trading concentrated, not just the bar total.
- Aggressor side. You see which side crossed the spread at each row, when the feed supports it.
- Absorption and exhaustion become visible, as effort without result.
- Precise levels. Heavily traded rows and the POC give concrete prices for entries and stops.
- Better trade review. Replaying a footprint shows what happened at your entry, not just where price went afterwards.
Footprint Chart Limitations and Common Mistakes
Footprint charts have real limits, and most of the damage traders take from footprint charts comes from ignoring them.
- Inferred sides. Some platforms estimate bid and ask volume from price direction. In a Coinbase Exchange BTC-USD measurement made for this guide, a one-second method put only 69.6% of volume on the correct side.
- Repainting. Historical footprints may be rebuilt from coarser data than you saw live, so imbalances can change after the fact.
- Row-size dependence. The same 1,100 prints produced 14 buy flags at $5 rows and 1 at $50 rows. A flag count without a row size means very little.
- Thin ratios. Large imbalance ratios often sit on tiny denominators; in the same Coinbase BTC-USD measurement, 39% of flags rested on a comparison row with under 0.05 BTC.
- Reading flags as signals. In the same Coinbase BTC-USD measurement, flagged rows broke slightly more often than plain bar extremes.
- Overtrading. More detail means more things to react to. Fine row sizes on fast markets can produce a flag on almost every bar.
- Small samples. Patterns on footprint charts are easy to remember when they work. Without a journal and a count, a few good examples feel like an edge.
- Data cost. True footprints need tick-level trade data with a side, which may mean a paid platform or data add-on.
A Step by Step Footprint Chart Reading Routine
Reading footprint charts well comes down to a routine. It works when the arithmetic is fixed before the session and the interpretation happens only at prices you chose in advance.
- Before the session, set row size so a typical bar has roughly 8 to 20 rows, set the imbalance threshold and a minimum row volume, and write them in your trading plan.
- Mark your levels from structure and volume profile: prior highs and lows, session POC, value area edges.
- When price reaches a level, read the footprint in order: totals and delta, POC, where the extremes formed, rows near the close, then flags.
- Ask whether effort matched result. Heavy aggression with progress supports continuation; heavy aggression without progress suggests absorption.
- Wait for the next bar to confirm before acting, and name the price that proves the reading wrong. Missing the first bar is fine; chasing it turns a planned trade into a different one.
- Log the footprint reading, the outcome and the comparison level in your journal, so after 50 or 100 cases you can test whether the pattern beat a plain high or low.
On futures platforms, check what data your account gives you before you rely on footprint or DOM tools. On our accounts, every account includes free Level 1 CME data; Level 2 depth is a paid add-on on Tradovate accounts only, and Rithmic accounts are Level 1 only for now. Quantower, available with our Rithmic credentials, has footprint (cluster) charts, Tradovate charts include a Bid-Ask Volume style, and TradingView works only through the Tradovate connection. Our funded accounts are simulated.
Related lesson: How to keep a trading journal
Footprint Chart FAQ
What is a footprint chart?
A footprint chart splits each bar into price rows and shows the volume traded at each row, usually as bid volume and ask volume. It is built from the same trades as a candlestick but keeps the full distribution inside the bar.
Is there a footprint chart on TradingView?
Yes. TradingView offers a volume footprint chart type in Supercharts, with plan availability set by TradingView. It estimates buy and sell volume from lower-timeframe price direction rather than reading exchange aggressor flags, and it repaints by design.
What is the best footprint chart?
The best footprint chart is one built from tick-level trades with a real aggressor side, on a platform where you can set row size, imbalance threshold and a minimum volume filter. Data quality matters more than how the chart looks.
How do you access footprint charts?
You need a charting platform that offers a footprint or cluster chart type and a data feed with tick-level trades. Check whether the platform reads real bid and ask sides or estimates them, because that changes every delta and imbalance number.
What does a footprint imbalance mean?
A footprint imbalance means one side traded at least a set multiple, often 300%, more than the other side on the diagonal row. It shows aggression at that price, not a guaranteed support or resistance level.
What row size should I use on a footprint chart?
Use a row size that gives a typical bar about 8 to 20 rows, and keep it fixed for the session. Finer rows produce many more imbalance flags, which makes each flag less informative.
Footprint charts describe past trading and do not predict price. Futures and leveraged products can lose money quickly, sometimes more than expected, and crypto markets used as examples here carry their own risks. The study figures describe one morning of BTC-USD data and are illustrative, not a forecast. Prop firm evaluation and funded accounts are simulated trading, and nothing here is investment advice.


