



TL;DR: Tick charts build each bar from a fixed number of trades, so a 500-tick bar can close in seconds at the open and take minutes at night. In ES, the open half hour traded about 19.5 times as many contracts per minute as the 2:00 AM hour. Use tick charts to time entries in liquid futures, with a slower time chart for context. Size the setting from measured trades per five minutes, and check your edge survives one tick of slippage per side.
What Tick Charts Are and What Each Bar Counts
Tick charts are price charts where each bar closes after a set number of trades instead of a set amount of time. A 500-tick chart draws a new bar every 500 transactions. Whether those 500 trades take six seconds at the open or eight minutes over lunch does not matter to the chart. CME Group's own chart-type lesson describes it the same way: a new bar forms after a set number of trades, and tick bars form faster when volume is high.
Each tick bar still records four prices: the open, high, low and close of that block of trades. So a tick chart looks like any other bar or candle chart. What changes is the rule that decides when one bar ends and the next begins.
The word "tick" causes real confusion here because traders use it three different ways.
- A tick as a trade. On a tick chart, a tick is one recorded transaction. NinjaTrader's documentation spells this out: a tick in a Tick bar is the point where an actual trade occurred.
- A tick as a price increment. On a range chart or in contract specs, a tick is the smallest price move. On the E-mini S&P 500 (ES) that is 0.25 index points, worth $12.50 per contract.
- The TICK index. The NYSE TICK index is a market-breadth reading: the number of NYSE stocks trading on an uptick minus the number on a downtick. It is a sentiment gauge for stocks, not a way of building bars.
When someone tells you to "watch the tick," ask which one they mean before you act on it. A 500-tick chart counts 500 trades, not 500 price increments and not a TICK reading of 500.
Related lesson: Tick size and tick value
Tick Charts vs Time-Based Charts
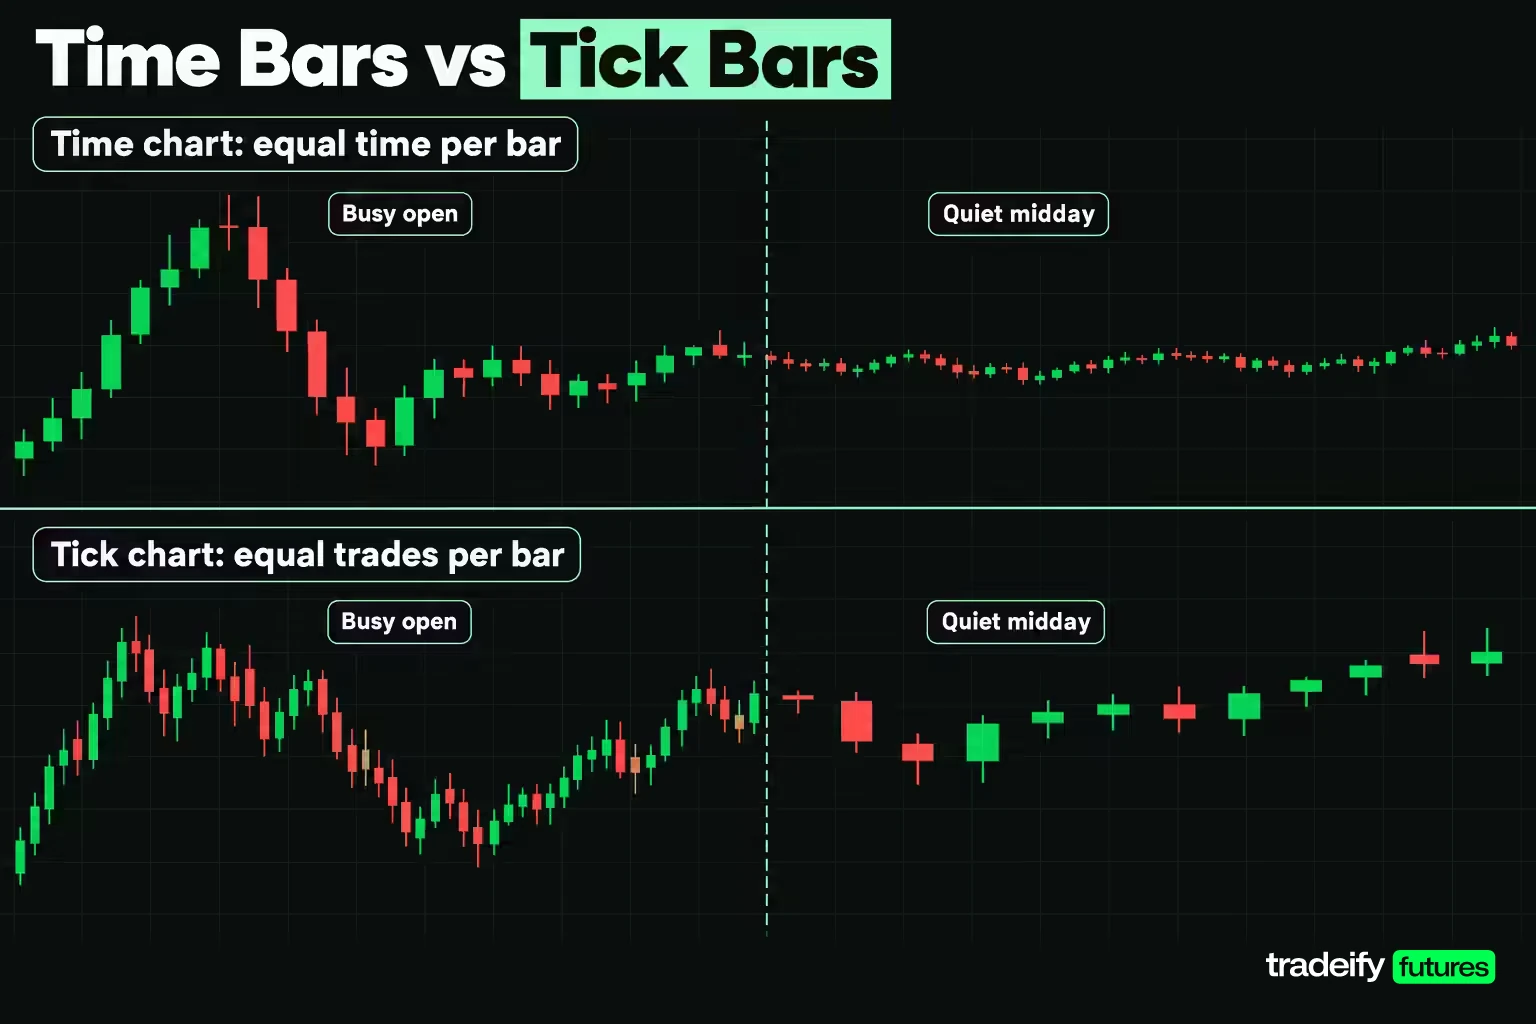
Tick charts and time-based charts fix opposite things. A five-minute chart fixes the clock and lets activity vary. Every bar covers five minutes, whether 300 trades happened in that window or 30,000. A tick chart fixes activity and lets time vary. Every bar holds the same number of trades, and the time each one covers stretches or shrinks with the market.
TradingView's help page describes how wide that range can be. The time inside a 10-tick bar could be a few seconds, a minute, an hour or even a day, depending on how actively the symbol trades.
That one design choice has three consequences you will feel on the screen.
- Quiet periods shrink. A slow lunch hour that fills a dozen five-minute bars may produce only a handful of tick bars. You stop staring at a row of tiny candles and reading meaning into them.
- Busy periods stretch out. The opening minutes, a data release or a sharp sell-off produce many tick bars, so you see more detail exactly when price is moving.
- Indicator periods change meaning. A 20-bar moving average on a five-minute chart covers 100 minutes. On a tick chart it covers 20 blocks of trades, and the clock time it spans drifts across the session. A setting that feels right at 10:00 AM can behave very differently at 2:00 AM.
Tick charts and time charts also handle the session boundary differently. Most platforms start a fresh tick bar when a new session opens, even if the last bar of the old session never reached its count. TradingView aligns tick bars to the session start, and NinjaTrader notes that the last bar of a session can be incomplete. Treat that final short bar as a partial bar, not a signal.
Related lesson: Trading chart types
Tick Charts vs Candlestick Charts
Tick charts and candlestick charts are not competing choices, which is why the comparison trips people up. A candlestick is a way of drawing a bar: a body for the open and close, wicks for the high and low. A tick chart is a rule for deciding what goes into each bar. You can draw tick bars as candlesticks, as OHLC bars or as a line, the same way you can draw five-minute bars any of those ways.
So the real question is which bar-building rule you want under the candles. The four common ones split into time-based and activity-based groups.
| Bar type | A new bar starts when | What stays constant | Main tradeoff |
|---|---|---|---|
| Time bars | The set time passes, such as 5 minutes | Clock time per bar | Quiet and busy periods get the same space |
| Tick bars | The set number of trades prints | Trades per bar | Bar speed swings with activity |
| Volume bars | The set number of contracts trades | Contracts per bar | One large order can fill a bar alone |
| Range bars | Price travels the set number of price ticks | Price range per bar | Time and trade count both disappear |
Tick bars and volume bars sound similar but count different things. Quantower's help page puts it plainly: each bar on a 500-tick chart holds 500 trades of any size, and a single trade can be one contract or 10,000 contracts. NinjaTrader's volume bar example counts 10,000 contracts per bar instead. A tick chart treats a one-lot and a large block as one tick each. A volume chart weights them by size.
Candlestick patterns carry over to tick bars with a caveat. A hammer or engulfing pattern on a tick chart describes a few hundred trades, not a full session of supply and demand. The shape is the same. The amount of information behind it is much smaller.
How to Read a Tick Chart
Reading a tick chart uses the same skills as any price chart, plus one extra piece of information: how fast the bars are printing. Price direction, levels and candle shape still matter. Bar speed tells you how much activity sits behind them.
A tick chart reading routine
Reading a tick chart works best as the same short routine every time, in this order.
- Start on the slower chart and mark the levels that matter for the session.
- Switch to the tick chart and note where price sits relative to those levels.
- Check bar speed: are bars printing faster or slower than usual for this hour?
- Check volume per bar for blocks that carry unusual size.
- Only then look for an entry pattern, and write down what would invalidate it.
The order matters because each step filters the next. A pattern found before the levels and pace are known is a pattern without context.
Read tick chart bar speed first
On a time chart, the number of bars per hour never changes. On a tick chart, it is information. Bars stacking up quickly mean trades are arriving fast. Bars that take minutes to complete mean participation has dried up.
Most platforms can show the countdown directly. NinjaTrader's Tick Counter indicator shows how many ticks remain in the current bar, and Tradovate has a configurable bar countdown in its chart view settings. Watching that number shrink tells you the pace before the bar closes.
Read levels and breakouts on the tick chart
Tick charts work best for the short-term structure of price: micro ranges, the break of a small swing, a pullback inside a short trend. Mark the high and low of a recent cluster of tick bars and watch how price behaves when it returns to them.
What tick charts do not do well is tell you which levels matter for the session. That comes from a slower chart.
Keep a slower chart open beside the tick chart
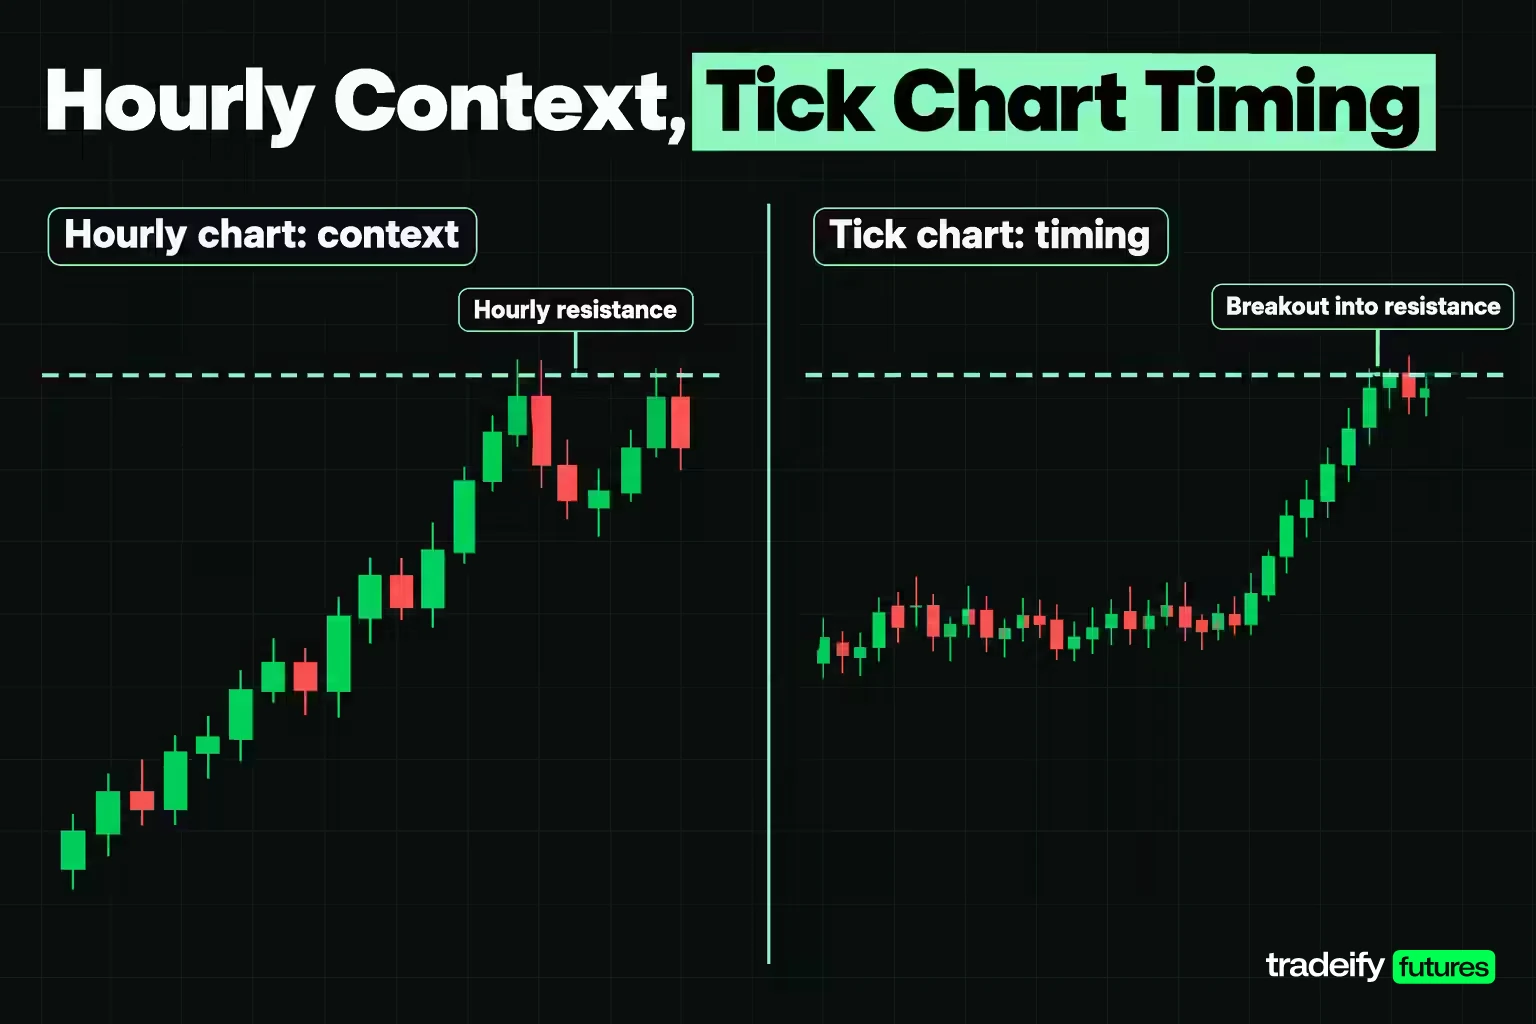
A tick chart shows what price is doing right now. An hourly or daily chart shows where it is doing it. A clean breakout on a 500-tick chart that runs straight into a well-tested hourly resistance is a valid pattern in the wrong place.
A common setup is a time chart for context (15-minute, hourly or daily) and a tick chart for timing. The slower chart picks the level and the direction. The tick chart picks the moment.
Pair the tick chart with volume per bar
Because every tick bar holds the same number of trades, volume per bar becomes a rough read on trade size. A 500-tick bar with far more contracts than its neighbors means larger orders were trading in that block. It does not tell you who placed them or why. It tells you that this block of trades carried more size, which is worth noticing at a level.
Related lesson: What is volume
What Tick Chart Speed Says About Volatility
Tick charts change speed with activity, and activity in futures follows a strong daily rhythm. To show how large that swing is, here is a small descriptive study of real ES trading, counted for this guide from Yahoo Finance's one-minute ES futures data. It uses one-minute contract volume for the ES front-month continuous series across five regular sessions, October 29 to November 4, 2026, grouped by Eastern Time clock windows.
| ES time window (ET) | Average contracts per minute | Pace vs 9:30 AM open |
|---|---|---|
| 2:00 to 3:00 AM | 327 | About 1/20 |
| 8:00 to 9:00 PM | 527 | About 1/12 |
| 8:00 to 8:30 AM | 813 | About 1/8 |
| 9:30 to 10:00 AM | 6,382 | Baseline |
| 10:00 to 10:30 AM | 5,289 | About 4/5 |
| 12:00 to 1:00 PM | 2,773 | 43% |
| 3:30 to 4:00 PM | 7,468 | About 1.2 times |
The open half hour traded about 19.5 times as many contracts per minute as the 2:00 AM hour, and midday ran at 43% of the open pace. The busiest window in this sample was actually the last half hour of the stock market session, not the open.
Converting ES activity into tick bar speed
Translating the ES volume study into tick bars takes one assumption. The study counts contracts, not trades, so the conversion assumes trade count moves roughly in line with contract volume. On that assumption, a tick bar that fills in 30 seconds at the 9:30 AM pace would take about 69 seconds at midday, 26 seconds in the 3:30 PM window, 363 seconds at 8:00 PM and about 586 seconds (roughly 9.8 minutes) at 2:00 AM.
That speed change is the volatility information tick charts give you. When bars that normally take half a minute start completing every few seconds, activity has jumped, and price swings usually widen with it. When the same bars crawl, the market is thin, and a breakout on a thin market has fewer participants behind it.
Why tick charts look less noisy
The same activity swing explains the "less noise" claim made for tick charts. During quiet stretches, a time chart keeps printing small, overlapping bars that look like structure but carry little activity. A tick chart prints few bars in the same stretch, so the quiet period takes up less of your screen and your attention. The noise has not gone away. It just gets fewer bars to sit in.
The five-session ES sample is small and these numbers will shift with the news calendar, so treat them as a sketch of the daily rhythm, not fixed values. Volumes are as of the sample dates.
Related lesson: What is liquidity
Benefits of Tick Charts
Tick charts have real advantages. Each one comes with a condition, and the condition is where traders get caught.
- Bars weighted by activity. Every bar represents the same amount of trading, so a bar means roughly the same thing at 9:45 AM and 1:15 PM. The condition is that the instrument trades enough to fill bars at a useful pace.
- Quiet periods compress. Slow markets produce fewer bars, which cuts down on small, meaningless candles. The condition is that you still respect what a quiet market is telling you: low participation.
- More detail when price is moving. During a release or the open, a tick chart may print several bars in the time a five-minute chart prints one. You see a pullback, a stall or a reversal forming while the time bar is still open.
- A built-in activity gauge. Bar speed doubles as a live read on participation, with no extra indicator needed.
The early-signal benefit is the one most often oversold. Yes, a tick chart can show a momentum shift before the five-minute bar closes. But the same speed produces more signals that fail, because a few hundred trades is a small sample of opinion. Earlier detail is only an edge if your rules filter it. Otherwise it is just earlier noise.
The honest version of "are tick charts worth it" is this: they are worth it when your decisions depend on timing inside busy, liquid markets, and when you have checked the cost. For a trader holding positions for an hour or more, a tick chart mostly adds bars to watch and reasons to fidget.
How to Choose a Tick Chart Setting
Tick chart settings are not universal, and this is where most traders start wrong. A setting copied from a forum was chosen for someone else's instrument, session and data feed. The better approach is to measure your instrument's activity and pick a count that gives you the bar pace you want.
A tick chart sizing method
The method takes about ten minutes on most platforms.
- Find the average number of trades per session for your instrument over a recent stretch, such as the last few months. Some platforms show this as a tick count or number-of-trades study. Make sure it counts trades, not contracts.
- Divide by the hours the instrument actually trades. CME equity index futures trade nearly around the clock, about 23 hours a day. Many agricultural contracts trade far fewer hours, and using the wrong session length throws the result off badly.
- Divide trades per hour by 60 for trades per minute, then multiply by 5 for the trade count in an average five-minute window.
That five-minute figure is your anchor. A tick setting that is a small fraction of it is an entry-timing chart. One closer to it, or above it, is a context chart.
Worked tick chart sizing worksheet
Take an illustrative instrument averaging 1,800,000 trades per session over a 23-hour day.
| Step | Calculation | Result |
|---|---|---|
| Trades per hour | 1,800,000 / 23 | 78,261 |
| Trades per minute | 78,261 / 60 | 1,304 |
| Trades per five minutes | 1,304 x 5 | 6,522 |
| 500-tick bar share of five minutes | 500 / 6,522 | 7.7% |
| 1,500-tick bar share | 1,500 / 6,522 | 23.0% |
| 4,500-tick bar share | 4,500 / 6,522 | 69.0% |
On this instrument, a 500-tick bar carries about 7.7% of an average five-minute window. It is a timing chart, not a view of the session. A 4,500-tick bar carries 69.0%, which behaves more like a fast context chart.
How tick chart bar duration changes with activity
The same settings convert into very different clock times as activity moves. At average activity on the illustrative instrument, a 500-tick bar takes 23 seconds, a 1,500-tick bar 69 seconds and a 4,500-tick bar 207 seconds.
| Activity level | 500-tick bar | 1,500-tick bar | 4,500-tick bar |
|---|---|---|---|
| Four times average (open or news) | 6 sec | 17 sec | 52 sec |
| Average session | 23 sec | 69 sec | 207 sec |
| One quarter of average (quiet midday) | 92 sec | 276 sec | 828 sec |
| One twentieth of average (overnight lull) | 460 sec | 1,380 sec | 4,140 sec |
Read the bottom row again. On the illustrative instrument, a 4,500-tick chart that prints a bar every 52 seconds during a news spike prints one bar about every 69 minutes in a dead market. Nothing about the chart changed. Only the activity did. The one-twentieth row is not extreme, either: in the ES volume study from Yahoo Finance data, the 2:00 AM hour ran at about one twentieth of the open's pace.
That is why the right test for a setting is your own trading window. Pick the hours you actually trade, then check that the bar pace in those hours matches how fast you can make a decision.
What the popular tick chart numbers mean
Settings such as 233, 377 and 610 show up constantly. They are Fibonacci numbers, and nothing about the sequence makes them better than 250, 400 or 600. Round values like 100, 500, 1,000 and 1,500 are just as common. The setting that matters is the one whose pace fits your instrument and your process, so test two or three candidates over the same sessions and keep the one you can actually trade.
Recheck the number every few months. Volume shifts with volatility regimes, and a setting that printed 20-second bars last quarter may print 10-second bars this quarter.
Related lesson: Multiple timeframe analysis
Setting Up Tick Charts on Trading Platforms
Tick charts are available on most futures charting platforms, but the menu, the limits and the data handling differ. Here is where the setting lives on common platforms.
| Platform | Where to set tick bars | Worth knowing |
|---|---|---|
| Tradovate | Chart interval menu, Custom, then Tick | A pop-up asks for the number of ticks per bar |
| NinjaTrader 8 | Data Series, bar type Tick, then the value | Tick Counter indicator shows ticks left in the bar |
| TradingView | Interval menu or type 1T, 10T, 100T or 1000T | Presets only, no custom counts |
| Sierra Chart | Type a number followed by t, such as 100t | Set data storage to 1 Tick for exact counts |
| Quantower | TimeFrame Selector, then Tick Bars | Lets you choose the data type behind the bars |
| WealthCharts | Timeframe selector, custom interval in ticks | Custom tick timeframes are unlimited |
Two platform details deserve more than a table cell.
TradingView tick intervals are limited. As of November 4, 2026, TradingView's pricing page lists tick-based intervals only on its top Ultimate plan, with 7 days of tick history. Its help page adds that tick intervals cannot be customized, do not work with Bar Replay or deep backtesting, and are not available in the mobile apps. On continuous futures symbols such as ES1!, tick history covers only the current and previous contracts.
Sierra Chart stores data at one-second resolution by default. Its documentation says Number of Trades bars need the Intraday Data Storage Time Unit set to 1 Tick for full precision. With coarser storage, the bars can come out less accurate.
Why the same tick chart setting can count differently
A tick count depends on how trades reach your platform. On CME Globex, the exchange's market data feed reports a match as a Trade Summary message: all the orders that traded together against one aggressing order, with an entry for each price level it filled at. A single 50-lot market order that sweeps four price levels can therefore be counted as one trade, as four or as many individual fills, depending on how your data provider and platform handle it.
Sierra Chart exposes this choice directly with a setting called "Combine Trades into Original Summary Trade". Other platforms make the choice for you. This is why a 500-tick chart on one feed will not match a 500-tick chart on another, and why a setting copied from someone on a different platform can print at a different pace.
A practical tick chart setup checklist:
- Chart the front-month contract you actually trade, not a continuous symbol, when you need tick history.
- Confirm whether your platform restarts tick bars at the session open.
- Turn on a tick countdown so you can see how far along the current bar is.
- Add a volume study so each bar's size is visible.
- Stay on one data feed for both testing and trading.
Which Markets Tick Charts Work On
Tick charts work on any market where you get a stream of individual trades, but the quality of that stream varies by market structure.
- Futures. Exchange-traded futures such as ES, NQ and crude oil are the natural home for tick charts. Trades print on a central exchange, so every feed starts from the same trade record, even if platforms count it differently.
- Stocks. Liquid stocks work well on tick charts. Thinly traded names fill bars slowly and give you long gaps.
- Crypto. Each crypto exchange has its own trade stream, so a tick chart of one venue reflects that venue's activity, not the whole market.
- Spot forex. Spot FX is an over-the-counter market, as the Bank for International Settlements describes it, with liquidity spread across banks, non-bank providers and many trading venues. There is no single exchange tape, so a spot forex "tick" usually reflects one provider's price stream. MetaTrader 5, for example, stores tick volume and real trade volume as separate fields in its bar data.
Tick charts in forex futures vs spot forex
Forex traders who want exchange-reported trades can chart currency futures instead. A Euro FX futures contract (6E) trades on CME Globex with a tick of 0.00005, worth $6.25 per contract. A tick chart of 6E counts trades on one central market, while a tick chart of spot EUR/USD counts whatever your broker's feed delivers.
Some symbols do not support tick charts at all. TradingView lists indices without volume, options, end-of-day symbols and certain government bond and yield symbols as unsupported, because there is no trade-by-trade record to count.
Tick Chart Strategies for Day Trading and Scalping
Tick charts suit intraday approaches where entry timing matters more than the holding period. The three tick chart strategies in this section (level breakout, trend pullback and exhaustion at a level) share one structure: a time chart picks the level and direction, and the tick chart picks the entry.
Level breakout with acceptance on a tick chart
A level breakout trade on a tick chart waits for price to clear a higher-timeframe level and hold it. Imagine ES has an hourly resistance at an illustrative 7,000.00, and price builds a tight range just under it on a 500-tick chart.
The tempting trade is buying the break of the small range at 6,999.25. That entry sits only 3 ticks under the hourly level. An 8-tick target would have to push through resistance to get paid.
The alternative is to wait for acceptance. Price breaks 7,000.00, pulls back, and the pullback holds above the level on the tick chart. Entry goes in on a break of the pullback bar's high at 7,000.75, with a stop at 6,999.25 back under the level.
- Stop distance: 6 ticks, which is $75.00 on ES or $7.50 on the Micro E-mini S&P 500 (MES).
- Target: 7,002.75, 8 ticks away, which is $100.00 on ES or $10.00 on MES.
- Invalidation: a tick bar closing back under 7,000.00. That means the breakout was not accepted, and the reason for the trade is gone.
Missing the first break does not make the next price a good entry. If price runs above 7,000.00 without a pullback, chasing it is a different trade with a worse stop, and passing is a valid outcome.
Pullback in a short tick chart trend
When the context chart trends up, a tick chart can time pullbacks inside that trend. A trader may wait for a series of tick bars to pull back into a prior swing high that now acts as support, then enter when a tick bar closes back in the trend direction. The stop goes beyond the pullback low.
The filter that matters is bar speed. A pullback where bars slow down suggests sellers are not pressing. A pullback where bars speed up and carry heavy volume is not a pullback yet. It may be the start of a reversal.
Exhaustion at a level on a tick chart
An exhaustion trade on a tick chart watches for a move into a higher-timeframe level that stalls. Bars print fast into the level, then volume per bar stays high while price stops making progress. That pattern suggests orders are being absorbed at the level.
Exhaustion is the least reliable tick chart strategy of the three, because "stalling" is easy to see after the fact and hard to define beforehand. Write the definition down (for example, three tick bars with no new high and above-average volume) before you trade it, or skip it.
Whichever tick chart strategy you test, keep the same tick setting across your whole sample. Changing the setting mid-test means your results describe two different charts.
Related lesson: Scalping futures
What Slippage Does to a Tick Chart Edge
Slippage on a tick chart strategy is a number, and with short targets it can be bigger than the edge. Fast bars encourage small targets and frequent trades, which is exactly where execution cost does the most damage.
Here is an illustrative model on ES, where one price tick is worth $12.50. Over 100 trades, 55 win at an 8-tick target and 45 lose at a 6-tick stop.
| Item | Ticks | ES dollars |
|---|---|---|
| Gross from 55 winners at 8 ticks | 440 | $5,500.00 |
| Gross cost of 45 losers at 6 ticks | 270 | $3,375.00 |
| Gross result | 170 | $2,125.00 |
| Gross per trade | 1.70 | $21.25 |
| Slippage at 1 tick per side over 100 round trips | 200 | $2,500.00 |
| Net result | -30 | -$375.00 |
| Net per trade | -0.30 | -$3.75 |
The gross edge looks real at 1.70 ticks per trade. One tick of slippage getting in and one getting out turns it into a loss. The setup logic did not fail. The execution cost did. The breakeven slippage for this model is only 0.85 ticks per side, before commissions.
Now scale that cost. Six round trips a day with one tick of slippage per side costs this much, before any commission:
| Contract | Per day | 20 sessions | 250 sessions |
|---|---|---|---|
| E-mini S&P 500 (ES) | $150.00 | $3,000.00 | $37,500.00 |
| Micro E-mini S&P 500 (MES) | $15.00 | $300.00 | $3,750.00 |
| E-mini Nasdaq-100 (NQ) | $60.00 | $1,200.00 | $15,000.00 |
| Micro E-mini Nasdaq-100 (MNQ) | $6.00 | $120.00 | $1,500.00 |
Two habits follow from this. First, put your measured average slippage into every backtest as a cost per side, not a footnote. A method with a one-tick edge and two ticks of cost is not a method with a small problem.
Second, size the contract to the stop instead of shrinking the stop to fit the contract. A 6-tick stop costs $75.00 on ES and $7.50 on MES. With a $250 risk budget, that is 3 ES contracts or 33 MES contracts by the same arithmetic, and the micro contract is how a smaller account keeps the same setup without cutting the stop.
Related lesson: Slippage explained
Tick Chart Limitations and Failure Modes
Tick charts have real drawbacks, and most of them show up as specific, repeatable mistakes.
| Failure mode | What it looks like | Correction |
|---|---|---|
| Copying a tick setting | Bars print at a pace that does not fit your decisions | Derive the setting from your instrument's measured activity |
| No slippage in the test | Strong backtest, flat or negative live results | Add measured slippage per side before trusting the edge |
| Pattern hunting on tiny samples | Many valid-looking setups, random outcomes | Trade levels, breakouts and short trends, not textbook patterns |
| Indicator period confusion | Signals behave differently in quiet and busy hours | Read indicator periods as blocks of trades, not minutes |
| Ignoring the higher timeframe | Clean entries straight into strong opposing levels | Keep an hourly or daily chart open for context |
| Expecting identical bars everywhere | Your 500-tick chart does not match another platform | Accept feed differences and stay on one feed |
| Expecting deep history | Cannot load months of tick bars to test | Test rule logic on time data, confirm on recent tick data |
| Trading a thin market | Long gaps between bars in your trading hours | Keep tick charts for instruments with heavy participation |
Why tick chart feeds and history cause problems
Two tick chart failure modes, mismatched bars and short history, come straight from vendor documentation. Sierra Chart's help says Number of Trades charts from different services or connections "probably will not exactly look the same", and calls matching a friend's chart on an inconsistent feed an impossible task. And tick history is often short: TradingView's tick intervals do not work with Bar Replay or deep backtesting, and its tick history is limited to days, not years.
The quieter tick chart limitation is psychological. Fast bars create a constant stream of "something is happening." That feeling invites overtrading, especially after a loss, when every new bar looks like a chance to get it back. A tick chart does not create more good setups. It creates more bars.
Related lesson: Maximum risk per trade
When Time Charts Work Better Than Tick Charts
Tick charts are the right tool for some trading jobs and time charts are better for others. This table sorts the common cases.
| Job | Better choice | Reason |
|---|---|---|
| Reading session structure | Time bars | Equal spacing makes days comparable |
| Timing entries during heavy activity | Tick bars | Bars form faster when price is moving |
| Watching a quiet midday market | Time bars | Tick bars slow to a crawl and show little |
| Backtesting a rule over months | Time bars | Tick history is often short or paid |
| Comparing notes with other traders | Time bars | Tick bars differ across data feeds |
| Trading a thinly traded contract | Time bars | The count can take too long to fill |
| Spotting activity surges at a level | Tick bars | Bar speed shows the surge directly |
If most of your trading falls in the time-bar rows, a tick chart is an optional extra, not an upgrade. If your trading happens in fast markets at specific levels, a tick chart for timing plus a time chart for context is a reasonable pairing to test.
Related lesson: Support and resistance
Tick Charts Under Intraday Account Rules
Tick charts are easy to set up on the platforms our traders connect: the Tradovate Web App has a Tick interval type, and WealthCharts lets you build custom tick timeframes. Two of our rules are worth checking against a fast tick chart. All positions must be closed by 4:45 PM ET, so any tick chart strategy has to be flat by then each day. And on our Sim Funded accounts, a payout request needs more than 50% of your trades held longer than 10 seconds, with more than 50% of profit coming from those trades, so very short holds on very fast bars can block a payout even when they are profitable.
Tick Charts FAQ
What is a 1000 tick chart?
A 1000 tick chart draws one new bar after every 1,000 trades in the instrument. The clock plays no part. In a busy session that bar can complete in seconds, and in a quiet market it can take many minutes.
Do professional traders use tick charts?
Some active intraday futures traders use them, mostly for entry timing, and many traders never do. Popularity is not evidence of an edge. Test a tick chart against your own rules and costs before deciding it improves anything.
Is a tick chart the same as the TICK index?
No. A tick chart is a price chart built from a set number of trades. The NYSE TICK index is a breadth reading that subtracts stocks on downticks from stocks on upticks. They share a word and nothing else.
Can you backtest a tick chart strategy?
Usually only over a short window, because many platforms limit or charge for historical tick data. A practical route is to test the rule logic on time-based data, add a realistic slippage cost, then confirm the behavior on the recent tick history you can load.
What is the difference between a tick chart and a volume chart?
A tick chart closes a bar after a set number of trades, regardless of their size. A volume chart closes a bar after a set number of contracts or shares trade. One large order counts as one tick but can fill a volume bar on its own.
Why do tick charts look different on two platforms?
Data feeds deliver and group trades differently, so the same setting can produce different bars on two platforms. This is expected, not a setting you got wrong. Pick one feed and stay with it for testing and trading.
Tick Chart Trading Risk Note
Trading futures involves substantial risk of loss and is not suitable for everyone, and leverage means losses can exceed what you expect on a single trade. Stop orders do not guarantee your exit price, and fast markets can fill well beyond the level you set. Every price, trade count, account figure and position size in this guide is illustrative, and the ES volume study is a small descriptive sample, not a forecast or a record of real trades. Evaluation and funded prop firm accounts are simulated, and simulated results do not represent live trading. This guide is general education, not investment advice.


