



TL;DR: Day trading means opening and closing every position inside one session, so your risk is the range that session prints. In 49 measured E-mini S&P 500 sessions, 41.1% of the day's range came in the first 30 minutes and 79.2% by noon. Costs, capital and rules shape results more than the setup, and the old $25,000 pattern day trader rule is being replaced. Most day traders lose money, so start in a simulator with a written plan and a daily loss cap.
Day trading is buying and selling (or selling and buying) the same instrument within one trading session and ending the day flat. Nothing rides through the overnight gap. That one constraint changes everything else about the job: your stop has to live inside the range a single session prints, your profit has to come out of that same range, and every trade you take pays a cost that a longer-term investor pays only a few times a year.
The useful way to look at day trading is as a schedule and a cost structure, not a personality type. So this guide measures how a real session spends its movement across the clock, tests the most popular intraday setup against that data, and prices a round turn against the movement you are trying to capture. Then it works through the money, margin, tax and rule questions that decide whether the style fits your life.
What Day Trading Means in Practice
Day trading is a holding-period rule, not a strategy. A day trader opens and closes positions inside the same session, so no position carries into the next day. Someone taking two trades before lunch is day trading, and so is someone taking forty. The second person just pays forty times the friction.
The SEC's investor education site describes day traders as people who rapidly buy, sell and short-sell throughout the day, and it does not soften the warning: "Day trading is extremely risky and can result in substantial financial losses in a very short period of time." That sentence is worth keeping in view, because most of what follows explains where those losses come from.
The day trading workflow
A typical day trading session runs in four phases:
- Preparation. Check the economic calendar, mark the prior day's high, low and close, and decide which hours you will trade.
- The active window. Wait for a setup you defined in advance, size it from the stop, and enter only when the trigger prints.
- Management. Let the stop and target do their job, or exit on the rule you wrote down, not on a feeling.
- Review. Record every trade the same day, including the ones you skipped and why.
Markets day traders use
The label covers several markets that share nothing except the same-day exit. Stock day traders work individual shares and ETFs during exchange hours. Futures day traders trade contracts such as the E-mini S&P 500 (ES) and its Micro version (MES), where one contract controls a fixed dollar amount per index point. Forex day traders work currency pairs, and options day traders trade short-dated contracts. The mechanics, costs, margin and rules differ a lot between them, which is why the rest of this guide states which market each number belongs to.
Related lesson: Trading styles explained
The Day Trading Session Clock Measured on 49 ES Sessions
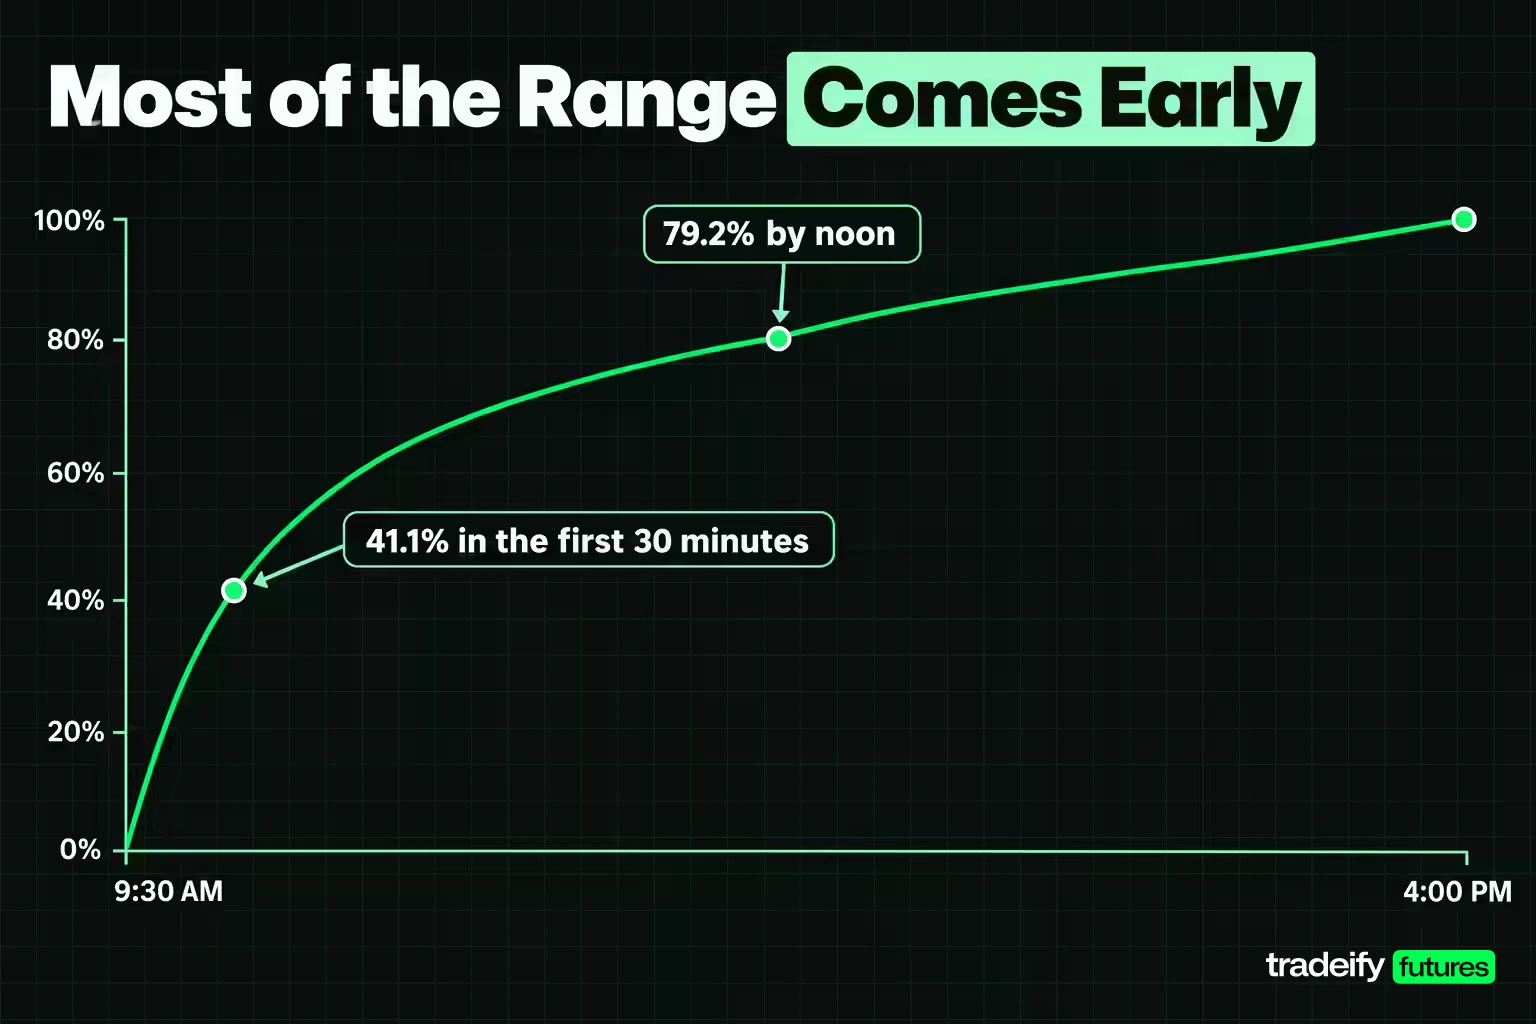
Day trading treats a session as the unit of risk, so it pays to know how a session actually spends its movement. Range does not arrive evenly through the day. To measure it, 49 complete regular-hours sessions of the front E-mini S&P 500 futures contract (August 27 to November 4, 2026, 5-minute bars, 9:30 AM to 4:00 PM ET) were split into 30-minute windows. For each window the study recorded its average range, how much of the session's final high-to-low range had been printed by the end of it, and how often the session's eventual high and low were already in place.
| Window (ET) | Average range (points) | Share of final range printed by window end | Session high already set | Session low already set |
|---|---|---|---|---|
| 9:30 AM | 21.93 | 41.1% | 24.5% | 24.5% |
| 10:00 AM | 22.56 | 58.1% | 30.6% | 40.8% |
| 10:30 AM | 19.09 | 67.0% | 36.7% | 53.1% |
| 11:00 AM | 16.82 | 75.2% | 44.9% | 61.2% |
| 11:30 AM | 16.27 | 79.2% | 57.1% | 67.3% |
| 12:00 PM | 14.67 | 82.8% | 61.2% | 69.4% |
| 12:30 PM | 13.96 | 86.7% | 65.3% | 69.4% |
| 1:00 PM | 13.57 | 89.5% | 69.4% | 77.6% |
| 1:30 PM | 11.48 | 90.7% | 71.4% | 79.6% |
| 2:00 PM | 13.15 | 92.7% | 75.5% | 81.6% |
| 2:30 PM | 12.97 | 95.6% | 79.6% | 87.8% |
| 3:00 PM | 15.78 | 97.9% | 87.8% | 93.9% |
| 3:30 PM | 15.79 | 100.0% | 100.0% | 100.0% |
The average session ranged 62.27 points (median 56.25). On one ES contract at $50 per point that is $3,113.50 of movement; on one MES at $5 per point it is $311.35.
What the ES session clock means for a day trader
In this guide's 49-session measurement of the front E-mini S&P 500 contract, the first 30 minutes printed 41.1% of the range the day would end up showing, and by noon 79.2% of it was already on the chart. The early afternoon is the quietest stretch, with the 1:30 PM window averaging 11.48 points, roughly half the opening window. The last hour picks up again (15.78 and 15.79 points), which is the familiar U-shape of an equity index session.
Here is the part that catches traders who sell the morning high. In the same ES measurement, the session high was in place by 10:00 AM in only 24.5% of sessions, and both the high and the low had printed before 10:30 AM in just 2 of 49. The morning carries most of the movement, but it rarely finishes the day's story. Treat a morning high as a level to watch, not a verdict.
The practical decision follows from the table. If your schedule only allows the afternoon, you are choosing the quieter part of the day, with smaller targets and fewer clean moves. That can work, but your targets and stop sizes should come from afternoon ranges, not from what the open does.
One more number matters for every later decision: the average 5-minute bar ranged 6.38 points, 10.2% of the average session. That is the noise a stop has to survive and the yardstick a round-turn cost should be measured against.
The sample is ten weeks of one instrument in one market regime, measured on a continuous contract. It describes how this market behaved recently; it does not promise the next ten weeks will look the same.
Day Trading Strategies and Their Measured Base Rates
A day trading strategy is a rule for where you enter, where you are wrong and where you get paid, all inside one session. The common families:
- Opening range breakout. Mark the high and low of the first 15 or 30 minutes and trade a break of either side.
- Momentum. Join a strong directional move after confirmation, usually on volume or a news catalyst.
- Pullback. Wait for a trending market to retrace to a reference such as VWAP or a prior level, then enter in the trend's direction.
- Fade or mean reversion. Sell an extended move into resistance, or buy into support, expecting a return toward the session average.
- Scalping. Many very short trades for a few ticks each, where cost and execution decide almost everything.
- News trading. Trading the reaction to scheduled releases such as the Consumer Price Index at 8:30 AM ET, where spreads widen and slippage grows.
Opening range breakout base rates on ES
The opening range breakout is the most widely taught intraday plan, so it is a fair test. This guide measured it on 49 regular-hours sessions of the front E-mini S&P 500 contract (Yahoo Finance 5-minute data, August 27 to November 4, 2026). The opening range (9:30 to 10:00 AM) averaged 21.93 points wide. Every session traded beyond at least one side of it later in the day, and the median session extended 1.31 widths beyond its larger side. Extension, however, was neither symmetric nor generous.
| This guide's measurement on 49 ES sessions | Upside break | Downside break |
|---|---|---|
| Extended at least 1 range width | 21 sessions (42.9%) | 17 sessions (34.7%) |
| Extended at least 2 range widths | 5 sessions (10.2%) | 8 sessions (16.3%) |
| Rule triggered (first 5-minute close beyond the range) | 32 sessions | 34 sessions |
| Trade later reached 1 width of open profit | 15 of 32 (46.9%) | 14 of 34 (41.2%) |
| Trade later reached 2 widths of open profit | 3 of 32 (9.4%) | 7 of 34 (20.6%) |
| Target of 1 width hit before a stop at the far side | 12 of 32 | 11 of 34 |
| Stop at the far side hit before the target | 8 of 32 | 14 of 34 |
Reading the opening range breakout results
In this guide's 49-session ES measurement, the bottom two rows of the breakout table matter most. With a stop at the opposite side of the range and a target one range width away, the long breakout reached its target first 12 times, hit its stop first 8 times, and touched neither 12 times. The short side was worse: 11 targets against 14 stops. Held all the way to the 3:55 PM bar close, the long trade finished positive in 15 of 32 sessions with a median result of minus 2.62 points.
None of this makes the opening range breakout broken. It makes it a low base rate setup whose result depends on the exit rule and the cost of each attempt. In the same measurement, a two-width target, popular in courses, was reached in 3 of 32 long trades.
The temptation after reading numbers like these is to keep tweaking until the table looks good. Resist it. A rule fitted to 49 sessions will look great on those 49 and tell you little about the next ones. The better use of a base rate is as a reality check: if your plan cannot state its own hit rate, you cannot tell when it stops working.
Related lesson: Opening range breakout
Technical Analysis for Day Trading Charts
Technical analysis for day trading is mostly about location and timing on short charts. A day trader typically reads three things: where price is relative to levels that matter today, whether volume confirms a move, and how much noise one bar carries.
- Timeframes. Many intraday traders use a higher chart (15-minute or hourly) for levels and a 1- to 5-minute chart for entries. The higher chart tells you where you are; the lower chart tells you when.
- Support and resistance. The prior day's high, low and close, the overnight high and low, and the opening range are the levels most intraday traders watch, because many other participants watch them too.
- VWAP. The volume-weighted average price resets each session and acts as the day's fair-value reference. Price holding above it suggests buyers are in control of the session; repeated failures at it suggest the opposite.
- Volume. A break on rising volume is more trustworthy than one on fading volume. Time-and-sales and volume profile show where trading actually happened.
- Indicators. Moving averages, RSI and MACD are common, but on 1- to 5-minute charts they lag quickly. Use one or two as filters, not as triggers.
Stop distance and bar noise in day trading
The most useful chart fact for a day trader is the size of an ordinary bar. In the 49-session ES measurement, the average 5-minute bar ranged 6.38 points. A 2-point stop sits inside about a third of one normal bar, so ordinary noise can take it out before the idea is tested. A stop belongs beyond a level that would prove the trade wrong, and the position size should shrink to fit that stop, not the other way round.
Related lesson: Tick size and tick value
One Day Trading Session Resolved Bar by Bar
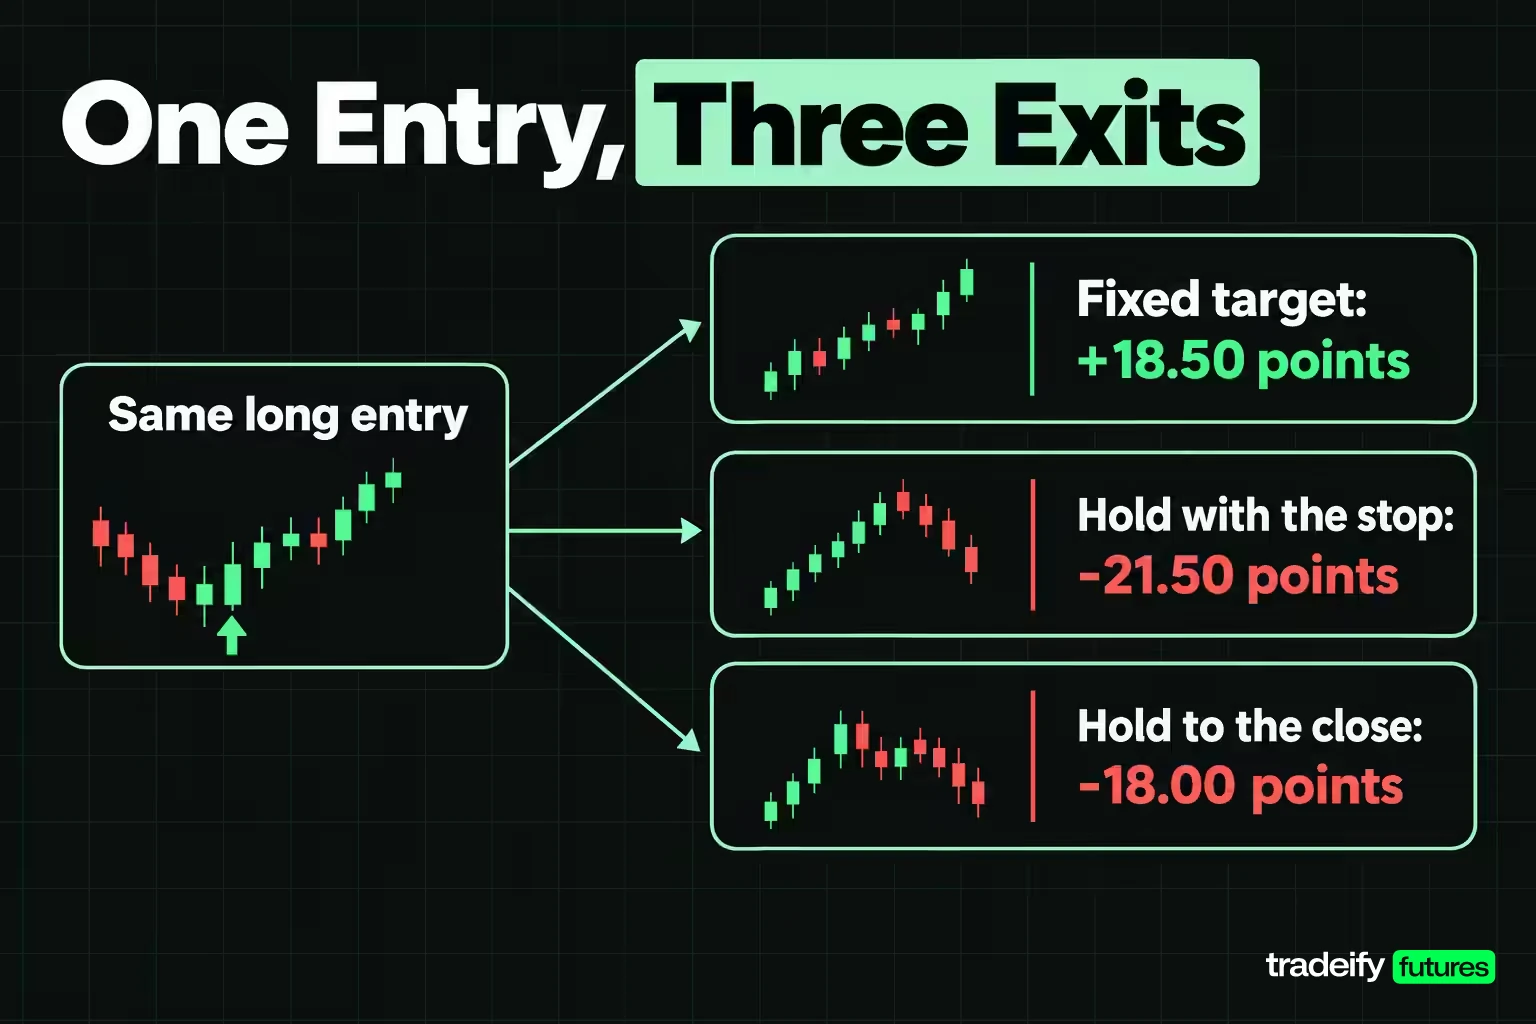
A single session shows how the same entry can produce three different results depending on the exit. The October 19, 2026 ES session is a fair example because nothing unusual happened.
The market opened at 7,741.50. The opening range printed a high of 7,749.75 and a low of 7,731.25, a width of 18.50 points. The 10:00 AM bar dipped to 7,727.50, below the range low and the low of the whole day, then closed back inside at 7,732.00. A trader who had shorted that dip would have been caught at the bottom. The long rule waited for a close, and the 10:10 AM bar closed at 7,752.75, the first close above the range high.
The plan: long at 7,752.75, stop at the range low of 7,731.25 (21.50 points of risk), target one range width higher at 7,771.25. The 11:25 AM bar reached 7,771.50 and filled the target. The session high came ten minutes later at 7,773.25. Then the market drifted lower all afternoon, and the 3:55 PM bar traded down to 7,730.75, through the original stop, before closing at 7,734.75.
| Exit rule on October 19, 2026 | Exit price | Points | One MES, gross | One ES, gross |
|---|---|---|---|---|
| Fixed target of 1 range width | 7,771.25 | +18.50 | +$92.50 | +$925.00 |
| Hold with the stop, no target | 7,731.25 | -21.50 | -$107.50 | -$1,075.00 |
| Hold to the close, no stop | 7,734.75 | -18.00 | -$90.00 | -$900.00 |
The entry was clean and the direction was right. The difference between a $92.50 gain and a $107.50 loss on one Micro contract came entirely from the exit rule. From the 7,773.25 high to the close, the market gave back 38.50 points. If you have ever watched a winner turn into a full stop, this is what that looks like on the tape. The fix is not a better entry. It is deciding the exit before the entry, and then letting it do its job when the market tags it.
Day Trading Costs and Taxes
Day trading costs scale with activity, which is why two traders running the same rule can end up in different places. A round turn (entry plus exit) pays commissions and exchange fees on both sides plus any slippage.
Day trading cost ladder on ES and MES
This cost ladder compares cost with the 62.27-point average session range from this guide's 49-session E-mini S&P 500 measurement (August 27 to November 4, 2026). It uses illustrative assumptions, not a broker quote: $5.00 of commissions and fees per ES round turn plus one tick of slippage ($12.50), and $1.50 per MES round turn plus one tick ($1.25).
| Round turns per day | ES cost | ES cost in points | Share of a 62.27-point session | MES cost | MES cost in points | MES share of the session |
|---|---|---|---|---|---|---|
| 1 | $17.50 | 0.35 | 0.6% | $2.75 | 0.55 | 0.9% |
| 5 | $87.50 | 1.75 | 2.8% | $13.75 | 2.75 | 4.4% |
| 10 | $175.00 | 3.50 | 5.6% | $27.50 | 5.50 | 8.8% |
| 20 | $350.00 | 7.00 | 11.2% | $55.00 | 11.00 | 17.7% |
Two things stand out. First, one ES round turn under these assumptions costs 5.5% of an average 5-minute bar, and twenty of them cost 7.00 points, more than one whole average bar every day before a single trade is right. Second, the Micro contract is cheaper in dollars but more expensive in points: one MES round turn costs 0.55 points against 0.35 on ES, because fixed fees weigh more on a contract one tenth the size. Micros let you size small; they do not make trading cheap.
Run your own numbers with your broker's real commission schedule. At these illustrative costs, about 178 ES round turns or 113 MES round turns cost as much as one entire average session range.
How day trading is taxed in the US
Tax treatment depends on the market and on how the IRS classifies you. This is general information, not tax advice.
- Stocks and ETFs. Gains and losses are usually short-term capital gains for a day trader. The wash sale rule disallows a loss if you buy substantially identical stock or securities within 30 days before or after the sale, adding the loss to the new position's basis. Frequent day traders hit this constantly.
- Trader tax status. The IRS treats you as a trader in securities only if you seek profit from daily market movements, your activity is substantial, and you trade with continuity and regularity. In the IRS's words, it does not matter whether you call yourself a day trader; if you do not meet those conditions, you are an investor for tax purposes.
- The 475(f) election. A qualifying trader can elect mark-to-market accounting, which turns gains and losses into ordinary income and removes the capital loss limits and wash sale rules. The election is due by the original due date of the prior year's return, and late elections generally are not allowed.
- Futures. Regulated futures contracts fall under Section 1256: gains and losses are treated as 60% long-term and 40% short-term regardless of holding period, open positions are marked to market at year end, and they are reported on Form 6781.
Talk to a tax professional before choosing an approach, because the trader-status test is a facts-and-circumstances judgment.
Related lesson: Slippage explained
Leverage and Margin in Day Trading
Leverage in day trading means controlling more market exposure than the cash in your account, and it works in both directions. How it works depends on the market.
Stock margin and buying power
In a US stock margin account, Regulation T sets initial margin at 50% of the purchase value for marginable equities. Illustrative example: $10,000 of equity can buy up to $20,000 of stock. A 10% drop in that stock is a $2,000 loss, which is 20% of your equity. Brokers can and often do set stricter house requirements, and FINRA's maintenance rules apply on top.
Futures margin and notional exposure
Futures margin is a different idea. The CFTC's glossary states it plainly: "The margin is not partial payment on a purchase. Also called Performance Bond." It is a good-faith deposit that exchanges set and brokers can raise. Leverage comes from the contract size. At an illustrative index level of 7,000, one ES contract controls $350,000 of exposure ($50 per point) and one MES controls $35,000 ($5 per point). A 1% index move at that level is 70 points: $3,500 on one ES and $350 on one MES.
That is why futures day traders size from the stop and the point value, not from the margin figure. The margin is the minimum deposit to open the trade, not a measure of how much you can lose. Exchange and broker margins change with volatility, so check your broker's current numbers rather than any figure you read in an article.
Related lesson: Position sizing futures contracts
Day Trading Rules After the 2026 FINRA Margin Change
Day trading rules for US stock accounts changed in 2026, and many pages still describe the old version. For about a quarter of a century, FINRA Rule 4210 used a day trade count to label some margin customers "pattern day traders" and required them to keep at least $25,000 of equity. That is where the famous $25,000 number came from.
FINRA Regulatory Notice 26-10, published April 20, 2026 after SEC approval, replaces those provisions in their entirety, including the day trade count and the $25,000 minimum. The new intraday margin standards took effect June 4, 2026, and broker-dealers may phase them in until October 20, 2027. During that phase-in your broker may still run the old rules, so ask which regime applies to your account.
How the new intraday margin rule works
The new rule focuses on exposure instead of trade counts:
- A broker determines each margin account's "intraday margin deficit", broadly the largest shortfall between required margin and equity after a trade that reduces your available margin.
- The deficit must be met as promptly as possible. It stays outstanding until satisfied, or until the close of business on the 15th business day after it occurs.
- If you make a practice of not meeting deficits and miss one by the close of the fifth business day, the broker must block new short positions or debit balances for 90 calendar days (or until it is satisfied).
- Small deficits, those no larger than the lesser of 5% of account equity or $1,000, do not count toward "making a practice" of missing them.
Cash accounts and futures accounts
Cash accounts never had the pattern day trader rule, but they have a settlement constraint: most US securities trades settle one business day after the trade (T+1), and buying with unsettled money can trigger restrictions under your broker's policies. Futures were never covered by the pattern day trader rule at all, because futures margin is a performance bond set by the exchanges and brokers, not a securities margin loan under Rule 4210. A futures day trader's constraints come from the contract size, the broker's margin and their own risk limits.
Related lesson: Pattern day trader rule
How Much Money You Need for Day Trading
The money you need for day trading depends less on any legal minimum and more on whether the instrument's normal movement fits inside your account. Dividing a dollar target by the point value shows how much of a session it demands. Using the 49-session ES average range of 62.27 points:
| Daily target | ES points needed | Share of an average ES session | MES points needed | Share of an average session on MES |
|---|---|---|---|---|
| $100 | 2 | 3.2% | 20 | 32.1% |
| $500 | 10 | 16.1% | 100 | 160.6% |
| $1,000 | 20 | 32.1% | 200 | 321.2% |
Minimum account balances for day trading
The legal and broker minimums are only the floor. A US stock margin account needs at least $2,000 of equity under FINRA Rule 4210, and until a broker finishes moving to the 2026 intraday margin standards, a margin account flagged as a pattern day trader may still need $25,000. Cash accounts have no day trading minimum, but each purchase has to be paid for with settled money. Futures brokers set their own account minimums and per-contract day trading margins, and those vary by firm and change with volatility.
The more useful number is risk capital: money you can lose without touching rent, savings or debt payments. Day trading capital should be sized so that a normal losing streak, say ten losses in a row at your planned risk per trade, costs a small and survivable share of it. If ten losses would end the account, the account is too small for the position size, whatever the broker allows.
Is $100 enough for day trading?
Not on a full-size ES contract, where one tick is $12.50, or 12.5% of a $100 account. On one MES contract the average session range is worth $311.35, about 3.1 times a $100 balance, so a single ordinary day can move more than the account holds. At the illustrative $2.75 per MES round turn, $100 pays for about 36 round turns before any trade is right or wrong. A $100 account can learn the mechanics. It cannot absorb normal movement.
What day trading looks like with $1,000
With $1,000, risking 1% per trade means $10, which is 2 MES points (8 ticks). That stop is about 31% of an average 5-minute bar, so it sits deep inside normal noise. Risking 2% buys 4 points, still well under one ordinary bar. The arithmetic pushes a small account toward either very tight stops that get hit by noise or oversized risk per trade. Neither is a plan. The honest answer to "how much can a day trader make with $1,000" is that the account is too small to survive the variance needed to find out.
Related lesson: Maximum risk per trade
Day Trading Risks and Profitability
The research on day trading profitability is bleak, and it is worth reading before any income claim. The most thorough study, "Day Trading for a Living?" by Chague, De-Losso and Giovannetti, followed everyone who started day trading Brazilian equity index futures between 2013 and 2015. Of the 1,551 people who kept at it for more than 300 days, 97% lost money after fees. Only 1.1% earned more than the Brazilian minimum wage, and 0.5% earned more than a bank teller's starting salary. One market and one period, but nothing in it resembles the numbers used to sell courses.
Why most day traders lose
The losses are not random. They follow a few repeatable mechanisms:
- Cost drag. Every round turn pays fees and slippage. A strategy that is slightly positive before costs can be negative after them, especially at high frequency.
- Low base rates. In this guide's 49-session ES test, the long opening range breakout reached its target before its stop in 12 of 32 triggers, so even a standard setup is wrong or unresolved more often than it is right. A trader who expects to win most of the time abandons a workable plan after a normal losing streak.
- Oversizing after losses. Raising size to win back a loss turns one bad day into an account-ending one.
- Exit drift. Taking profits early and holding losers creates small wins and large losses, the opposite of what positive expectancy needs.
- Leverage. Futures and margin magnify every one of the problems above.
Do day traders make good money?
A small minority do, and nobody can tell in advance who they will be. The Chague, De-Losso and Giovannetti study of Brazilian futures day traders says the typical persistent day trader loses money, and the ones who earn a living are rare enough that "average income" is the wrong question. A better question is whether your own measured results, over at least a few hundred trades in a simulator or at small size, show a positive expectancy after realistic costs.
Risk Management Rules for Day Traders
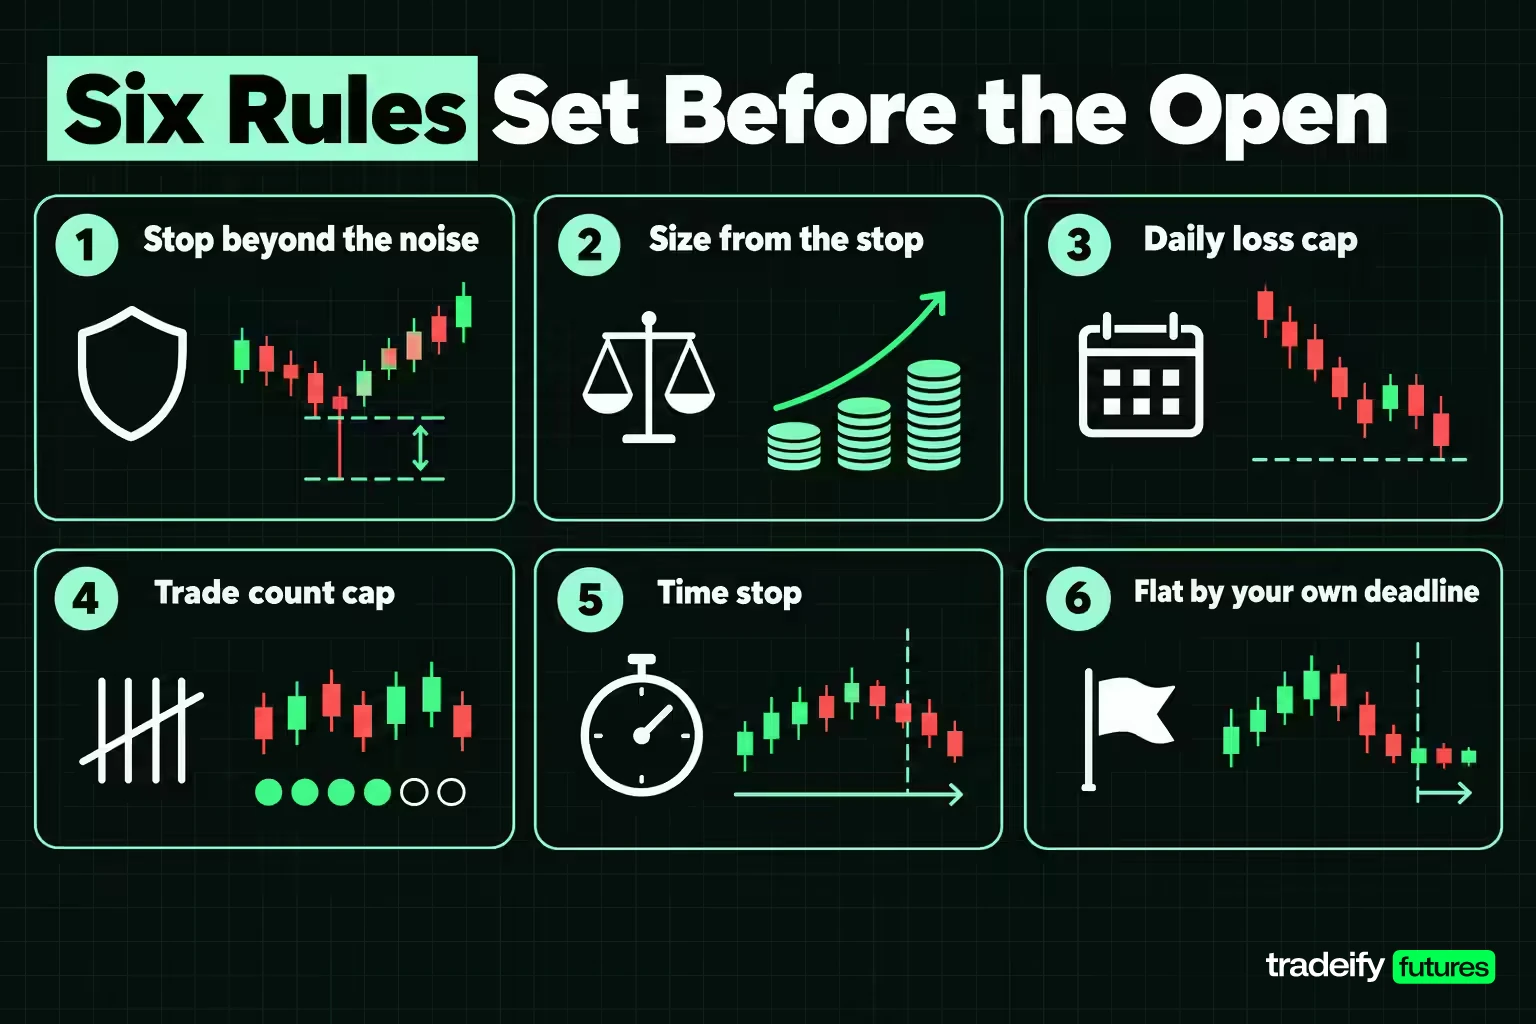
Risk management for day traders is a set of decisions made before the session, when you are calm, that bind you during it. Each rule exists because of a specific failure.
- Stop beyond the noise. Place the stop where the trade idea is proven wrong, not at a round dollar amount. In the 49-session ES measurement the average 5-minute bar ranged 6.38 points, so a stop tighter than one bar is mostly a bet on noise.
- Size from the stop. Contracts or shares = dollar risk ÷ (stop distance × value per point). On MES, a $50 risk with a 5-point stop is 2 contracts (5 × $5 × 2 = $50). If the stop has to widen, the size shrinks.
- Daily loss cap. Set a dollar amount at which you stop for the day. This rule exists for revenge trading, which is almost always where large losses come from.
- Trade count cap. Decide the maximum number of trades before the open. It caps cost drag and the temptation to force setups in quiet hours.
- Time stop. If a trade has not moved toward the target within a set time, exit. A day trade that is not working by mid-session rarely gets more room, because the afternoon tends to move less.
- Flat by your own deadline. Pick a time to be out, rather than letting the close decide for you.
The common thread is precommitment. Each rule is easy to write in the evening and hard to follow at 10:15 AM after two losses, when the next setup looks like the one that gets it all back. That moment is the reason the rules exist, so write them down where you will see them.
Related lesson: Revenge trading
Day Trading Platforms, Brokers and Tools
A day trading platform is where your costs, speed and order control are decided, so compare platforms on the features that change outcomes rather than on the interface.
| Feature | Why it matters for day trading |
|---|---|
| All-in cost per round turn | Commissions, exchange fees and data fees compound with trade count |
| Market data level | Level 1 shows the best bid and offer; Level 2 shows depth behind it, usually as a paid add-on |
| Order types | Stop, stop-limit, bracket and OCO orders let a stop and target exist the moment you enter |
| Server-side orders | Stops held on the broker's or data provider's servers keep working if your connection drops |
| DOM and hotkeys | Fast entry and exit at exact prices without typing |
| Chart replay and simulation | Lets you practice a session clock on historical data before risking money |
| Personal risk limits | Daily loss lockouts and position caps enforce rules you might break under pressure |
The day trading tool stack
Beyond the platform, most day traders need four tools: an economic calendar for scheduled releases, a charting package with the timeframes and VWAP they use, a stock scanner if they trade individual shares, and a trading journal. The journal is the one most people skip and the one that turns a strategy into a measured process.
How to Start Day Trading Step by Step
Starting day trading well is mostly about doing things in the right order, so each step tests the previous one.
- Pick one instrument and one session window. Learn how that window behaves before adding a second market.
- Write the setup: entry trigger, stop location, target or exit rule, size formula and maximum trades per day.
- Measure it. Log at least 30 sessions of the setup in a simulator or chart replay, including costs.
- Trade it in simulation in real time, with the daily loss cap active.
- Move to the smallest real size available (a micro contract or a few shares) only after the simulated results hold up after costs.
- Review weekly. Compare your live results to the simulated base rate, and stop to diagnose if they diverge.
On our accounts at Tradeify, day trading is the only option: every position must be closed by 4:45 PM ET on regular days, and nothing is held overnight or over a weekend. Size is capped by contract limits rather than margin (a 50K account allows up to 4 minis or 40 micros), our Growth evaluation has a daily loss limit that puts the account in liquidation-only mode until the next trading day, and evaluations and funded accounts are simulated.
Day Trading FAQ
Is $100 enough to day trade?
$100 is enough to learn order entry, but not to absorb normal movement. One ES tick is $12.50, and one Micro E-mini's average session range in the 49-session measurement was $311.35, about 3.1 times the account. Practice in a simulator until the account is large enough for a stop outside ordinary noise.
Do day traders make good money?
Most do not. A study by Chague, De-Losso and Giovannetti of 1,551 people who day traded Brazilian equity index futures for more than 300 days found that 97% lost money after fees. A small minority earn a living, which is why measured results matter more than income claims.
How much can a day trader make with $1000?
No one can give a reliable figure, and a $1,000 account is usually too small to find out. On one Micro E-mini, $1,000 a day would need 200 points, more than three times the average measured session range of 62.27 points. Risking 1% of $1,000 allows a 2-point stop, which sits inside about a third of one ordinary 5-minute bar.
Why is $25,000 required to day trade?
It came from FINRA's pattern day trader rule for US stock margin accounts. FINRA Regulatory Notice 26-10 replaces that rule, including the $25,000 minimum, effective June 4, 2026, with brokers allowed to phase in the change until October 20, 2027. Futures were never subject to it.
What is the best time of day for day trading?
For E-mini S&P 500 futures, the first hour after the 9:30 AM ET open usually carries the most movement. In this guide's 49 measured ES sessions, the first 30 minutes printed 41.1% of the day's range and 79.2% was printed by noon. The early afternoon was the quietest stretch.
Is day trading gambling?
It is gambling when the outcome cannot be described in advance. If you can state the entry, stop, size, cost and base rate before the trade, you are running a process with a known distribution of outcomes, even an unfavorable one. If any of those is missing, the trade is a bet on a feeling.
Day trading futures, stocks and other leveraged products carries a substantial risk of loss, and losses can exceed what you expect or deposit. The session measurements here describe past price behavior of one instrument over a short sample, and the cost figures are illustrative assumptions; neither predicts future results. Simulated, evaluation and funded accounts are simulated and do not reflect real fills or real pressure. Nothing here is investment, tax or legal advice.


