



TL;DR: The flags and pennants pattern is a fast move, a short pause and a same-direction break; the pole decides if it is worth trading. A flag pauses between parallel lines, a pennant between converging lines, and both should finish inside about three weeks. On Bulkowski's daily stock data, flags reach their target 46% of the time and pennants 35% or less. Entry timing and stop placement change the required win rate more than the shape does.
The flags and pennants pattern looks obvious on a finished chart. Price runs hard, stalls in a small box or triangle, then runs again. On a live chart it is a lot less obvious. You have to decide whether the stall is a pause or the start of a reversal, where the stop goes, and how far the next leg can realistically travel, all before the break.
This guide works through each of those decisions with published identification rules, published success rates and priced examples on index futures. Every price level in the worked examples is illustrative.
What the Flags and Pennants Pattern Is
A flag or pennant is a short-term continuation pattern: a small consolidation that sits between two legs of the same move. StockCharts describes it as a pause that usually follows a sharp advance or decline on heavy volume and marks the midpoint of the move. Bulkowski is blunter: if there is no straight-line run into the pause, there is no flag.
Every valid flag or pennant has three parts.
- The pole. A steep, fast move that lasts several bars. It should break a trendline or a support or resistance level on the way.
- The pause. A brief consolidation. In a flag, price moves between two parallel or near-parallel trendlines. In a pennant, the trendlines converge like a small symmetrical triangle.
- The break. Price leaves the pause in the direction of the pole. A bullish flag or pennant confirms on a break above resistance, a bearish one on a break below support.
The shape itself has no direction. The pole gives it one. A pause after a sharp rally is a bull flag or bull pennant, and the same shape after a sharp drop is a bear flag or bear pennant.
To identify a flags and pennants pattern on a live chart, check the parts in order: is there a real pole, does the pause stay small and short, and has price actually closed outside the pause? Bulkowski's guidelines put both shapes at less than three weeks long. A pause that runs longer is reclassified: a long flag becomes a rectangle or channel, and a long pennant becomes a symmetrical triangle or a wedge.
Related lesson: Market structure
Flagpole Anatomy in a Flag or Pennant
Most traders stare at the consolidation. The flagpole is the part that actually decides whether a flag or pennant setup has any edge. TradingSim's guide puts it plainly: if the pole is weak, the pattern is not tradeable no matter how clean the consolidation looks.
StockCharts measures the flagpole from the first resistance or support break to the high or low of the flag or pennant. Bulkowski says the pole should be unusually steep and last several days on a daily chart, and that the best performing flags have a long, near vertical flagpole.
TradingSim turns that into three measurable screens for a tradeable pole:
- It covers at least four times the average true range (ATR) of the prior fifteen bars.
- Volume rises into the move.
- The pole closes in the top quarter of its range on a rally (the bottom quarter on a decline).
Here is how those screens read on an illustrative E-mini S&P 500 (ES) pole. ES is $50 times the S&P 500 Index, with a minimum tick of 0.25 index points worth $12.50.
| Pole screen | Illustrative ES reading | Result |
|---|---|---|
| Pole height | 6400.00 to 6500.00, so 100.00 points, 400 ticks or $5,000.00 per contract | Measured |
| Height versus ATR | 100.00 points against an 18.00 point ATR is 5.56 times | Pass, above 4 times |
| Final pole bar close | Bar from 6492.00 to 6501.00 closes at 6500.00, at 88.89% of its range | Pass, above 75% |
| Volume | Rising through the move | Pass |
A pole that fails these screens does not make the chart wrong. It changes what the pause means. A stair-stepped climb with overlapping bars has already spent its energy in small pieces. TradingSim lists that stair-step pole as one of the three common ways flags fail.
Related lesson: Average true range
Flag vs Pennant Differences
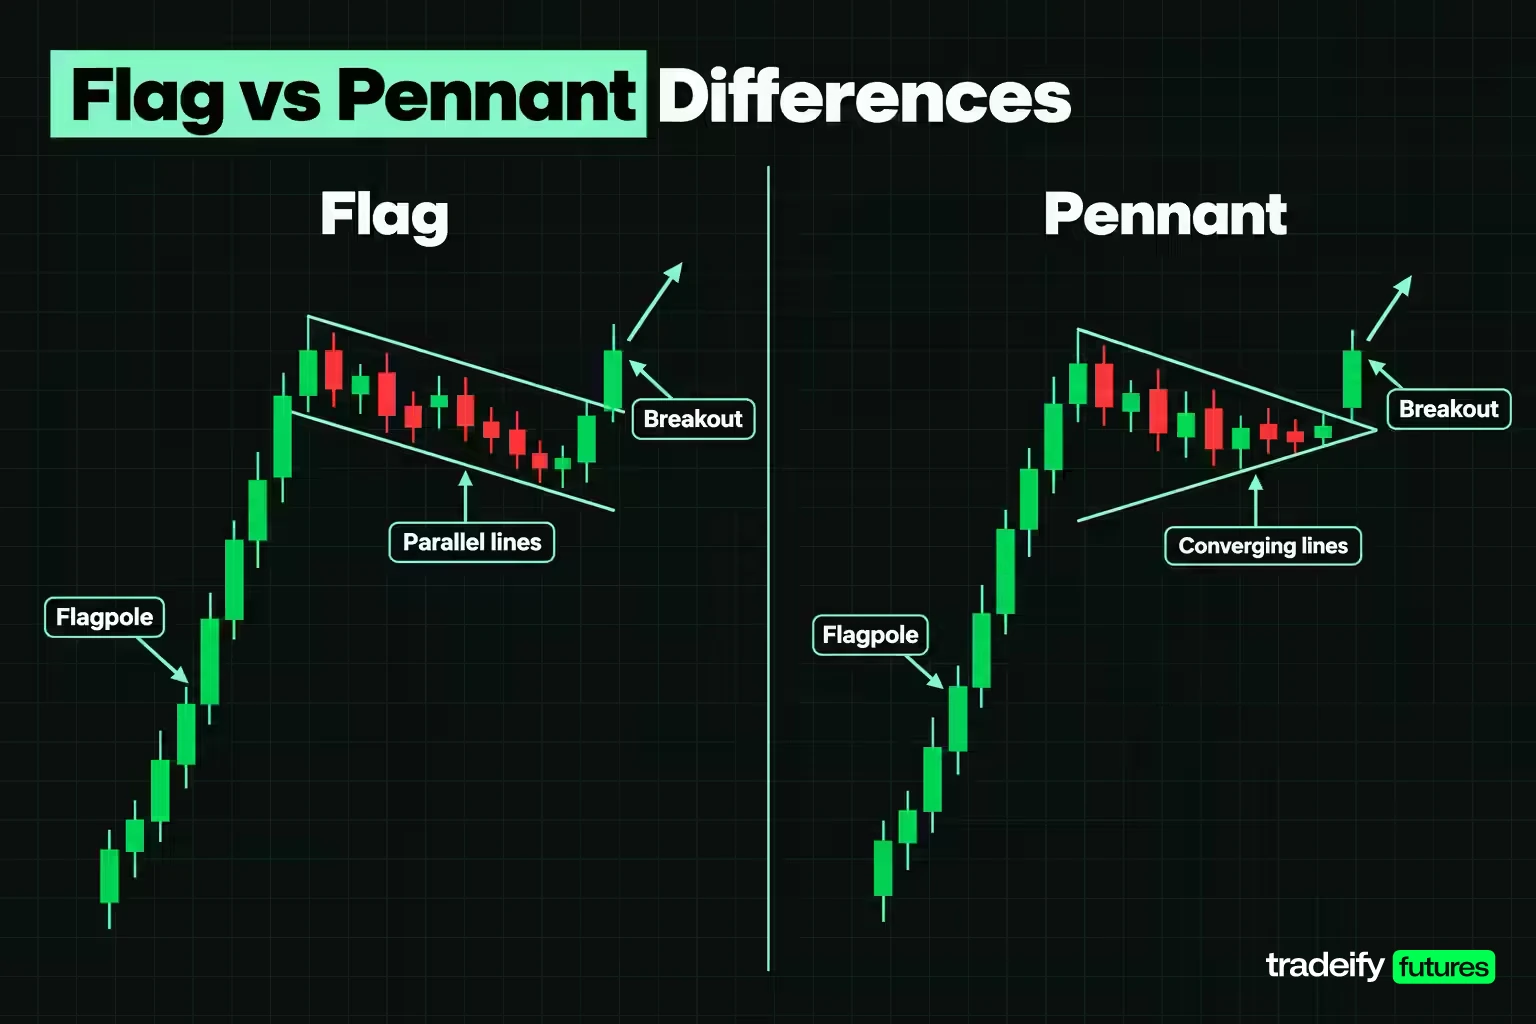
The only structural difference between a flag and a pennant is the trendlines. Flag trendlines run parallel. Pennant trendlines converge. Everything else, from the stop distance to the speed of the break, follows from that geometry.
| Feature | Flag | Pennant |
|---|---|---|
| Pause shape | Small rectangle, often tilted against the trend | Short symmetrical triangle |
| Trendlines | Parallel or near parallel | Converging |
| Typical slope | Against the prior trend | Roughly neutral |
| Duration on Bulkowski's rule | Less than 3 weeks | 3 weeks long or less |
| Intraday bar count per TradingSim | 5 to 15 bars | 5 to 10 bars |
| Volume during the pause per Bulkowski | Downward 74% to 77% of the time | Downward 86% of the time |
| Stop distance at the break | Wider, because the box keeps its width | Tighter, because the triangle narrows |
Of all those rows, the stop row is the one that changes your trade. A flag holds its width for the whole pause, so the far side of the pattern stays the same distance from the breakout line. A pennant narrows, so by the time price breaks, the far side is close. That tighter stop sounds like a gift. It is also closer to normal noise, and on Bulkowski's data pennants reach their target less often than flags do.
Related lesson: Trendlines and channels
How a Pennant Differs From a Wedge or Symmetrical Triangle
A pennant, a wedge and a symmetrical triangle all have converging trendlines, so the shape alone will not separate them. Duration and slope do.
- Pennant versus symmetrical triangle. StockCharts notes that a symmetrical triangle under three weeks is usually considered a pennant, and that a typical symmetrical triangle lasts about three months. A pennant also needs a pole. A symmetrical triangle can form without one.
- Pennant versus wedge. In a wedge, both trendlines slope the same way. Bulkowski describes a rising wedge as two up-sloping, converging trendlines with a minimum duration of 3 weeks; anything shorter is a pennant. A wedge also needs more touches, at least five in total on Bulkowski's guidelines.
The practical test is quick. Short, after a pole, roughly neutral slope: pennant. Longer than three weeks, no pole: triangle or wedge, with its own statistics.
Related lesson: Wedges
The Bullish Pennant and Bull Flag Pattern
A bullish pennant forms when price rallies hard, pauses in a small converging triangle, and then breaks out higher. A bull flag is the same sequence with a parallel channel, usually drifting slightly downward, in place of the triangle. Both say the same thing: buyers paused, sellers could not push price back far, and the rally resumed.
Bulkowski's notes add detail that separates good bullish flags and pennants from poor ones:
- Tilt against the trend helps. The best flag performance comes when an upward trend leads to a flag that tilts downward. Pennant performance suffers when the pennant slopes in the direction of the trend.
- Tight beats loose. A loose pattern is one where price meanders, pokes outside the trendlines, leaves white space or looks jagged. Tight flags and tight pennants perform better.
- Flat base. A flag or pennant above a flat base on an upward breakout tends to produce a large move.
- Breakout direction leans up, slightly. Flags break upward 60% of the time and pennants 57% of the time in Bulkowski's sample, which is a mild lean, not a rule.
The decision on a bullish pennant is not "is this bullish?" The pole already answered that. The decision is whether the pause is tight, short and shallow enough to treat as a pause. If price gives back a large share of the pole, the buyers did not just pause. They lost control for a while.
The Bearish Pennant and Bear Flag Pattern
A bearish pennant forms after a sharp decline, when price pauses in a small converging triangle before breaking lower. A bear flag uses a parallel channel that usually drifts upward against the decline. The structure mirrors the bullish version, and Bulkowski's numbers for down breakouts are close to the up-breakout figures for flags: a 45% break even failure rate and 46% meeting the price target. For pennants with down breakouts, 54% fail to move 5% and 32% reach the target.
Here is a priced bear flag on the Micro E-mini Nasdaq-100 (MNQ), which is $2 times the Nasdaq-100 Index with a minimum tick of 0.25 index points worth $0.50. All prices are illustrative.
- Pole. Price falls from 25400.00 to 25200.00, a 200.00 point pole, 800 ticks or $400.00 per contract.
- Flag. A rising channel tops out at 25218.00, a giveback of 18.00 points or 9.00% of the pole.
- Entry. A sell stop one tick under the lower trendline at 25205.75.
- Stop. One tick above the flag high at 25218.25, so 50 ticks or $25.00 of risk per MNQ.
- Target. Bulkowski's rule subtracts 46% of the pole (92.00 points) from the top of the flag, which gives 25126.00. That is 319 ticks or $159.50 of reward.
That works out to a reward to risk ratio of 6.38 and a break-even win rate of 13.55%. The ratio looks generous because this flag is narrow relative to its pole. A wider bear flag would raise the risk and lower the ratio quickly, which is why you measure each pause rather than assuming a ratio.
How a bearish pennant behaves
A bearish pennant is the triangle version of the same idea: a sharp drop, then a short pause between converging trendlines, then a break below the lower line. Bulkowski's down-breakout numbers for pennants are weaker than for flags. 54% fail to fall at least 5%, the average decline is 6%, and 32% reach the target, which is 32% of the pole subtracted from the top of the pennant.
Two details from his notes matter for bearish pennants:
- Location. Pennants perform best within a third of the yearly low, for downward breakouts only.
- Tilt. Performance suffers when the pennant slopes in the direction of the trend, so a bearish pennant that drifts lower as it forms is the weaker version.
TradingSim's ARWR example shows the trade mechanics. The pennant broke down right after lunch, and the setup shorted the break of the pennant trendline with a stop above the middle of the upper trendline, to allow for a quick fake-out. A bearish pennant stop that sits right at the upper line is exposed to that kind of snap back.
Why the Flag Pause Forms
The pause in a flag or pennant usually reflects a handoff between two groups. Traders who caught the pole take some profit, which slows price. Traders who missed the move wait for a better price instead of chasing, so they absorb that selling without letting price fall far. StockCharts calls the flag or pennant merely a pause in a move that often represents the first leg of a larger advance or decline.
That is an interpretation, not a law. It explains why a shallow, quiet pause is the healthy version: early buyers are trimming, not exiting. A deep, noisy pause suggests something else is going on, such as sellers with real size stepping in. Bulkowski's own data on pennants is a useful check on the idea. He calls pennants the workhorses of the day trader because they can mark the midway point in a move, but adds that they only work that way about 30% of the time.
Volume in a Flag or Pennant
Volume in a flag or pennant follows a three-part sequence on the textbook chart: heavy on the pole, lighter in the pause, expanding on the break. StockCharts says heavy volume on the pole legitimizes the sharp move, and that expanding volume on the breakout lends credence to the pattern.
Bulkowski's sample shows how often the middle step actually appears. Volume trends downward during flags 74% of the time with up breakouts and 77% with down breakouts. For pennants it trends downward 86% of the time. So contracting volume is common, but roughly one flag in four does not show it.
TradingSim puts numbers on the breakout step: typical breakout volume of 1.5 to 2 times average for flags and 2 to 3 times average for pennants, and it treats a break on less than 1.5 times average volume as a likely fake-out. Treat those as one vendor's working thresholds rather than published research.
A real example shows why volume is a vote, not a verdict. In StockCharts' HPQ flag, the first break above the upper trendline came on June 21 without volume expansion. The stock then gapped up a week later and closed strong on above-average volume. A trader who required volume on the first break would have waited. A trader who ignored volume would have been in early and had to sit through a week of drift. Neither choice was wrong; they were different trades.
Related lesson: What is volume
Flag and Pennant Success Rates
The best-known published statistics for flags and pennants come from Thomas Bulkowski, based on daily stock data in bull markets, statistics updated 8/27/2020. Flags are based on hundreds of perfect trades and pennants on more than 1,600.
| Bulkowski statistic | Flags | Pennants |
|---|---|---|
| Break even failure rate, up and down breakouts | 44% and 45% | 54% and 54% |
| Average rise and decline after the breakout | 9% and 8% | 7% and 6% |
| Meeting the price target, up and down breakouts | 46% and 46% | 35% and 32% |
| Breakout direction | Upward 60% of the time | Upward 57% of the time |
Bulkowski defines the break even failure rate as the share of patterns that fail to rise or decline by at least 5% after the breakout. He also notes that results for both patterns are based on the short-term price swing, which is why the average moves are small.
Three conclusions follow from the table:
- Flags beat pennants on every row. The pennant's tighter stop is the main reason to take one anyway.
- Both miss the target more often than they hit it. On these numbers, your entry price and stop decide much of the outcome.
- Pennants rarely mark the true midpoint. Bulkowski's half-staff data shows the move after a pennant is equal to or longer than the move into it just 30% of the time. On average the trend runs 11 days and rises 19% into the pennant, then 10 days and 14% after it.
A related pattern, the high and tight flag, has very different numbers because its entry condition is stricter. Price must rise at least 90% in 2 months or less before the pause. On that pattern Bulkowski reports a 15% break even failure rate, a 39% average rise and 82% meeting a half-height target, based on 1,028 perfect trades. That is a reminder that a stronger pole screen can change the statistics more than any detail of the pause.
These are stock samples. They are useful base rates for futures traders, but they are not a forecast for ES or NQ on a five-minute chart.
Flag and Pennant Entry Strategies
There are four common ways to enter a flag or pennant, and on the same chart they produce four different trades. The illustrative ES bull flag used here has a pole from 6400.00 to 6500.00 and a descending channel whose low is 6478.00. The stop sits one tick under that low at 6477.75. ES ticks are 0.25 points worth $12.50. The target is Bulkowski's percentage rule: 46% of the 100.00 point pole added to the bottom of the flag, which gives 6524.00.
- Break stop. A buy stop one tick above the upper trendline, at 6494.25. TradingSim calls this its primary entry because you only enter on the break itself.
- Close confirmation. Wait for a bar to close above the trendline and buy that close, here 6499.00. It filters some false breaks and costs a worse price.
- Retest. After the close confirmation, buy a pullback to the broken line with a limit order at 6494.00. It gives the best price, and it does not always arrive.
- Chase. Buy the close of a large breakout bar 12.00 points above the line, at 6506.00. Nobody plans this entry. It happens when the break-stop was not placed.
| Entry route | Entry price | Risk to 6477.75 | Reward to 6524.00 | Reward to risk | Break-even win rate |
|---|---|---|---|---|---|
| Break stop | 6494.25 | 66 ticks, $825.00 | 119 ticks, $1,487.50 | 1.80 | 35.68% |
| Close confirmation | 6499.00 | 85 ticks, $1,062.50 | 100 ticks, $1,250.00 | 1.18 | 45.95% |
| Retest limit | 6494.00 | 65 ticks, $812.50 | 120 ticks, $1,500.00 | 1.85 | 35.14% |
| Chase | 6506.00 | 113 ticks, $1,412.50 | 72 ticks, $900.00 | 0.64 | 61.08% |
Comparing flag entries with the break-even win rate
The break-even win rate on a flag entry is risk divided by risk plus reward. In the illustrative ES table, put it next to Bulkowski's 46% target-hit rate for flags. The break stop and the retest need about 35% and leave some room. The close confirmation needs 45.95%, which is right at the published rate. The chase needs 61.08%, far above it.
Here is the important part. Waiting for confirmation feels safer, and on this geometry it moves the trade from workable to marginal. Chasing turns it negative on the published base rate. If you missed the break, the next price is not a better entry. It is a different trade, and usually a worse one.
Slippage moves these numbers further. One tick of slippage on the entry and one on the stop takes the break-stop route to 68 ticks of risk and a 36.56% break-even rate, and the close confirmation to 87 ticks and 46.77%.
Related lesson: Breakout trading
Flag and Pennant Stop-Loss Placement
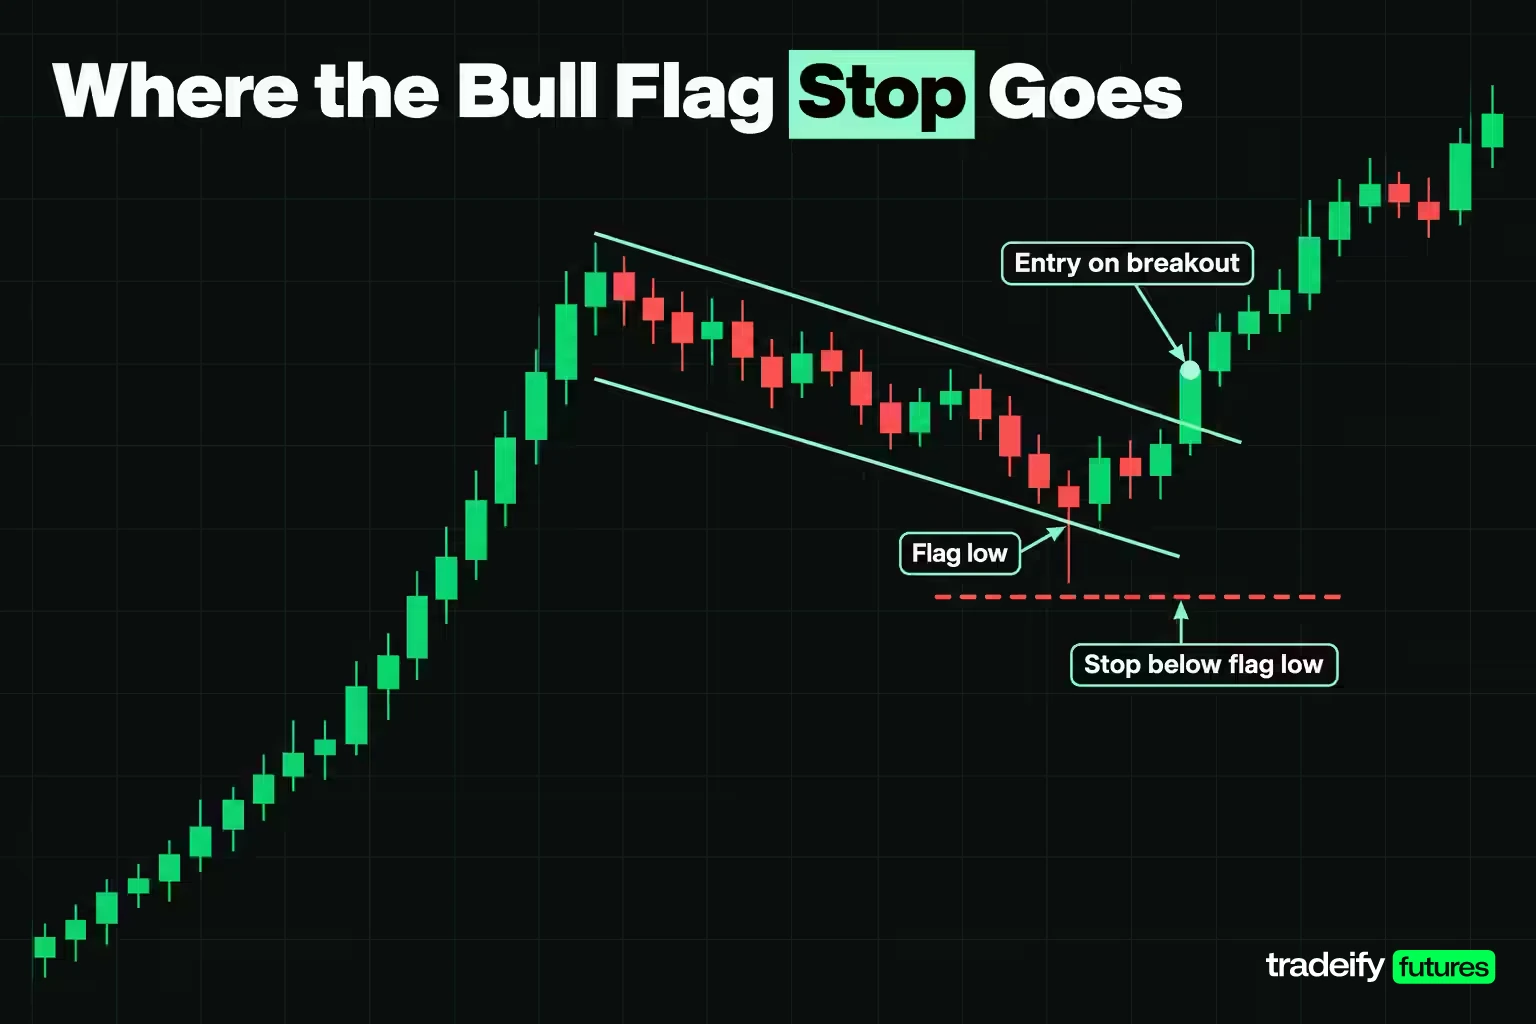
A flag or pennant stop belongs where the pattern is proven wrong, which is outside the pause, not just under the breakout line. The common conventions:
- Bull flag. One tick below the lowest low of the consolidation (one tick above the highest high for a bear flag). This is TradingSim's rule for flags, and it uses the far side of the pattern.
- Pennant, tight version. TradingSim places it one tick below the lower converging trendline at the moment of the break.
- Pennant, wide version. One tick below the pennant's lowest point, the same logic as the flag.
- Sloppiness limit. TradingSim says that if either stop is more than 1.5 times ATR away, the setup is too sloppy to trade.
On the illustrative ES bull flag (pole 6400.00 to 6500.00, flag low 6478.00, 18.00 point ATR), the stop at 6477.75 is 16.50 points from a 6494.25 entry. The 1.5 times ATR limit is 27.00 points, so the setup passes.
Pennant stop placement on the same pole
Now take a pennant on an illustrative 100.00 point ES pole from 6400.00 to 6500.00. Its triangle starts between 6500.00 and 6484.00 and narrows. Price breaks out three quarters of the way to the apex, when the upper line is at 6494.00 and the lower line is at 6490.00, so the entry is 6494.25. StockCharts puts the ideal symmetrical triangle break between 1/2 and 3/4 of the way to the apex. The Bulkowski-style target adds 35% of the pole to the pennant bottom: 6484.00 plus 35.00 points is 6519.00.
| Pennant stop choice | Stop price | Risk | Reward to 6519.00 | Reward to risk | Break-even win rate |
|---|---|---|---|---|---|
| Lower trendline at the break | 6489.75 | 18 ticks, $225.00 | 99 ticks, $1,237.50 | 5.50 | 15.38% |
| Below the pennant low | 6483.75 | 42 ticks, $525.00 | 99 ticks, $1,237.50 | 2.36 | 29.79% |
The tight stop looks far better on paper. The catch is that an 18 tick stop sits inside the range the pennant itself traded a few bars earlier, so ordinary noise can reach it. The wide stop needs 29.79% against Bulkowski's 35% up-breakout target rate for pennants. That is less room than the flag had.
One more trap is a stop placed a few ticks under the broken line to keep the dollar loss small. Four ES ticks is $50.00. If you lose two ticks to slippage on the way in and out, that cost is 50.00% of the planned risk, and the stop is sitting inside the pattern's normal movement.
Related lesson: Stop-loss placement
Flags and Pennants Pattern Price Targets
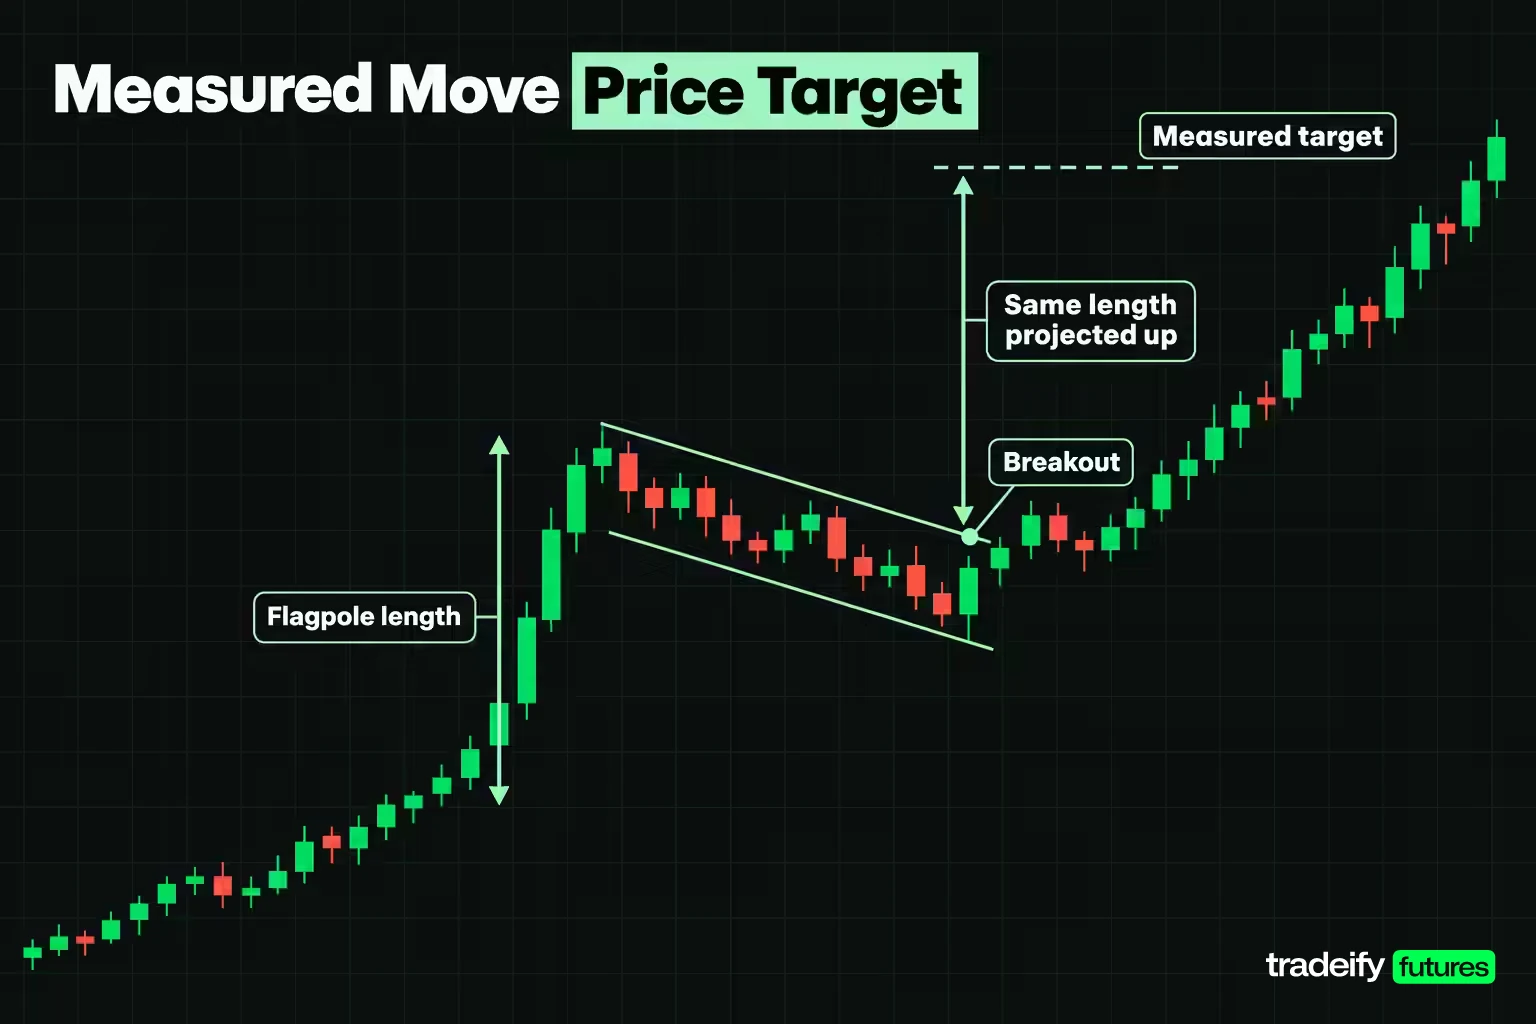
There are three ways to set a target on the flags and pennants pattern, and they can be far apart on the same chart.
The classic measured move
StockCharts applies the flagpole length to the breakout point. Its HPQ example had a 10 point flagpole from $28 to $38, applied to a breakout at $36 for a target of $46. TradingSim's guide uses the same full-pole projection. On the illustrative ES flag, a 100.00 point pole projected from a break at 6494.00 gives 6594.00. From a 6494.25 break-stop entry with a 6477.75 stop, that is 399 ticks or $4,987.50 of reward, a 6.05 reward to risk ratio and a 14.19% break-even win rate.
Bulkowski's percentage rule
Bulkowski computes the pole height, multiplies it by the pattern's percentage meeting price target, and adds it to the bottom of the flag on an up breakout (subtracts it from the top on a down breakout). For flags that percentage is 46%. On an illustrative ES flag with a 100.00 point pole and a 6478.00 flag low, 46% of the pole is 46.00 points, so the target is 6524.00. From a 6494.25 break-stop entry with a 6477.75 stop, that is 119 ticks of reward and a 35.68% break-even win rate. For pennants he uses 35% on up breakouts and 32% on down breakouts.
The two methods describe different things. The full projection is the classic textbook objective. The percentage rule is a closer target that price reached in about half of Bulkowski's flags. A practical approach is to plan exits around the closer target and treat the full projection as the outer edge.
Fibonacci-based projections
Some traders also use Fibonacci ratios, which StockCharts traces to the Fibonacci sequence, with 1.618 known as the Golden Ratio. The same StockCharts page calls a 23.6% retracement relatively shallow and appropriate for flags or short pullbacks, so the ratios are more useful for judging the pause than for setting the target. If you use a Fibonacci extension as a target, treat it as a reference level, not a statistic. No published flag sample tells you how often it is reached.
Related lesson: Fibonacci retracements and extensions
Flag and Pennant Trading Rules
A flag or pennant trading plan should be fixed before the break, because the break is the moment you are least objective. These entry and exit rules for flags and pennants combine Bulkowski's duration rule with TradingSim's pole, stop and exit rules.
- Screen the pole. At least four times the ATR of the prior fifteen bars, rising volume, final bar closing in the top quarter of its range (bottom quarter for a decline).
- Measure the pause. Giveback under 23.6% of the pole, trendlines that contain price, and a duration under 3 weeks on a daily chart or within about 15 bars intraday.
- Pick the entry route in advance. Break stop, close confirmation or retest. Decide the maximum distance from the line at which you will still enter, so a missed break does not become a chase.
- Set the stop outside the pause. One tick beyond the far side of the pattern, or the lower pennant line if you accept a tight stop. Skip the trade if the stop is more than 1.5 times ATR.
- Set two targets. A near target on Bulkowski's percentage rule and an outer target on the full pole.
- Size from the stop. Contracts equal your risk budget divided by the stop's dollar risk per contract, rounded down.
- Manage the exit. TradingSim's version scales half off at 1R and trails the rest using a 2-bar low on longs, and exits into the target if the measured move completes in one impulse.
- Exit on invalidation. A close back inside the pause and through its far side ends the trade, whatever the stop says.
None of these rules makes the pattern win more often. They keep each loss the size you planned, and they stop a correct read from turning into a bad entry.
Flag and Pennant Examples
Published chart examples show what flags and pennants look like when they resolve, and the priced examples show what the same shapes mean in contracts and dollars.
Published flag and pennant chart examples
- HPQ bull flag (StockCharts). After three months of consolidation, HPQ broke above resistance at $28 on expanding volume and ran to $38 in four weeks. The flag then formed over 23 days between two parallel, downward-sloping trendlines. The first break of the upper line came on June 21 without volume expansion, and the stock gapped up a week later on above-average volume. The 10 point pole applied to the $36 breakout projected $46.
- RUSS bull flag (TradingSim). On a 5-minute chart, the stock made an impulsive move higher and then moved sideways for a few hours without breaking the 23.6% retracement line before resuming higher. The setup was a buy on a break of the range high with a stop below the range low.
- ARWR bearish pennant (TradingSim). An intraday pennant broke down right after lunch, and the setup was a short on the break of the pennant trendline with the stop above the middle of the upper line.
- EGN gap through a flag (TradingSim). The stock stair-stepped higher across several days, formed a flag late in the session, and gapped through it at the open on 6/11, showing how a daily-chart flag and an intraday entry can meet.
A priced bull flag on the E-mini S&P 500
This ES example is illustrative. The pole runs from 6400.00 to 6500.00: 100.00 points, 400 ticks or $5,000.00 per contract. It is 5.56 times an 18.00 point ATR, and the final pole bar closes at 88.89% of its range.
The flag is a descending channel. The upper line falls from 6500.00 to 6494.00 and the lower line from 6484.00 to 6478.00, so the channel is 16.00 points (64 ticks) wide and lasts twelve bars. The pause low of 6478.00 is a 22.00 point giveback, which is 22.00% of the pole. The 23.6% limit allows 23.60 points, or $1,180.00 of movement per ES contract.
A break-stop entry at 6494.25 with a stop at 6477.75 risks 66 ticks or $825.00. The near target of 6524.00 offers $1,487.50, and the full-pole target of 6594.00 offers $4,987.50. On the near target, the trade needs a 35.68% win rate to break even.
Sizing the same flag with micro contracts
The Micro E-mini S&P 500 (MES) is $5 times the index, so its tick of 0.25 points is worth $1.25 and the same 66 tick stop costs $82.50. Position size follows from the stop, not the pattern.
| Risk budget | ES contracts | MES contracts | MES risk used | MES contracts if you chase |
|---|---|---|---|---|
| $500.00 | 0 | 6 | $495.00 | 3 |
| $1,000.00 | 1 | 12 | $990.00 | 7 |
A $500.00 budget cannot take a single ES contract on this stop, because one contract risks $825.00. It can take six MES contracts for $495.00. The chased entry at 6506.00 risks 113 ticks, or $141.25 per MES, so the same $500.00 budget drops to three contracts. On a $50,000 account, one ES contract on this stop risks 1.65% of the account and six MES contracts risk 0.99%.
Futures are leveraged, which is why a few points of stop distance turn into account risk this quickly.
Related lesson: Position sizing
When a Flag or Pennant Is Invalid
A flag or pennant is invalid when the conditions that made it a pause stop being true. These are the signals to stand aside or exit:
- The pause runs too long. Bulkowski says flags and pennants are less than 3 weeks long, and longer patterns are rectangles, channels, symmetrical triangles or wedges. StockCharts allows one to 12 weeks but calls one to four weeks ideal and the eight to 12 week band debatable. Intraday, TradingSim says a consolidation past fifteen bars indicates genuine supply or demand rather than a pause.
- The giveback is too deep. TradingSim's screen is a retracement under 23.6% of the pole. A flag that retraces much more is acting like a correction.
- The break fails. Price breaks out, then closes back inside the pause and through its far side. The continuation read is wrong.
- The stop is too far. If the far side of the pattern is more than 1.5 times ATR away, TradingSim treats the setup as too sloppy.
- The break has no volume. TradingSim treats a break on less than 1.5 times average volume as a likely fake-out. Use it to tighten or exit, not as the only signal.
- The pole was not a pole. A stair-stepped move rather than an impulse.
On the illustrative ES flag with a 100.00 point pole, the 23.6% line sits 23.60 points below the 6500.00 top, at 6476.40. A pause that trades below that level has given back more than the screen allows, even if the channel still looks neat.
Common Flag and Pennant Mistakes
Most flag and pennant losses come from a short list of avoidable mistakes. The costs use the illustrative ES bull flag (pole 6400.00 to 6500.00, flag low 6478.00, break-stop entry 6494.25, stop 6477.75, near target 6524.00).
| Mistake | What it looks like | What it costs | Correction |
|---|---|---|---|
| Trading a weak pole | Pole under 4 times ATR or a stair-step climb | The break has little behind it and drifts | Screen the pole before drawing the pause |
| Entering inside the pause | Buying before the break on a hunch | Exposed to both directions with no confirmation | Wait for the break, then use a preset route |
| Chasing the breakout bar | Buying 12.00 points above the line at 6506.00 | Risk rises to 113 ticks and the break-even rate to 61.08% | Set a maximum entry distance in advance |
| Waiting for confirmation by default | Buying the first close above the line at 6499.00 | Break-even rate rises to 45.95% against Bulkowski's 46% hit rate | Choose break stop or retest when the pause is wide |
| Stop inside the pattern | Stop four ticks under the broken line | Two ticks of slippage is 50.00% of a $50.00 stop | Put the stop outside the pause and size down |
| Ignoring duration | A flag that runs past 3 weeks or 15 bars | It is now a rectangle or triangle with different odds | Reclassify or skip |
| Full-pole target only | Holding every trade for 6594.00 | Most trades miss it on the published rates | Plan around the percentage-rule target first |
| Treating stock statistics as futures odds | Assuming Bulkowski's 46% on a 5-minute NQ chart | Overconfidence in a base rate from another market | Track your own sample |
The mistake underneath most of these is deciding during the break instead of before it. If you know the plan before the break, the break does not rush you. Write the entry route, stop and targets down while the pause is still forming.
Best Timeframes for Flags and Pennants
Flags and pennants appear on every timeframe, but the rules have to be restated in bars when you move intraday. Bulkowski's rules are written for daily stock charts, where a flag lasts under 3 weeks. Intraday, TradingSim uses 5 to 15 bars for flags and 5 to 10 bars for pennants.
TradingSim's own timeframe views, which are one vendor's experience rather than research:
- 1-minute chart. Useful only for scalps during the first 30 minutes.
- 5-minute chart. Its main intraday timeframe for liquid large-caps and index ETFs.
- 15-minute chart. Its preferred timeframe for ES or NQ continuation setups.
- Daily chart. Flags become multi-session swing setups.
Two things change as the timeframe shrinks. Execution cost becomes a bigger share of the risk, because a two-tick slip matters more against a 20 tick stop than a 200 tick one. And the published statistics apply less directly, because they were measured on daily stock data. A practical approach is to identify the bias on a higher timeframe and take the flag on the lower one.
Session limits on an intraday flag trade
On our accounts, every position must be closed by 4:45 PM ET on regular trading days, and overnight or swing holds are not allowed. So a daily-chart flag can shape your bias, but the trade itself has to be planned and finished inside one session. Size it within your account's contract limit (a 50K account allows 4 minis or 40 micros, and 10 micros count as one mini), and remember that funded accounts are simulated. If you use WealthCharts, its Chart Replay lets you practice marking flags and pennants on historical data.
Related lesson: Multiple-timeframe analysis
Flags and Pennants FAQ
Is a pennant bullish or bearish?
A pennant can be either. It takes its direction from the pole, so a pennant after a sharp rally is bullish and one after a sharp decline is bearish. In Bulkowski's sample, pennants broke upward 57% of the time, which is only a slight lean.
How long should a flag last?
Bulkowski says less than 3 weeks on a daily chart, and StockCharts calls one to four weeks ideal. On intraday charts, TradingSim uses 5 to 15 bars. A pause that runs much longer is usually a rectangle, channel or triangle instead.
What is a high and tight flag?
A high and tight flag is a flag that follows a rise of at least 90% in 2 months or less. Bulkowski reports 82% of them meeting a half-height target in his stock sample. He recommends buying only on a close above the highest peak in the pattern.
What is the three flag pattern?
The three flag pattern usually means three flags in a row along one trend, each with its own pole and pause. The term has no single accepted definition. Treat each flag as its own setup with its own screens and stop.
Are flag patterns reliable?
They are useful but far from certain. Bulkowski's flags reached their target 46% of the time, and pennants 35% on up breakouts. Entry and stop choices decide whether that rate is enough.
Flags and Pennants Trading Risk
This article is education, not investment advice or a recommendation to trade any instrument. Futures are leveraged, and losses can be larger than you expect; a stop order does not guarantee your exit price in a fast market. Every price, risk budget and position size here is illustrative, not a record of a real trade or a promise of any result. Published pattern statistics come from historical stock samples and may not carry over to the market or timeframe you trade. Simulated and funded account results are simulated and do not reflect live trading conditions.


