



TL;DR: Engulfing candlestick patterns are two-bar reversals where the second body covers the first, and the key decision is where your stop goes. In Bulkowski's tests, bearish engulfing reversed 79% of the time and bullish 63%, yet they rank 91st and 84th of 103 on follow-through. Confirmation can cost more than it saves, so price every entry and stop before you size the trade.
What Engulfing Candlestick Patterns Are
Engulfing candlestick patterns are two-candle reversal signals. The first candle has a small real body. The second candle points the other way, and its real body fully covers the first one.
They are also the bars that make traders want to act right now. A big green candle swallows the last red one after a selloff, and it feels like the turn has arrived. Knowing exactly what that bar claims, and what it does not, is what keeps the feeling from making the decision.
The real body is the box between the open and the close. The thin lines above and below it are shadows, or wicks, and they mark the high and the low. The standard definition looks only at the bodies. TradingView's Help Center says it plainly for the bullish version: the second candle does not need to cover the full high-to-low range, only the open and the close.
There are two types, and the color sequence tells you which one you have:
- Bullish engulfing pattern. A red (down) candle followed by a larger green (up) candle whose body covers the red body. It is expected after a decline.
- Bearish engulfing pattern. A green candle followed by a larger red candle whose body covers the green body. It is expected after a rise.
What the engulfing pattern actually records is narrow. One side was in control on the first bar. On the second bar the other side took the session back hard enough to close beyond where the first bar opened. That is a failed push, at one location, on one timeframe. It does not tell you how far the next move will run, or whether there will be one at all.
Candlestick charting is commonly credited to Munehisa Homma, an eighteenth-century Japanese rice merchant, and Steve Nison brought it to Western traders in 1991. The history is useful context. It is not evidence that the engulfing pattern works.
Bullish vs Bearish Engulfing Patterns
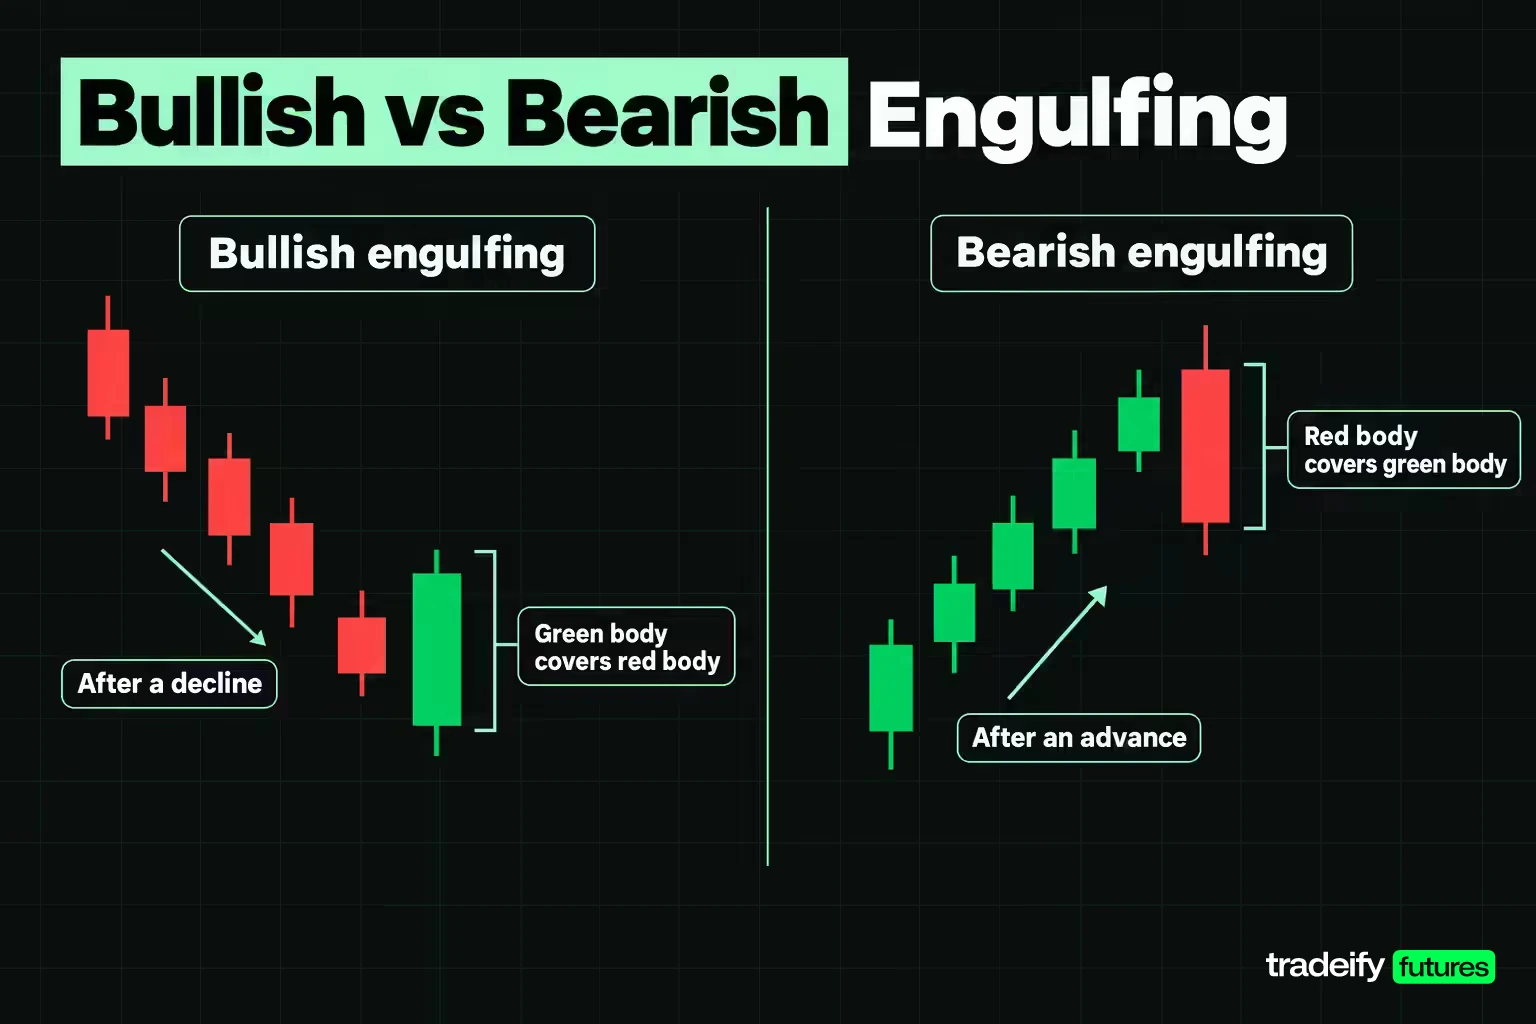
Bullish and bearish engulfing patterns are the same shape with the colors and the trend flipped. Thomas Bulkowski's pattern descriptions put the rules side by side clearly: the bullish version needs a down candle, then an up candle that opens below the prior close and closes above the prior open. The bearish version needs an up candle, then a down candle that opens above the prior close and closes below the prior open. Both ignore the shadows.
| Feature | Bullish engulfing pattern | Bearish engulfing pattern |
|---|---|---|
| Prior move | Decline | Advance |
| First candle | Small red body | Small green body |
| Second candle | Larger green body | Larger red body |
| Open of second candle | Below the first candle's close | Above the first candle's close |
| Close of second candle | Above the first candle's open | Below the first candle's open |
| Typical stop | Below the pattern low | Above the pattern high |
| Bulkowski reversal rate | 63% | 79% |
| Bulkowski overall performance rank of 103 | 84 | 91 |
A bearish engulfing candle in numbers
A bearish engulfing candle is the second, larger red candle of the pair. Here is an illustrative pair on E-mini S&P 500 (ES) futures, with round prices chosen so the arithmetic is easy to check.
- The green candle opens at 6,050.00, trades up to 6,058.00, down to 6,048.50, and closes at 6,056.00. Its body is 6.00 points.
- The red candle opens at 6,057.00, above that close. It trades up to 6,059.50, down to 6,046.00, and closes at 6,047.00, below the green open. Its body is 10.00 points.
The red body covers the green body, so the pair passes the body test. Its high and low also sit outside the green candle's high and low, so it passes the stricter range test too.
The common stop for a short sits just above the high of the engulfing candle. One tick above 6,059.50 is 6,059.75. A short at the 6,047.00 close therefore risks 12.75 points, or 51 ticks. On ES at $50 per point that is $637.50 per contract. On the Micro E-mini (MES) at $5 per point it is $63.75.
So the bearish version earns more respect in the data, but not more trust. Bulkowski's testing found it reverses more often than the bullish version (79% against 63%), yet its post-breakout move ranks even lower. Price often turns, then stalls.
The Market Psychology Inside an Engulfing Candle
The market psychology of an engulfing candle is easiest to follow session by session. Take the bullish version after a decline.
- The first candle. Sellers are still in charge. The bar closes lower, and the small body says the push is losing some force, but nobody has proven anything yet.
- The open of the second candle. Price opens at or below the prior close. Sellers who were already short feel comfortable. Late sellers join because the move still looks intact.
- The turn. Buyers absorb the selling and lift price through the first bar's body. Shorts who sold the open are now underwater.
- The close. The bar closes above the first bar's open, near its high. The sellers who joined on the first bar and at the second bar's open are now trapped in losing shorts. Their buying to cover can add fuel.
Investopedia describes the second day the same way: bears control the morning, then bulls decisively take over by the end of the day. The bearish pattern is the mirror. Early buyers feel safe, the bar reverses, and late longs are left holding a loss.
Two details change how much the story means. The first is where the close lands inside the bar's range. A close near the extreme says the winning side held its ground into the end of the session. A close back in the middle says the fight is still open. The second is location. A trapped-seller story only matters if there is a level nearby that those sellers care about, such as a prior swing low or a support zone.
The hard part is emotional, not technical. An engulfing bar after a long decline feels like relief, and relief makes traders size up. The bar tells you who won one session. It does not tell you the next session will cooperate.
How to Identify an Engulfing Pattern
Identifying an engulfing pattern comes down to two tests, the body test and the range test, and you need to decide which one your plan uses before the session starts. Most of the arguments traders have about engulfing patterns are really arguments about which test they used.
Related lesson: Three methods and three outside patterns
The body test for engulfing candles
The body test is the standard definition. For a bullish engulfing pattern:
- The first candle closes below its open (a red candle).
- The second candle opens below the first candle's close.
- The second candle closes above the first candle's open.
When those three hold, the second body is automatically taller than the first, so no separate size rule is needed. Academic studies write the same rule as strict inequalities. Tharavanij and colleagues, studying the Thai market in 2017, defined the bullish engulfing as the second close above the first open, the first open above the first close, and the first close above the second open, inside a downtrend.
The range test for engulfing candles
The range test is stricter. It asks whether the second candle's high and low both sit outside the first candle's high and low. Some sources mix the two up. Investopedia's bearish engulfing page says the body is what matters, then adds that the high must be higher and the low lower than the previous candle, which is a range condition. The bar that passes both tests is also called an outside bar.
Neither test is wrong. They answer different questions. The body test asks who won the open-to-close battle. The range test asks whether the second session also traded through both extremes of the first.
Lookalike bars that fail the engulfing tests
The lookalike bars are where the money gets lost, because they look right at a glance. Each row below uses illustrative ES prices.
| Bar pair | Body test | Range test | What it means for you |
|---|---|---|---|
| Red bar 6,010.00 open, 6,004.00 close, 5,996.00 low. Green bar opens 6,003.75, closes 6,012.00, low 6,001.00 | Passes | Fails, the green low sits 5.00 points above the red low | A real engulf under the common definition that a range-only rule will never flag |
| Same red bar. Green bar opens 6,005.00, closes 6,015.00, low 6,003.00 | Fails, the open sits 1.00 point inside the red body | Fails | A tall green bar after a red bar is not an engulf unless it opens beyond the prior close |
| Green bar 6,010.00 open, 6,016.00 close, 6,017.00 high, 6,008.00 low. Red bar opens 6,015.00, closes 6,006.00, high 6,019.00, low 6,005.00 | Fails, the open sits 1.00 point inside the green body | Passes | A range-only scanner calls this bearish engulfing and a body-only scanner does not |
The intraday futures open problem
The intraday futures open problem is a definition trap most engulfing pattern guides skip. On a stock's daily chart, the next day often opens with a gap, so the body test has room to work. On intraday futures bars, the market trades nearly around the clock, so the next bar usually opens at or within a tick of the prior close. A strict "opens below the prior close" rule will flag very few intraday engulfing patterns.
Many traders relax the rule to "opens at or below the prior close" on intraday futures charts. That is a reasonable convention, but it is a change to the definition. Write down which version you use. If your scanner allows an equal open, your results will not match a study that used the strict version, and that is fine as long as you know it.
An Engulfing Pattern Audit on Five ES Bars
This engulfing pattern audit runs one illustrative sequence of ES 15-minute bars through both tests. The prices are round numbers chosen so you can check every figure by hand. They are not a record of a real session.
The decline. Four red bars fall from an open of 6,042.00 to a close of 6,004.00, a drop of 38.00 points. The swing high they fall from is 6,045.00, so the full move from the swing high to the fourth close is 41.00 points.
Bar four. It opens at 6,010.00, trades up to 6,012.00, down to 5,996.00, and closes at 6,004.00. Its body is 6.00 points.
Bar five, the candidate. It opens at 6,003.75, one tick below bar four's close. It trades down to 6,001.00, up to 6,012.50, and closes at 6,012.00.
Now run the checks.
- Body test. The open at 6,003.75 is below the prior close at 6,004.00. The close at 6,012.00 is above the prior open at 6,010.00. It is a green bar after a red bar. It passes. Its body is 8.25 points against bar four's 6.00, which is 37.50% taller.
- Range test. The high at 6,012.50 is above bar four's high at 6,012.00. The low at 6,001.00 is 5.00 points above bar four's low at 5,996.00. It fails, because bar four's lower shadow reached further than bar five ever did.
Reading engulfing bar quality
After the tests, read the quality of the engulfing bar, not just its shape.
| Measure | Value | What it tells you |
|---|---|---|
| Range | 11.50 points | The total distance traded in the session |
| Close position in range | 95.65% | Buyers held price near the high into the close |
| Body as share of range | 71.74% | Most of the bar was directional, with short shadows |
| Upper shadow | 0.50 points | Little selling into the close |
| Lower shadow | 2.75 points | A brief test lower that was bought |
| Body as share of the 41.00-point fall | 20.12% | A meaningful bar, but it reclaimed only a fifth of the decline |
Bar six, the confirmation. It opens at 6,012.00, trades down to 6,010.00, up to 6,022.00, and closes at 6,020.50, above the engulfing bar's high.
The audit says the pattern is valid under the body test and strong on bar quality. It does not say the trade is good. That depends on where the stop goes, where the target is, and what it costs to wait for bar six. Pricing those choices is a separate job.
Confirmation Indicators for Engulfing Patterns
Confirmation indicators for engulfing patterns try to answer one question: is this bar a turn or just a pause? The common tools are below, with what each one adds and where it falls short.
- The next bar. The simplest confirmation is a following bar that closes beyond the engulfing bar, or trades through its high for a bullish signal. Investopedia suggests entering long when price moves above the engulfing candle's high. Bulkowski tracks the three-candle version as its own pattern, three outside up, which acts as a bullish reversal 75% of the time and ranks 34 of 103 on overall performance. The two-bar bullish engulfing ranks 84.
- Support and resistance. An engulfing bar that forms at a prior swing low or a clear support zone has a reason to hold. One that prints in the middle of a range has nothing behind it.
- Trend filters. TradingView's built-in pattern detector offers a 50-period simple moving average as its trend test, or a stricter test that also requires the 50 to sit below the 200 for a downtrend. Bulkowski's own tip runs the other way from the textbook: he suggests avoiding bullish engulfing candles in a downward primary trend and trading them as pullbacks in a rising one.
- Volume. A higher-volume engulfing bar suggests more participation in the reversal. On futures, check the volume of the contract month you actually trade, not a continuous chart that mixes months.
- Momentum oscillators. Investopedia names RSI and MACD as common confirmation tools.
What research says about engulfing confirmation filters
Be honest about what the research says on indicator filters for candlestick signals. The 2017 Thai study by Tharavanij and colleagues tested Stochastics, RSI and money flow index filters on candlestick signals and found they generally did not improve profitability or prediction accuracy. Confirmation that helps on one market can do nothing on another.
Related lesson: Support and resistance
Confirmation also has a price. Every bar you wait moves your entry further from your stop. That cost is measurable, and it is often larger than traders expect.
Trading Strategies With Engulfing Patterns
Trading strategies with engulfing patterns work best when the pattern is the trigger, not the reason. The reason should already exist before the bar prints. Here are three plans, each with its condition and what would cancel it.
Engulfing reversal at a marked level
- Condition. You marked a support or resistance zone before the session. Price reaches it after a measurable move, and an engulfing bar forms inside the zone.
- Action. Enter on the close of the engulfing bar or on a break of its high (bullish) or low (bearish), with the stop beyond the pattern extreme.
- Invalidation. Price closes back beyond the far side of the engulfing bar. At that point the trapped traders were not trapped after all.
Engulfing pullback in an existing trend
- Condition. The higher timeframe is trending. Price pulls back against it, and an engulfing bar forms in the trend's direction at the end of the pullback.
- Action. Trade with the trend. Bulkowski's own guidance for the bullish engulfing is exactly this: look for a downward retrace in a rising price trend.
- Invalidation. The pullback breaks the prior swing point that defined the trend.
The failed engulfing pattern
- Condition. A clean engulfing bar forms, the next bar or two fail to follow through, and price trades back through the far side of the pattern.
- Action. Some traders treat the failure as the signal in the opposite direction, because the traders who bought the engulf are now trapped.
- Invalidation. Price reclaims the engulfing bar's extreme.
In every version, you decide the level, the stop and the target before the pattern appears. If you only start looking for those after the bar prints, you are fitting a plan to a feeling.
Related lesson: Multiple timeframe analysis
Engulfing Pattern Entries and Stops Priced Six Ways
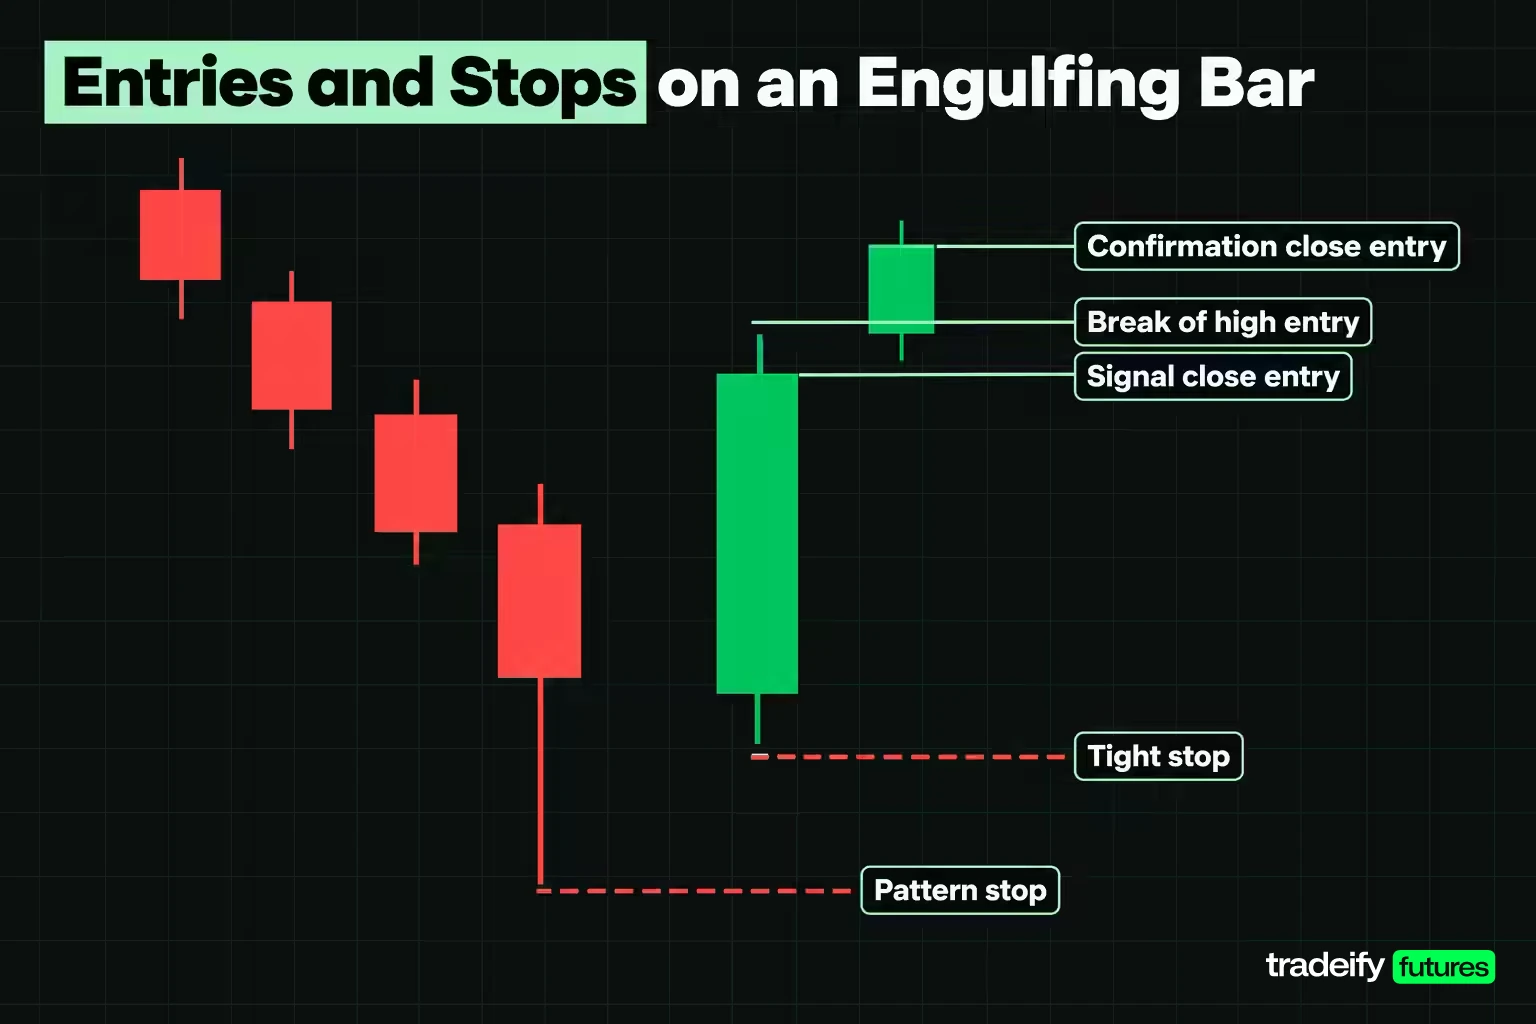
An engulfing pattern supports several defensible entries and stops, and they are not close to equal. This section prices three entries against two stops on one illustrative ES 15-minute sequence.
The sequence: four red bars fall to a bar that closes at 6,004.00 with a low of 5,996.00. A bullish engulfing bar opens at 6,003.75, trades down to 6,001.00, up to 6,012.50, and closes at 6,012.00. The next bar closes at 6,020.50. The target is the 6,045.00 swing high where the decline started.
The three entries:
- Signal close. Buy at the engulfing bar's close, 6,012.00.
- Break of the high. A buy stop one tick above the engulfing high, at 6,012.75. This is the entry Investopedia describes.
- Confirmation close. Buy at the next bar's close, 6,020.50.
The two stops:
- Tight stop. One tick under the engulfing bar's low, at 6,000.75.
- Pattern stop. One tick under the pattern low, the first bar's 5,996.00, at 5,995.75. This is the low the pattern claims to have rejected.
The costed columns assume a round-trip cost of $2.00 per MES contract, which is 0.40 points. That figure is an illustrative assumption. Use your own fee schedule.
| Entry and stop | Risk | Reward | Reward to risk | Reward to risk after costs | Break-even win rate after costs |
|---|---|---|---|---|---|
| Signal close 6,012.00, stop 6,000.75 | 11.25 points, 45 ticks | 33.00 points, 132 ticks | 2.93 to 1 | 2.80 to 1 | 26.33% |
| Signal close 6,012.00, stop 5,995.75 | 16.25 points, 65 ticks | 33.00 points, 132 ticks | 2.03 to 1 | 1.96 to 1 | 33.81% |
| Break of high 6,012.75, stop 6,000.75 | 12.00 points, 48 ticks | 32.25 points, 129 ticks | 2.69 to 1 | 2.57 to 1 | 28.02% |
| Break of high 6,012.75, stop 5,995.75 | 17.00 points, 68 ticks | 32.25 points, 129 ticks | 1.90 to 1 | 1.83 to 1 | 35.33% |
| Confirmation close 6,020.50, stop 6,000.75 | 19.75 points, 79 ticks | 24.50 points, 98 ticks | 1.24 to 1 | 1.20 to 1 | 45.54% |
| Confirmation close 6,020.50, stop 5,995.75 | 24.75 points, 99 ticks | 24.50 points, 98 ticks | 0.99 to 1 | 0.96 to 1 | 51.07% |
What the priced engulfing entries show
In the priced table of engulfing entries, look at the confirmation-close row with the pattern stop. That combination risks 24.75 points to make 24.50. After costs you need to win 51.07% of the time just to break even. The confirmation moved the entry 8.50 points higher, which shrank the reward from 33.00 to 24.50 points and widened the risk at the same time.
The break-of-high entry is the quiet winner in this sequence. It costs only 0.75 points more than the signal close and it only fills if price actually trades above the engulfing high. That is a real piece of confirmation for very little price.
None of these rows is the "right" one for every trader, and that is the honest answer. The tight stop gives a better ratio but sits inside the noise of the bar that formed the pattern, so it will be hit more often. The pattern stop is structurally cleaner but costs more. The point is to see the tradeoff in numbers before you click.
Position Sizing and Risk Management for Engulfing Trades
Position sizing for engulfing trades starts from the stop, not from how good the bar looks. A clean engulf after a long selloff can feel like the best setup of the day, and the instinct is to size up to match the feeling. The numbers are the check on that instinct. Take an illustrative $25,000 account that risks 0.5% per trade. The budget is $125.00.
One ES contract moves $50 per index point, and one MES moves $5. That tenfold difference decides which contract the engulfing trade can use at all. Using the same illustrative ES sequence and the assumed $2.00 round-trip MES cost:
| Entry and stop | Risk per ES | Risk per MES with cost | MES contracts on $125.00 | Total risk | Target value |
|---|---|---|---|---|---|
| Signal close, stop 6,000.75 | $562.50 | $58.25 | 2 | $116.50 | $330.00 |
| Signal close, stop 5,995.75 | $812.50 | $83.25 | 1 | $83.25 | $165.00 |
| Break of high, stop 6,000.75 | $600.00 | $62.00 | 2 | $124.00 | $322.50 |
| Break of high, stop 5,995.75 | $850.00 | $87.00 | 1 | $87.00 | $161.25 |
| Confirmation close, stop 6,000.75 | $987.50 | $100.75 | 1 | $100.75 | $122.50 |
| Confirmation close, stop 5,995.75 | $1,237.50 | $125.75 | 0 | None | None |
What the engulfing sizing table shows
Three things stand out in the engulfing sizing table.
- ES is off the table. Even the tightest version risks $562.50 on one ES contract, which is 2.25% of the account against a 0.5% plan.
- The last setup sizes to zero. With costs, one MES risks $125.75, which is $0.75 over the $125.00 budget. The correct position is no position.
- Wider stops halve the payoff. Moving from the tight stop to the pattern stop drops the signal-close trade from 2 MES to 1, so the dollar target falls from $330.00 to $165.00 even though the price target never moved.
Once you are in, decide the stop management rules in advance. Common choices are to leave the stop alone until price clears a prior swing, or to move it to break-even once price has travelled a set distance. Either can be reasonable. Changing the rule mid-trade because the bar "looks strong" usually is not.
Related lesson: Position sizing
How Reliable Engulfing Candlestick Patterns Are
Engulfing candlestick patterns are reliable at one narrow thing and unreliable at the thing most traders want. They often mark a short-term turn. They rarely predict a large move.
Thomas Bulkowski's tests of 103 candlestick patterns are the most quoted numbers. He counts a reversal when price closes beyond the top of the pattern (for the bullish version) before it closes below the bottom.
- Bulkowski's bullish engulfing result. It acts as a bullish reversal 63% of the time, ranking 22 of 103 on reversal rate. Its overall performance rank, which measures the move after the breakout, is 84.
- Bulkowski's bearish engulfing result. It acts as a bearish reversal 79% of the time, ranking 5 of 103, across about 20,000 patterns he studied. Its overall performance rank is 91. In his words, the trend after the breakout is short-lived.
Academic studies of engulfing patterns
The academic work on engulfing and other candlestick patterns is more mixed, and the details matter.
| Study and sample | What was tested | Reported result |
|---|---|---|
| Bulkowski, 103 candlestick patterns | Bullish engulfing | Bullish reversal 63% of the time, overall performance rank 84 of 103 |
| Bulkowski, about 20,000 bearish engulfing patterns | Bearish engulfing | Bearish reversal 79% of the time, overall performance rank 91 of 103 |
| Heinz, Jamaloodeen, Saxena and Pollacia (2021), daily S&P 500 index from 1950 | Bullish and bearish engulfing | Strong short-term forecasting power when success was judged on the open and the high or low, but not on the close |
| Tharavanij, Siraprapasiri and Rajchamaha (2017), Thai SET50 stocks, 2006 to 2016 | Candlestick reversal patterns with and without indicator filters | Most patterns did not produce statistically significant mean returns, and Stochastics, RSI and MFI filters generally did not help |
| Deng and colleagues (2022), Chinese SSE50 stocks, 2000 to 2018 | Ten well-known patterns | Several bullish patterns produced significant positive returns over some holding periods, and none of the bearish patterns showed predictive power |
| Ngo and colleagues (2018), Vietnamese stocks, 2013 to 2018 | Candlestick reversal patterns | Tested patterns did not show the ability to predict the trend, and bearish-pattern holding strategies, including the bearish engulfing, brought no profit |
The S&P 500 result is the most useful one for a futures trader, because it explains a common frustration. The pattern did show forecasting power when the next sessions' opens and extremes were measured, but not when the closes were. In plain terms, price often pokes in the expected direction and then does not hold it into the close. That fits Bulkowski's finding that reversals are frequent but short.
What the engulfing research means for you
Put together, the evidence says three things.
- The engulfing pattern is a reasonable place to look for a short-term turn.
- It is not an edge by itself on most markets studied.
- How you exit matters at least as much as the signal, because the move after the pattern tends to be short.
That is why the stop and the target carry the trade. A pattern that turns often but travels a short way rewards tight, pre-planned exits and punishes hoping for a trend change.
Engulfing Patterns Compared With Harami, Piercing and Dark Cloud Cover
Engulfing patterns share a family with several other two- and three-candle reversals. The differences are in how much of the prior body the second candle covers. Bulkowski's statistics give a rough sense of how each behaves in his testing.
| Pattern | How the second candle relates to the first | Bulkowski reversal rate | Bulkowski overall rank of 103 |
|---|---|---|---|
| Bullish engulfing | Opens below the prior close and closes above the prior open, covering the whole body | 63% | 84 |
| Bearish engulfing | Opens above the prior close and closes below the prior open | 79% | 91 |
| Bullish harami | Small body sits inside the prior tall body, the containment reversed | 53% | 38 |
| Piercing pattern | Opens below the prior low and closes between the midpoint of the prior body and its open | 64% | 13 |
| Dark cloud cover | Opens above the prior high and closes below the midpoint of the prior body | 60% | 22 |
| Three outside up | A bullish engulfing followed by a confirming third candle | 75% | 34 |
| Three outside down | A bearish engulfing followed by a third candle with a lower close | 69% | 39 |
A few practical notes follow from the table.
- Harami is the opposite of engulfing. In an engulfing pattern the second body swallows the first. In a harami the second body sits inside the first.
- Piercing and dark cloud cover are partial engulfs. The second candle closes past the midpoint of the first body but not past its open. Bulkowski ranks both higher on overall performance than the full engulf.
- The outside bar is the range version. A bar whose high and low both exceed the prior bar's is an outside bar, whatever its body does.
- Confirmation shows up in the ranks. The three outside patterns, which are engulfing patterns plus a confirming candle, rank far better on overall performance than the two-candle engulfs.
Related lesson: Harami candlestick patterns
Common Mistakes With Engulfing Patterns
The common mistakes with engulfing patterns fall into a handful of repeatable shapes. Knowing the list protects you more than knowing the pattern.
| Mistake | What it looks like | Why it fails | The fix |
|---|---|---|---|
| Mixing definitions | Calling a bar an engulf under the body test one day and the range test the next | Your journal sample stops being comparable | Pick one test, write it in your plan, and log it |
| Shadow engulf taken as body engulf | The second bar's high and low cover the first bar, but its body does not | The standard pattern is about bodies, so no engulf happened | Check open and close first, then the range only if your rule needs it |
| No prior move | The pattern prints inside a sideways range | There was no push to fail, so there are no trapped traders | Require a measured prior move before you look |
| Tall candle, wide stop | A big engulfing bar leaves the structural stop far away | Reward to risk falls below 1 to 1 | Price the trade before sizing it and skip it when the ratio collapses |
| Paying for confirmation | Waiting a bar and carrying the old ratio in your head | The entry moves further than the stop, which eats the payoff | Re-price the trade at the new entry |
| Ignoring location | A valid engulf forms straight into resistance | A good bar with no room to travel is a poor trade | Mark levels before the session |
| Hunting for a reason | Finding an engulf to justify a trade you already wanted | The pattern is common enough that a search always succeeds | Write your plan before you look at the chart |
Two engulfing mistakes that are pure arithmetic
Two of these mistakes are not judgment calls at all. They are arithmetic, and you can catch them every time.
The first is the tall candle problem. Investopedia notes that the engulfing candle may be huge and leave a very large stop, so the reward may not justify the risk. In an illustrative ES sequence where buyers wait for confirmation at 6,020.50 and use a stop at 5,995.75, the trade risks 24.75 points to make 24.50. It is a coin flip before costs and a loser after them.
The second is the belief that confirmation is free. In the same sequence, waiting one bar moved the entry 8.50 points and dropped the payoff from 2.93 to 1 to as low as 0.99 to 1. If you want the extra confirmation, re-price the trade. Sometimes the right answer is to skip it.
The third mistake is quieter. Engulfing patterns are common. Bulkowski gives the bullish version a frequency rank of 12 out of 103. If you go looking for one to support a trade you already decided on, you will find it.
Related lesson: Confirmation bias
Turning the Engulfing Pattern Into Written Rules
Turning the engulfing pattern into written rules is the step that separates a pattern you test from a pattern you hope about. A rule has to be precise enough that two people, or a scanner, would flag the same bars.
Writing the engulfing definition as code-ready rules
For a bullish engulfing pattern, a rule set might read:
- Bar one closes below its open.
- Bar two opens at or below bar one's close (state whether you allow "at").
- Bar two closes above bar one's open.
- Trend filter: bar two's close is below its 50-period simple moving average, or whatever trend test you choose.
- Location filter: bar two's low is within a set number of ticks of a level you marked before the session.
The academic version is stricter on the open condition (no equal open allowed) and drops the location filter. TradingView's built-in detector lets you choose a trend test based on the 50-period average, the 50 and 200 together, or no trend test at all. Each choice produces a different set of signals.
An engulfing pattern checklist before entry
An engulfing pattern checklist keeps a flagged bar from turning into an impulse trade. Before acting on any engulfing bar, run five questions in order and stop at the first "no."
- Does the bar pass the engulfing test (body or range) you fixed in advance?
- Is there a measured prior move for it to reverse?
- Where is the stop, and how many ticks does it cost?
- Is there a reachable target that pays at least 2 to 1 after costs?
- Is the bar forming at a level you marked before the session?
Alerts and backtests for engulfing patterns
Alerts for engulfing patterns save screen time. Most charting platforms let you set an alert when a custom condition is true on a bar close, so an alert built from your written engulfing rules (bar colors, open and close conditions, trend filter and level) lets you stop staring at every bar.
A backtest of an engulfing pattern rule needs a few decisions made before you run it, or the result means little:
- Which definition, which trend filter, and which timeframe.
- One fixed entry (signal close, break of the engulfing high, or next-bar close) and one fixed stop (under the engulfing bar or under the pattern low).
- A fixed exit rule, since research by Lu, Chen and Hsu on candlestick strategies found that the exit rule can decide profitability.
- Realistic costs and slippage per round trip.
- A sample large enough to include losing streaks, plus a period you keep aside and test only once.
Related lesson: Backtesting a trading strategy
Engulfing Patterns Across Markets and Timeframes
Engulfing patterns appear on every market that prints candles, but the market's session structure changes how often they qualify and what they cost.
- Stocks on daily charts. Overnight gaps are common, so the open-beyond-prior-close condition is easy to meet. Most of the published research uses daily stock or index data.
- Futures intraday. Equity index futures trade nearly around the clock, so intraday bars usually open at the prior close. Strict engulfing patterns are rare there, and many traders accept an equal open.
- Forex and crypto. Both trade continuously for long stretches, so the same open problem applies. Daily candles on these markets also depend on which closing time your platform uses, which can change the shape of a daily bar.
Timeframe changes the cost more than the meaning. Lower timeframes print more engulfing patterns and more noise. Higher timeframes print fewer, with wider stops. Investopedia's view is that longer timeframes are generally more reliable but need more patience and capital.
Stop width is the practical limit. An illustrative 20-point stop under a daily engulfing pattern on ES is $1,000 per contract. On MES it is $100. That single number can decide which timeframe and which contract a small account can trade at all.
On our accounts, ES and MES are both on the supported product list, and position size is capped by contract limits. A 25K account allows 1 mini or 10 micros, and 10 micros count as one mini. Every position must be closed by 4:45 PM ET, so a daily engulfing setup can only be traded inside a single session, not held overnight. If you want to practice spotting engulfing patterns first, WealthCharts, one of our supported platforms, has a Chart Replay mode for stepping through historical price action. Our funded accounts are simulated.
Related lesson: Tick size and tick value
Engulfing Pattern Frequently Asked Questions
What is a bearish engulfing candle?
A bearish engulfing candle is a red candle whose real body covers the body of the green candle before it, after a rise. It opens above the prior close and closes below the prior open. Bulkowski found it reverses 79% of the time, but the move afterward tends to be short.
What is the strongest bearish pattern?
No single pattern is strongest everywhere. In Bulkowski's ranking of 103 patterns by overall performance, the top true bearish reversals are three black crows at third and the evening star at fourth. The bearish engulfing ranks 91st on that measure despite its high reversal rate.
What are the different types of engulfing candlestick patterns?
There are two main types, the bullish engulfing after a decline and the bearish engulfing after a rise. Related variants include the outside bar, which engulfs the full high-to-low range, and the three outside up and down patterns, which add a confirming third candle.
What are some effective strategies for trading candles?
The strategies that hold up treat a candle as a trigger at a location you chose in advance, not as a forecast. Mark levels first, wait for the pattern there, price the stop and target before entry, and size from the stop. Then test those exact rules on your own data before trusting them.
Does an engulfing candle have to cover the wicks?
No. The standard definition compares only the real bodies and ignores the shadows. A stricter range version also requires the second candle's high and low to exceed the first candle's, so choose one and use it consistently.
What is the 3 candle rule for engulfing patterns?
It is a confirmation convention, not a fixed standard. The usual form says a two-candle engulfing pattern counts only when a third candle closes beyond it. Bulkowski tracks that version as three outside up and three outside down, which rank higher on overall performance than the two-candle patterns.
Is a bullish engulfing pattern always bullish?
No. The name describes a shape, not an outcome. In Bulkowski's testing the bullish engulfing failed to reverse about 37% of the time, so size every trade so that the failure case is affordable.
Engulfing Pattern Trading Risk
This guide is education, not investment advice or a recommendation to trade any instrument. Futures are leveraged, and losses can be larger than you expect on a single trade, and a stop order does not guarantee your exit price in a fast market. Every price, account size, cost and position size here is an illustrative example, not a record of a real trade or a promise of any result. Published pattern statistics come from specific markets and periods and may not carry over to yours. Simulated and funded account results are simulated and do not reflect live trading conditions. Test any rule on your own data before you risk money on it.


