




TL;DR: Point and figure charts plot price as columns of Xs and Os, so the box size and reversal amount, not the clock, decide what you see. A buy signal is an X column clearing the prior X column high, and a sell signal is the mirror. Counts give price objectives, but they move until the column reverses, and the two counting methods often disagree. Set the box in whole ticks, price the stop before the signal, and read exact prices on a candlestick chart.
Point and figure charts are built for one decision: is price actually breaking out of its range, or is it still chopping around inside it? They answer it by throwing away time and every move smaller than a setting you choose. That filter is the appeal. It is also where traders get caught, because the chart you see depends on two numbers most people never change from the default.
This guide covers how point and figure charts are built and how to read their signals, levels, patterns and price counts. It runs one 27-close E-mini S&P 500 example through every step with real contract math, so you can see what a signal costs before you take one.
What a Point and Figure Chart Shows
A point and figure chart records price movement in vertical columns of Xs and Os on a grid of boxes. An X column means price is rising. An O column means price is falling. The columns alternate, so two X columns never sit side by side, and a single column never mixes the two letters.
The defining feature is what the horizontal axis does not show. There is no time axis. A candlestick or bar chart prints a new bar every interval whether anything happened or not. A point and figure chart only adds a mark when price travels far enough to fill another box, and it only starts a new column when price reverses by a set number of boxes. If price drifts sideways in a tight range all afternoon, the chart does not move at all.
That gives the chart three practical jobs:
- Filtering noise. Moves smaller than one box never appear, so small wiggles inside a trend disappear.
- Showing trend direction. A run of rising X columns with higher highs and higher lows reads as an uptrend at a glance.
- Making levels obvious. Several columns stopping at the same price line up horizontally, which is how support and resistance show up on this chart.
The method is old. A writer using the name Hoyle described it in 1898 in The Game in Wall Street, and A.W. Cohen popularised the modern three-box reversal version with Xs and Os in the 1940s. Most charting platforms still carry it, usually under the chart type or bar style menu.
The cost of the filter is detail. A mark tells you price filled a box, not where inside the box it traded or how long it took to get there. A column that took three weeks and one that took three sessions can look identical. Treat a point and figure chart as a structure chart and keep a time-based chart open for exact prices.
Related lesson: Trading chart types
How to Build a Point and Figure Chart

Building a point and figure chart takes two settings and one pricing rule. Everything else is mechanical. That is good news, because it means you can rebuild the chart by hand and check whether your platform drew what you think it drew.
Box size and reversal amount on a P&F chart
The box size is the price step one X or O represents. With a 10-point box on the E-mini S&P 500 (ES), each mark is worth 10 index points, which is 40 ticks or $500 on one ES contract, because ES is $50 per point with a 0.25-point tick worth $12.50.
The reversal amount is how many boxes price must move against the current column before a new column starts. The default on most platforms is 3. The reversal distance is box size times reversal amount, so a 10-point box with a 3-box reversal needs a 30-point move against the column (120 ticks) to flip it.
The rules for each new price are short:
- In an X column, add an X for every full box price rises above the top box. If price instead falls by the full reversal distance from the top box, start an O column one box under that top.
- In an O column, add an O for every full box price falls below the bottom box. If price instead rises by the full reversal distance from the bottom box, start an X column one box over that bottom.
- If neither happens, draw nothing.
Close or high-low pricing
Your platform also has to decide which price to feed the chart. The close method uses only the closing price of each bar. The high-low method, credited to A.W. Cohen's 1947 book, uses either the high or the low but never both: in an X column it checks the high first, and only if no new X can be drawn does it check the low for a reversal. High-low catches intraday swings that a close-only chart misses, so the same instrument can produce a different chart depending on this one switch.
Box size can also be set automatically. StockCharts offers a traditional table by price band, a percentage of price (default 1%), an ATR-based box (default 20 periods) and a fixed user-defined box. TradingView offers ATR (default length 14), traditional and percentage of last price (default 1%). ATR boxes resize as volatility changes, which StockCharts warns can make prior signals disappear, so a fixed box is easier to audit.
A worked chart build from 27 ES closes
Here is a constructed, illustrative series of 27 ES closes, built with a 10-point box, a 3-box reversal and the close method. These are not real market data.
The closes, in order, are 6,620, 6,640, 6,660, 6,680, 6,665, 6,650, 6,630, 6,620, 6,640, 6,655, 6,670, 6,685, 6,650, 6,625, 6,660, 6,690, 6,705, 6,720, 6,745, 6,760, 6,790, 6,810, 6,795, 6,780, 6,760, 6,775 and 6,795.
| Column | Letter | Range in boxes | Boxes | Closes that built it |
|---|---|---|---|---|
| 1 | X | 6,620 to 6,680 | 7 | 1 to 4 |
| 2 | O | 6,670 to 6,620 | 6 | 6 to 8 |
| 3 | X | 6,630 to 6,680 | 6 | 10 to 12 |
| 4 | O | 6,670 to 6,630 | 5 | 13 to 14 |
| 5 | X | 6,640 to 6,810 | 18 | 15 to 22 |
| 6 | O | 6,800 to 6,760 | 5 | 24 to 25 |
| 7 | X | 6,770 to 6,790 | 3 | 27, still open |
Look at the closes this ES build ignored, because they show the filter at work. Close 5 (6,665) and close 9 (6,640) drew nothing, because neither filled a new box nor reversed 30 points. Close 12 (6,685) filled only the 6,680 box, because 6,690 was not reached. Close 14 (6,625) filled the 6,630 box and no further. Closes 23 and 26 also drew nothing. Four of the 27 closes left no trace on the chart. That is the design working, not a glitch, and it is exactly the noise a candlestick chart would have shown you.
P&F Chart Buy and Sell Signals
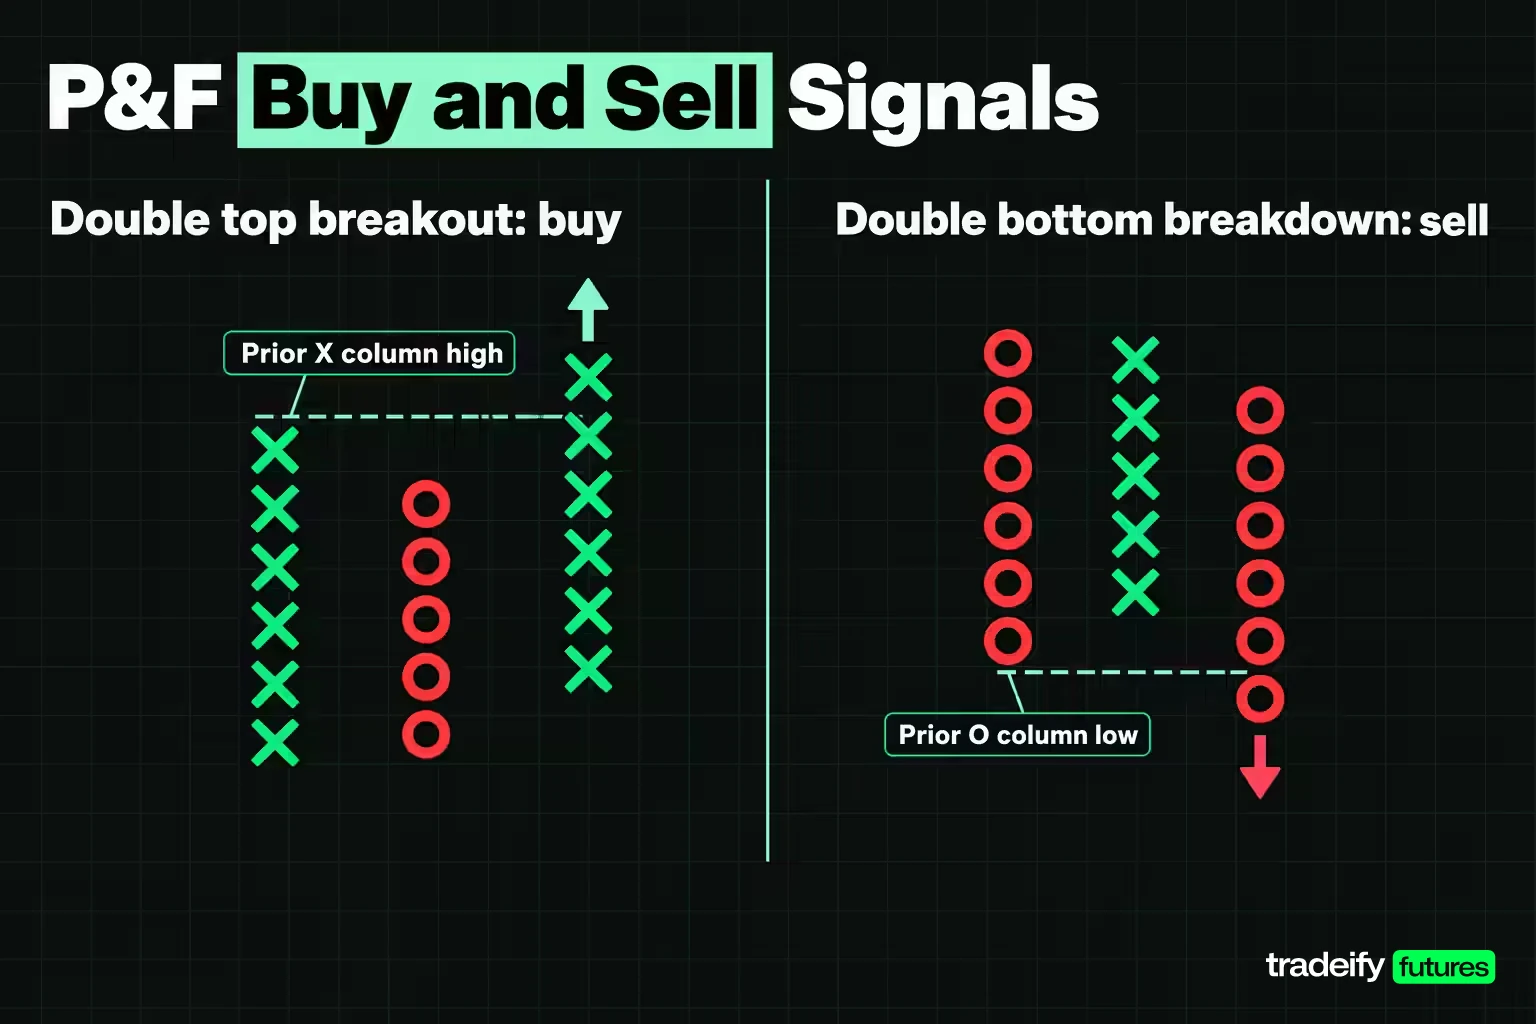
Point and figure signals come from columns breaking past earlier columns. The most basic buy signal is the double top breakout: an X column rises above the high of the previous X column. The most basic sell signal is the double bottom breakdown: an O column falls below the low of the previous O column.
Watch the naming trap here. On a bar chart, a double top is a bearish pattern confirmed by a support break. On a point and figure chart, a double top breakout is bullish. Same words, opposite meaning. If you read about these patterns elsewhere, check which chart type the writer means.
The double top breakout is also the most common signal on a point and figure chart, and ChartSchool calls it the one most prone to whipsaw and failure. That changes how you should use it. A double top breakout shows buyers pushed through the last high. It does not confirm a trend, and taken alone in a choppy market it can hand you a string of small losing trades.
In the 27-close ES example (10-point box, 3-box reversal), columns 1 and 3 both topped at 6,680. Column 5 filled the 6,690 box on close 16, which cleared both earlier highs at once. Because two equal highs were taken out, this is a triple top breakout, a stronger version of the basic buy signal with a wider base underneath it.
The sell signal works as the mirror image. In that ES build, the most recent O columns bottomed at 6,630 (column 4) and 6,760 (column 6). A later O column filling a box under the prior O column's low would print a double bottom breakdown. Check where that level sits before you take the buy signal. It is where the chart itself would tell you the trade is wrong, so it belongs in your plan before the entry, not after.
Related lesson: Breakout trading
Support, Resistance and Trendlines on P&F Charts
Support and resistance are easier to see on a point and figure chart than on most other charts, because the grid forces columns to stop at exact box levels. A run of X columns with equal highs marks resistance. A run of O columns with equal lows marks support. The more columns that stop at the same box, the more often that level has turned price.
In the 27-close ES example (10-point box, 3-box reversal), resistance sat at 6,680, where columns 1 and 3 both topped. Support sat at 6,620 to 6,630, where columns 2 and 4 bottomed. That is a range with a clean ceiling and a slightly rising floor, so the breakout question became simple. Does an X column fill 6,690 or not? Close 16 answered it.
After a breakout, the old resistance level is the first place to watch on a pullback. In that ES build, column 6 pulled back to 6,760 and stayed well clear of the old 6,680 ceiling. A pullback that held near 6,680 instead would have been a test of the breakout, and a column that fell back into the 6,620 to 6,680 range would have been an early warning that the breakout was failing.
45-degree trendlines on a P&F chart
Because point and figure charts sit on a square grid, trendlines are drawn at a fixed 45-degree angle, rising one box per column, instead of being fitted by eye. A bullish support line starts under an important low and rises at 45 degrees. A bearish resistance line starts over an important high and falls at 45 degrees. StockCharts treats a point and figure trendline as in effect until price violates it.
ChartSchool notes that it takes at least a 5-3-5-3-5-3 column sequence (X columns of five or more boxes, O columns of three or fewer) to sustain a 45-degree advance. That gives you a quick health check on an uptrend: if the pullback columns keep getting longer relative to the advances, price will soon break the line even if the highs are still rising.
Many traders only take buy signals while price holds over the bullish support line and only take sell signals under the bearish resistance line. That is a filter, not a rule of the method. Test it on your own market before you trust it.
Related lesson: Support and resistance
P&F Chart Patterns Beyond the Double Top
Most point and figure chart patterns are wider versions of the double top breakout and double bottom breakdown. Width matters: the more columns a pattern spans, the better established the level it breaks. ChartSchool's pattern widths give you an objective way to name what you are looking at.
| Pattern | What forms | Minimum width | What confirms it |
|---|---|---|---|
| Triple top breakout | Two X columns with equal highs, then a third X column above both | 5 columns | X column fills a box over the shared high |
| Quadruple top breakout | Three X columns with equal highs, then a fourth above | 7 columns | X column fills a box over the shared high |
| Spread triple top | A triple top with extra columns between the highs | 7 columns | Same as the triple top |
| Ascending triple top | Two back-to-back double top breakouts | 5 columns | The second breakout |
| Bullish catapult | Triple top breakout, pullback into the pattern, then a double top breakout | 7 columns | The second breakout |
| Triangle | Lower highs and higher lows | 5 columns | A double top breakout or double bottom breakdown, not a trendline break |
| Bull trap | Multiple top breakout of only one box that reverses three boxes lower | 5 columns | The O column reversal |
| Bullish signal reversed | A series of higher highs ended by a double bottom breakdown | 6 columns | The double bottom breakdown |
Each bullish pattern has a bearish twin (triple bottom breakdown, bearish catapult, bear trap and so on) that works the same way upside down.
Bull and bear traps on a P&F chart
Traps are the pattern to understand first, because they explain why a one-box breakout deserves less trust than a strong one. A bull trap needs a triple top or wider breakout that clears resistance by exactly one box and then reverses into an O column at least three boxes lower. A breakout of two or more boxes does not qualify. ChartSchool also warns that traps can themselves fail and turn into catapults, so a trap is a warning, not a sell signal on its own.
The 27-close ES example (10-point box, 3-box reversal) shows the moment this matters. On close 16, column 5 filled 6,690, exactly one box over the 6,680 resistance. At that instant the triple top breakout was trap-eligible. A close at or under 6,660 next would have built a three-box O column and turned it into a bull trap. Instead close 17 (6,705) filled 6,700, two boxes clear, and the trap risk was gone.
Here is a rule worth writing down: a one-box breakout is a breakout on probation. Some traders wait for the second box before acting. They accept a worse entry in exchange for fewer traps, and that trade is a choice you should make before the signal, not while staring at it.
Triangle and catapult chart patterns
Triangles form when X columns make lower highs and O columns make higher lows, squeezing the range. ChartSchool is specific that a trendline break is not enough; a triangle only resolves on a double top breakout or double bottom breakdown. Short triangles (four columns) after a sharp move lean toward continuation, while large ones (six or more columns) lean toward reversal.
A catapult is a breakout that survives a test: a triple top breakout, a pullback back into the pattern that does not break the pattern low, and then a fresh double top breakout. Many point and figure traders consider it one of the stronger signals because it shows buyers absorbing the pullback.
Price Objectives From P&F Chart Counts
Point and figure charts are unusual because they come with a built-in way to project a price objective, called a count. There are two methods, and they measure different things.
Vertical count on a P&F chart
The vertical count measures the length of an important column, usually the breakout column. Multiply the boxes in that column by the box size and the reversal amount to get the extension. Add it to the column low for an upside objective, or subtract it from the column high for a downside one.
The catch is that a column keeps growing until it reverses. ChartSchool states that the box count is not fixed until a three-box reversal, and anything earlier is a preliminary count. The 27-close ES example (10-point box, 3-box reversal, breakout column 5 starting at 6,640) shows how far a preliminary count can travel.
| When the count was taken | Boxes in column 5 | Extension in points | Upside objective |
|---|---|---|---|
| Breakout on close 16 | 6 | 180 | 6,820 |
| Close 19 | 11 | 330 | 6,970 |
| Column complete on close 22 | 18 | 540 | 7,180 |
Nothing about the market changed between those rows. The column just kept filling. The objective moved 360 points, which is 1,440 ticks, or $18,000 per ES contract and $1,800 per MES contract. A trader who planned around 6,820 at the breakout was trading a number the chart had not finished producing. The count only became fixed when close 24 (6,780) reversed the column.
Jeremy du Plessis adds an activation step: once the count column is complete, its high becomes the trigger, and the upside count only counts once price breaks it. In that ES build the activation point is 6,810, and the open column 7 at 6,790 has not reached it yet.
Horizontal count from chart congestion
The horizontal count measures width instead of height. Count the columns in a congestion area of at least five columns, multiply by box size and reversal amount, and add the result to the pattern low. In the 27-close ES example (10-point box, 3-box reversal), the triple top spans columns 1 to 5, so the count is 5 times 10 times 3, or 150 points, added to the 6,620 pattern low for an objective of 6,770. Price reached it on close 21 (6,790).
The vertical count on that same ES build, taken on the completed 18-box breakout column from 6,640, came to 7,180. Put the two methods side by side and they disagree by 410 points, 7,180 vertical against 6,770 horizontal. Neither is wrong. They measure different things, and ChartSchool is blunt that objectives are rough estimates with no guarantee price reaches them. If two honest methods disagree by that much, neither one is a target you should size a trade around.
The two-thirds convention for bearish chart counts
Some practitioners shrink downside counts. Tom Dorsey multiplies by two thirds of the reversal amount on bearish vertical counts (2 instead of 3 on a three-box chart), and A.W. Cohen used a two-thirds extension on bearish horizontal counts. In ChartSchool's own example, a 14-box column with a 0.50 box gives a 21-point extension, which puts the downside objective at 29 on the full count and 36 on the two-thirds count. Check which convention your platform applies before you compare its objective with your own math.
Stops and Exits on a P&F Chart
A point and figure signal gives you an entry. It does not size the trade, and the chart's own exits can sit a long way from the entry once you convert boxes into money. Work out the stop before the signal fires. After it fires, the temptation is to move the stop to wherever the loss feels tolerable.
ChartSchool's guidance is that a move under the pattern low negates a bullish breakout, and the box just under the pattern low often marks the worst case for a pattern failure. In the 27-close ES example (10-point box, 3-box reversal), the buy signal printed at 6,690 and the pattern low was 6,620. That gives three exit references:
| Exit reference | Price | Distance from 6,690 entry | Per ES contract | Per MES contract |
|---|---|---|---|---|
| Box under the pattern low | 6,610 | 80 points, 320 ticks | $4,000 | $400 |
| First P&F sell signal (double bottom under 6,630) | 6,620 | 70 points, 280 ticks | $3,500 | $350 |
| Reversal exit after the run | 6,780 | 90 points of gain, 360 ticks | $4,500 gain | $450 gain |
Those first two rows are the risk side. Against an 80-point stop, the horizontal objective at 6,770 offered 80 points of reward, roughly one to one before commissions and slippage. The vertical count looked far better, but the full 7,180 figure only existed once column 5 had finished growing, long after the entry.
The give-back built into a chart reversal
Point and figure charts confirm a turn late by design. In the ES build the highest close was 6,810 on close 22. The chart did not show a reversal until close 24 at 6,780, because that was the first close 30 points under the top box. A trader using the three-box reversal as a trailing exit would have captured 90 points from 6,690 and given back 30 points (120 ticks) from the peak close, which is $1,500 per ES or $150 per MES.
Scale the box up and the give-back scales with it. That is the real tradeoff behind every box size. A bigger box filters more noise, and it also leaves more on the table before it admits the move is over.
On a prop evaluation or simulated funded account with a trailing drawdown, open profit you give back still moves you toward the limit, so size for the full distance to the chart's exit, not the distance you hope price travels.
Related lesson: Position sizing
How Box Size Changes a Point and Figure Chart
The box size decides how many columns you see, how many signals print and what the counts say. To show how much, here is the same 27-close ES series (close method, 3-box reversal) rebuilt at five box sizes. It is a constructed, illustrative series, not market data.
| Box size in points | Columns | Buy signals | Vertical objective | Horizontal objective |
|---|---|---|---|---|
| 5 | 7 | 2 | 7,185 | 6,695 |
| 10 | 7 | 1 | 7,180 | 6,770 |
| 20 | 3 | 1 | 7,180 | None, under five columns |
| 30 | 1 | 0 | None | None |
| 50 | 1 | 0 | None | None |
Three things stand out in this ES sweep.
The vertical count barely moved, from 7,180 to 7,185. Smaller boxes made the breakout column longer in boxes at exactly the rate they made each box smaller, so the measured distance stayed almost the same.
The horizontal count moved a lot, from 6,695 at a 5-point box to 6,770 at a 10-point box, and it vanished at 20 points because the congestion shrank to three columns. Width-based counts are far more sensitive to your setting than height-based ones.
Small boxes add signals, and extra signals are not free. At the 5-point box, column 3 printed a double top breakout at 6,685 on close 12, one box over the 6,680 high. Closes then fell to 6,625 on close 14, a 60-point dip, which is $3,000 per ES or $300 per MES against anyone who took it. Large boxes delete signals entirely: at 30 and 50 points, the whole 190-point range from 6,620 to 6,810 drew a single column and no signal.
Futures chart box sizes and the tick grid
Two common box-sizing habits break on futures. The first is the traditional scaling table, which was built for stock prices. As of November 2026, StockCharts' version assigns a 50.00 box to anything priced from 1,000 to 25,000, so ES near 6,690 gets a 50-point box. With a three-box reversal that is a 150-point move against you before the chart even admits a turn, or $7,500 per ES contract.
The second is percentage scaling. One percent of 6,690 is 66.90 points, which is 267.6 ticks and not a price ES can trade at. TradingView rounds percentage boxes to the nearest tick, so the platform would use 67.00 (268 ticks), and your hand calculation will be slightly off unless you round the same way. A 67.00 box with a three-box reversal is 201 points, or $10,050 per ES contract, which is far too coarse for an intraday chart.
The fix is simple. Choose a fixed box in whole ticks, sized so a normal session fills several boxes. Then record it next to every chart, signal and count you keep, because none of those numbers means anything without the box that produced them.
Related lesson: Tick size and tick value
Which Timeframes and Markets Suit Point and Figure Charts
Point and figure charts have no fixed timeframe. How much history the chart covers depends on the box size, the reversal amount and the data interval feeding it. ChartSchool's rough guidance, built on stocks, gives the scale:
- Daily data, 1% box, three-box reversal: generally 9-24 months of history, suited to long-term analysis.
- 60-minute data, 0.50% box: typically 3-9 months, a medium-term view.
- 15-minute data, 0.25% box: around one month for many securities.
Shrink the box and the interval and the chart becomes a short-term tool; enlarge them and it becomes a position-level map. A common way to use that is to start with the longest look-back to set the bigger trend, then drop down to a faster point and figure chart for signals in the same direction.
The method applies to any liquid market with a continuous price: stocks, indexes, futures, currencies. It suits trend and breakout traders best, because its signals are breakouts. It suits mean-reversion and scalping styles poorly, because by the time a three-box reversal confirms, a short-term fade is often already over.
What point and figure chart research found
The evidence on point and figure signals is thin and mixed. One of the few peer-reviewed tests, by Anderson and Faff in the International Review of Financial Analysis (2008), applied eight objective point and figure rules to S&P 500 futures tick data from 1990 to 1998, with boxes of 0.4 and 0.8 index points and three- to five-box reversals. The smallest filter made 34,977 trades and turned a gross profit of $2,914,600 into a net loss of $583,100 after $100 round-turn costs. Most settings won on fewer than 43% of trades, and the authors found that neither gross nor net profits were significantly different from zero in their t-tests, with profits concentrated in high-volatility years.
The takeaway is not that the chart is useless. A small box on a fast market generates enough trades for costs to swamp the signal, and no published result lets you treat point and figure signals as an edge without testing them on your own market and settings.
On our accounts, Tradovate's chart module lists Point and Figure among its chart styles, and every position has to be closed by 4:45 PM ET with no overnight or swing holds. So a daily point and figure chart can frame the larger trend for an ES or MES trade, but the entry, the stop and the exit all have to fit inside one session.
Related lesson: Multiple-timeframe analysis
Point and Figure vs Renko and Candlestick Charts
Point and figure charts belong to the family of price-only charts, alongside Renko, Kagi and line break charts, which all ignore time and react only to price movement. The useful comparison for most traders is against Renko, its closest cousin, and against the candlestick chart they already use.
| Chart type | What adds a new mark | Time axis | Strength | Weakness |
|---|---|---|---|---|
| Point and figure | Price filling a box, with columns flipping on the reversal amount | No | Clear levels, objective patterns, built-in counts | Late signals, no exact prices, counts that move |
| Renko | Price moving more than one fixed brick size beyond the last brick | No | Clean trend view with one setting | One brick per column, so no column widths to count |
| Candlestick | Every time interval closing | Yes | Exact open, high, low, close and timing | More noise, levels need judgment |
The practical pairing is to read structure on the point and figure chart (where the range is, whether the breakout is real, how wide the base was) and read prices, stops and position size on a candlestick chart, where every level is a price that actually traded. They answer different questions, so you do not have to pick one.
Related lesson: Renko charts
Point and Figure Chart FAQ
What is a point and figure chart?
It is a chart made of alternating columns of Xs for rising prices and Os for falling prices, with no time axis. A mark is added only when price moves by the box size, and a new column starts only when price reverses by the reversal amount, usually three boxes.
How do you create a point and figure chart?
Pick a box size, a reversal amount and a pricing method (close or high-low). Then add an X or O each time price fills another box in the current direction. Start a new column when price moves against the column by the full reversal distance.
What box size should you use?
Use a box that is a whole number of ticks and small enough that a normal session fills several boxes. A box roughly 1% of price is a common starting point on daily charts, but futures day traders usually need much smaller boxes. Record the box with every chart, because counts and signals depend on it.
What are the limitations of point and figure charts?
Signals arrive late, because a reversal must complete before the chart shows a turn. Exact prices and timing disappear inside the boxes. Price objectives move until a column reverses. Anderson and Faff's 2008 study of S&P 500 futures found the rules' profits were not statistically different from zero.
Is a point and figure sell signal the mirror of a buy signal?
Mechanically, yes. A buy signal is an X column rising past the prior X column high, and a sell signal is an O column falling past the prior O column low. Some methods shrink downside counts to two thirds, so the projected objectives are not always symmetrical.
What is the difference between a point and figure chart and a Renko chart?
The main difference is structure. Both drop time and react only to price moves of a set size, but point and figure stacks many boxes in alternating X and O columns with a reversal rule, which gives it pattern widths and counting methods. Renko places one fixed-size brick per column.
Point and Figure Chart Trading Risk
Point and figure charts are an analysis tool, not a prediction, and the worked ES series and every figure built from it are constructed examples for illustration only, not a record of real prices or results. Futures are leveraged, so a move of a few boxes can cost far more than expected, and stop orders can fill beyond their price in fast markets. Evaluation and funded accounts are simulated, and nothing here is investment advice or a recommendation to trade.


