




TL;DR: Renko charts draw a fixed-size brick only when price travels a set distance, so time and small moves drop off the chart. A reversal needs two bricks, so a 3.00 point brick means a 6.00 point move and a 6.00 point stop. Brick size comes from a fixed value, ATR or a percentage, and the last two can repaint. Brick prices are synthetic, so fills and backtests must use real traded prices.
What Renko Charts Are and Why They Ignore Time
Renko charts plot price change as a series of bricks of one fixed size and leave time out of the horizontal axis. The name comes from renga, the Japanese word for brick, and the chart sits in the same family as point and figure, kagi and three line break charts, which all draw only when price has moved far enough to matter.
Most traders arrive at renko after too many hours reacting to every wiggle on a 1-minute chart. On a candlestick or bar chart, every period gets a bar whether anything happened or not. A dead lunch hour gets twelve five-minute candles just like a busy open. A renko chart gives that same lunch hour nothing at all if price never travelled a full brick, and gives a fast news move several bricks in a row.
Three placement rules make the chart look the way it does:
- Every brick on the chart is the same size.
- Bricks touch at the corners and step up or down at a 45-degree angle.
- A vertical column never holds more than one brick, so the chart reads as clean diagonal runs.
That is the whole idea. A renko chart answers one question: has price travelled far enough to count? The chart moves only when price does. Everything else in this guide, from brick size to backtesting, is a consequence of that single threshold.
How Renko Charts Build Bricks
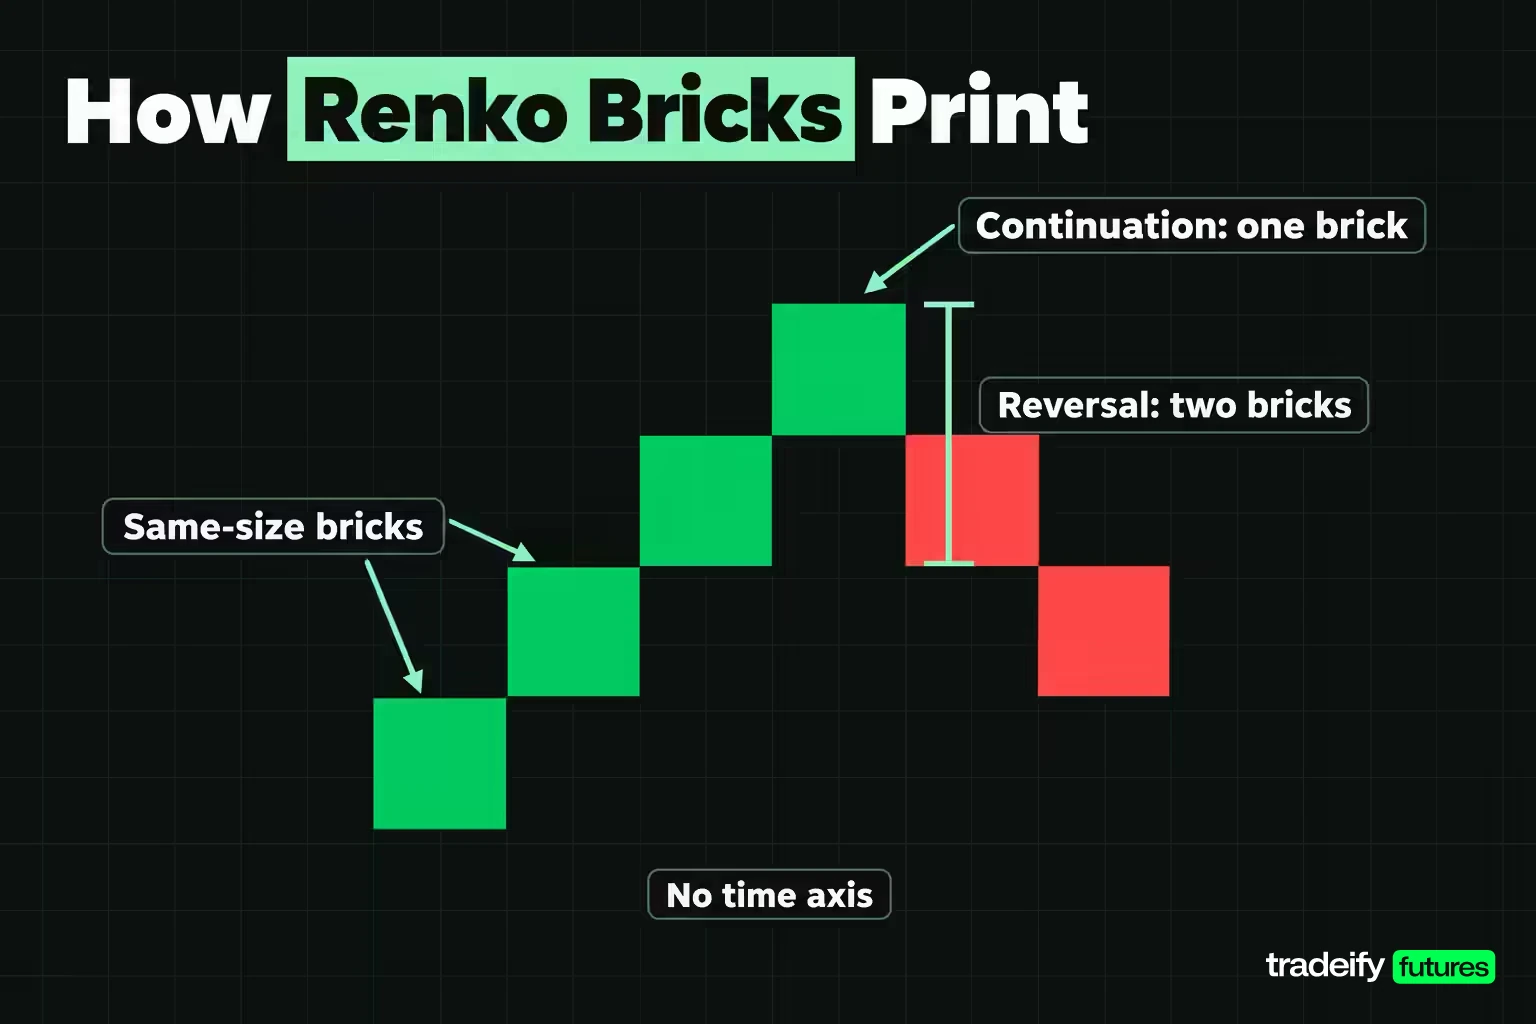
Renko charts add a brick only when price clears the edge of the last brick by one full brick size. Anything less is ignored. On a 3.00 point brick, a 2.90 point move leaves the chart exactly as it was, which is the filter doing its job.
The direction of the next brick changes how far price has to go:
- Continuation. A brick in the same direction as the last one needs one brick size of travel beyond the last brick's far edge.
- Reversal. A brick in the opposite direction needs price to retrace the whole last brick and then clear a full brick on the other side, which is two brick sizes from the last close.
- Multiple bricks. If price travels two or three brick sizes in one interval, two or three bricks print at once.
A Brick-by-Brick Renko Walk
The walk below uses illustrative closes on the Micro E-mini S&P 500 (MES) with a 3.00 point brick, built from closing prices. One MES point is worth $5, so each brick is 12 ticks, or $15.00 per contract, of travel. The starting brick is an up brick from 7,590.00 to 7,593.00.
| Interval close | What the renko chart does | Why |
|---|---|---|
| 7,594.75 | Nothing | Price is 1.75 points above the last brick, short of the 3.00 needed |
| 7,596.00 | One up brick, 7,593.00 to 7,596.00 | Price cleared the top edge by a full brick |
| 7,602.50 | Two up bricks, 7,596.00 to 7,599.00 and 7,599.00 to 7,602.00 | Price cleared two full bricks in one interval; the extra 0.50 is ignored |
| 7,598.00 | Nothing | A down brick needs a close at or below 7,596.00 |
| 7,595.25 | One down brick, 7,599.00 to 7,596.00 | Price retraced the top brick and cleared a full brick below it |
| 7,593.00 | One down brick, 7,596.00 to 7,593.00 | Continuation lower needs only one more brick |
Notice what the chart never showed. The 7,602.50 high is gone, because the extra half point did not complete a brick. The pullback to 7,598.00 is gone too. A trader looking only at the bricks sees two up bricks and two down bricks with no sign of where price actually peaked.
The Two-Brick Reversal Rule in Points
The two-brick reversal is the rule traders most often misread, and it carries a cost. On a 3.00 point brick, a continuation needs 3.00 points and a reversal needs 6.00 points. By the time a reversal brick appears, price has already moved twice the brick size against the old direction.
That 6.00 points is also the natural distance between a reversal entry and a stop at the opposite extreme, which is why brick size feeds straight into risk. A trader who treats the reversal brick as an early signal is usually reacting to a move that is already a full two bricks old.
Close Versus High-Low as the Renko Source
Most platforms build renko bricks from the close of a chosen interval, so a 10-minute renko chart uses 10-minute closes and locks bricks in only when each interval ends. Some let you build from the high and low instead. That puts two data points per period into play, which adds bricks and makes the chart noisier.
The interval matters as well. Shorter intervals track the real price path more closely, and accurate renko construction needs tick data. Two traders with the same brick size can see different charts simply because one builds from 1-minute closes and the other from 15-minute closes.
Renko Box Types and Brick Calculation Methods
Renko box types differ in how the brick size is set and whether it stays fixed. Platforms use slightly different labels, but four methods cover most of what you will see.
| Method | How the brick size is set | Main trade-off |
|---|---|---|
| Traditional (fixed) | You enter an absolute size in points, ticks or pips | Easy to anticipate where the next brick prints, but the right value takes trial on each instrument |
| ATR | The average true range of the underlying time chart, 14 periods by default on common platforms | Adapts to volatility, but the brick size changes as ATR changes, so the chart can redraw |
| Percentage of price | A percentage of the latest close, rounded to the tick; 1% is a common default | Scales across price levels, but recalculating from the latest close can repaint history |
| Acceptable risk | Work backwards from the stop you can afford on a reversal | Ties the setting to money rather than looks, and usually produces the smallest bricks |
Some platforms add their own variants. Sierra Chart, for example, lists Renko, Aligned Renko and Flex Renko bar types, each set in ticks. Period close boxes, which build from the close of a fixed period such as a day, are another variant some brokers offer.
The method you choose decides how stable the chart is. A fixed brick never moves under your levels. An ATR brick can be 12.05 points on one day and 20.55 on another for the same index, which means bricks you marked yesterday may not match today's chart. That is not a flaw if you know it happens; it is a problem if you draw levels on the bricks and expect them to stay put.
Related lesson: ATR
How to Choose a Renko Brick Size
The renko brick size works like a timeframe setting: it decides how much detail survives. The trouble is that published guidance points in very different directions.
One method teaches a brick between 0.25% and 1% of the instrument's value. On an index at an illustrative 7,600, that is 19.00 to 76.00 points. One platform's help page suggests about one twentieth of the instrument's value for fixed bricks, which would be 380.00 points at the same level. Those two rules sit a factor of 20 apart at the low end. Meanwhile an intraday futures trader might use a 3.00 point brick, which is 0.039% of 7,600.
None of these numbers is wrong. They describe different jobs, and copying one without knowing which job it was built for is how traders end up with a chart that looks great and a stop they cannot afford. A 380-point brick filters out almost everything except major swings. A 3.00 point brick prints many times a session and filters very little. The useful question is not "what is the best brick size" but "what move do I want the chart to ignore, and can my account carry the stop that comes with it?"
Renko Brick Size Sets the Stop and the Position Size
Because a reversal needs two bricks, the structural stop on a reversal trade sits at least two brick sizes from entry. On a futures contract, that converts the brick setting directly into dollars per contract before you look at a single setup.
The table uses MES ($5 per point, 0.25 point tick worth $1.25) and an illustrative $50,000 account risking 0.5% per trade, a budget of $250.
| Brick size | Reversal stop | Stop in ticks | Risk per MES contract | Contracts | Risk taken |
|---|---|---|---|---|---|
| 2.00 points | 4.00 points | 16 | $20.00 | 12 | $240.00, 0.48% |
| 2.50 points | 5.00 points | 20 | $25.00 | 10 | $250.00, 0.50% |
| 3.00 points | 6.00 points | 24 | $30.00 | 8 | $240.00, 0.48% |
| 4.00 points | 8.00 points | 32 | $40.00 | 6 | $240.00, 0.48% |
| 5.00 points | 10.00 points | 40 | $50.00 | 5 | $250.00, 0.50% |
| 6.00 points | 12.00 points | 48 | $60.00 | 4 | $240.00, 0.48% |
Read it as a size map, not a recommendation. Doubling the brick from 3.00 to 6.00 points halves the position from eight contracts to four on the same budget. Rows that floor below the budget leave $10.00 unused, which is the rounding cost of whole contracts. If a brick size implies a stop that cannot fit even one contract inside your loss limit, that setting does not fit the account, however clean the chart looks.
Related lesson: Position sizing
A Renko Brick Size Routine You Can Repeat
- Measure the instrument's recent average true range on the time chart you normally use, and set a first candidate brick as a fraction of it.
- Compare that candidate with the percentage method on the same day so you know where it sits.
- Convert the brick into a reversal stop in ticks and dollars per contract, and check it against your risk limit.
- Keep one brick size for a full sample of trades. Changing it after a losing streak redefines the setup, so the sample stops describing anything.
- Re-check the setting when volatility shifts. A fixed brick that filtered well in a quiet month can print constantly in a volatile one.
Advantages of Renko Charts
Renko charts earn their place for a few specific jobs. Each benefit comes straight from the brick threshold.
- Noise filtering. Moves smaller than one brick never appear, so the back-and-forth that crowds a 1-minute candlestick chart drops out.
- Trend visibility. A run of same-colored bricks is an unambiguous record that price kept travelling one way by at least the brick size each step. Higher highs and higher lows are easy to read.
- Cleaner support and resistance. Ranges show up as bricks stacking between two levels, and the edges of those ranges are easy to mark.
- A fixed unit of risk. Because every brick is the same size, stops and targets can be expressed in bricks, which keeps planning consistent from one trade to the next.
- Activity-scaled detail. Busy periods get more bricks and quiet periods get fewer, so the chart's density follows the market instead of the clock.
The common thread is that renko charts decide for you what counts as a move. That is the benefit, and it is also where most of the limitations come from, because the chart cannot tell you what it decided to leave out.
Limitations of Renko Charts and the Repainting Problem
Renko charts throw information away on purpose, and some of that information matters. The main costs:
- Lag. Every brick confirms a move that already happened, and a reversal brick confirms a move two bricks old.
- No open, high, low or close. A brick tells you price crossed a threshold. It does not show wicks, the period's extreme or where the close actually sat.
- No time axis. You cannot see the session open, a data release or how long a range lasted just by looking at the bricks.
- Gaps and fast moves. A gap of several brick sizes prints several bricks at once, which can look like a smooth trend when price actually jumped.
- Volume alignment. Volume is attached to bricks rather than periods, so it is harder to compare across the chart.
Projection Bricks and Repainting on Renko Charts
Renko charts can change after you look at them, in two ways. The first is the projection brick. On an intraday interval, a platform may show a provisional brick while the interval is still open because the current price has moved toward the next threshold. If price pulls back before the interval closes, that brick never becomes real, and projection bricks are lost when the chart is reloaded.
The second is the brick size itself. Under the ATR or percentage methods, the size is recalculated as new data arrives, and history can redraw with the new size. A level you marked at a brick edge may not sit at a brick edge tomorrow. A fixed brick size avoids this, which is one reason many traders who rely on renko keep it fixed.
Why Renko Backtests Mislead
Renko brick prices are synthetic. A brick edge at 7,596.00 is a threshold the platform calculated, not necessarily a price anyone traded at a specific moment. One major platform states plainly that backtesting orders filled at renko chart prices will inevitably be inaccurate, and another warns that renko and point and figure backtests can differ from real-time results because of how the bars are built.
The workable approach is to generate signals on the renko chart but record every entry, stop and exit against the real traded price series on a time chart. Any renko equity curve that assumes fills at brick prices is measuring the chart's arithmetic, not trades you could have taken.
Related lesson: Backtesting
Renko Chart Patterns Worth Reading
Renko chart patterns are the same shapes traders look for on time charts, drawn with less clutter. A few come up again and again.
- Two-brick reversal. A run in one direction followed by bricks in the other. In a trend it marks a pause or a change; near a level you marked in advance it carries more weight than in open space.
- Ranges. Bricks alternating between two levels mark support and resistance. Because small moves are filtered, the range edges are usually easier to see than on a candlestick chart.
- Breakouts. Bricks starting to print in one direction after a range are the renko version of a breakout.
- Double tops and bottoms, head and shoulders. Classic reversal shapes can be read on bricks, and they often look cleaner than on time charts.
- Flags. A short counter-trend run of bricks inside a larger trend, followed by a reversal back in the trend direction, reads as a flag.
Two cautions apply to every renko chart pattern. First, a pattern on bricks has no time dimension, so a double bottom built over three hours and one built over three days look identical. Second, the pattern exists only at the brick size you chose. Change the brick and the same price history can show a completely different shape, so a pattern is only as meaningful as the setting behind it.
Related lesson: Support and resistance
Using Indicators on Renko Charts
Indicators on renko charts are calculated from bricks, not periods, and that changes what they mean. A 10-period moving average on a renko chart is the average of the last 10 bricks. Those 10 bricks might span twenty minutes in a fast market or two days in a slow one.
That has practical consequences:
- Moving averages. Because small moves are already filtered, many renko traders use shorter averages than they would on a time chart. Price staying above a short average while bricks print one color is a common trend filter.
- RSI and other oscillators. An overbought or oversold reading on bricks measures how many bricks in a row went one way, not how stretched price is over a period of time. The value will not match RSI on the candlestick chart behind it.
- MACD. Crossovers come from brick-based averages, so they tend to arrive after a run of bricks rather than at a specific time.
- Time-based tools. Indicators that depend on time, such as session VWAP or Bollinger Bands built on periods, lose much of their logic on renko and are often better read on a companion time chart.
The rule that keeps this honest: re-test any indicator setting on renko data instead of copying a value that worked on candlesticks. Fibonacci retracements and drawn levels transfer more cleanly, because they depend on price levels rather than elapsed time.
Related lesson: RSI
Renko Trading Strategies With a Worked Example
Renko trading strategies fall into three broad groups, and each leans on the brick threshold in a different way.
- Trend following. Stay with a run of same-colored bricks and exit on a reversal brick or a close through a short moving average. Brick size is the main lever: a larger brick holds through bigger pullbacks but gives back more before the exit.
- Range trading. Fade the edges of a range that bricks have marked, with stops beyond the edge. This works only if the brick size is small enough to show the range at all.
- Breakouts. Act when bricks start printing out of a range in one direction. The catch is that breakouts are often about timing, and renko charts hide timing.
Whichever renko approach you use, the entry route decides how much of the stop-to-target distance you put at risk, and that choice can be priced in advance.
Worked Renko Example on the Micro E-mini S&P 500
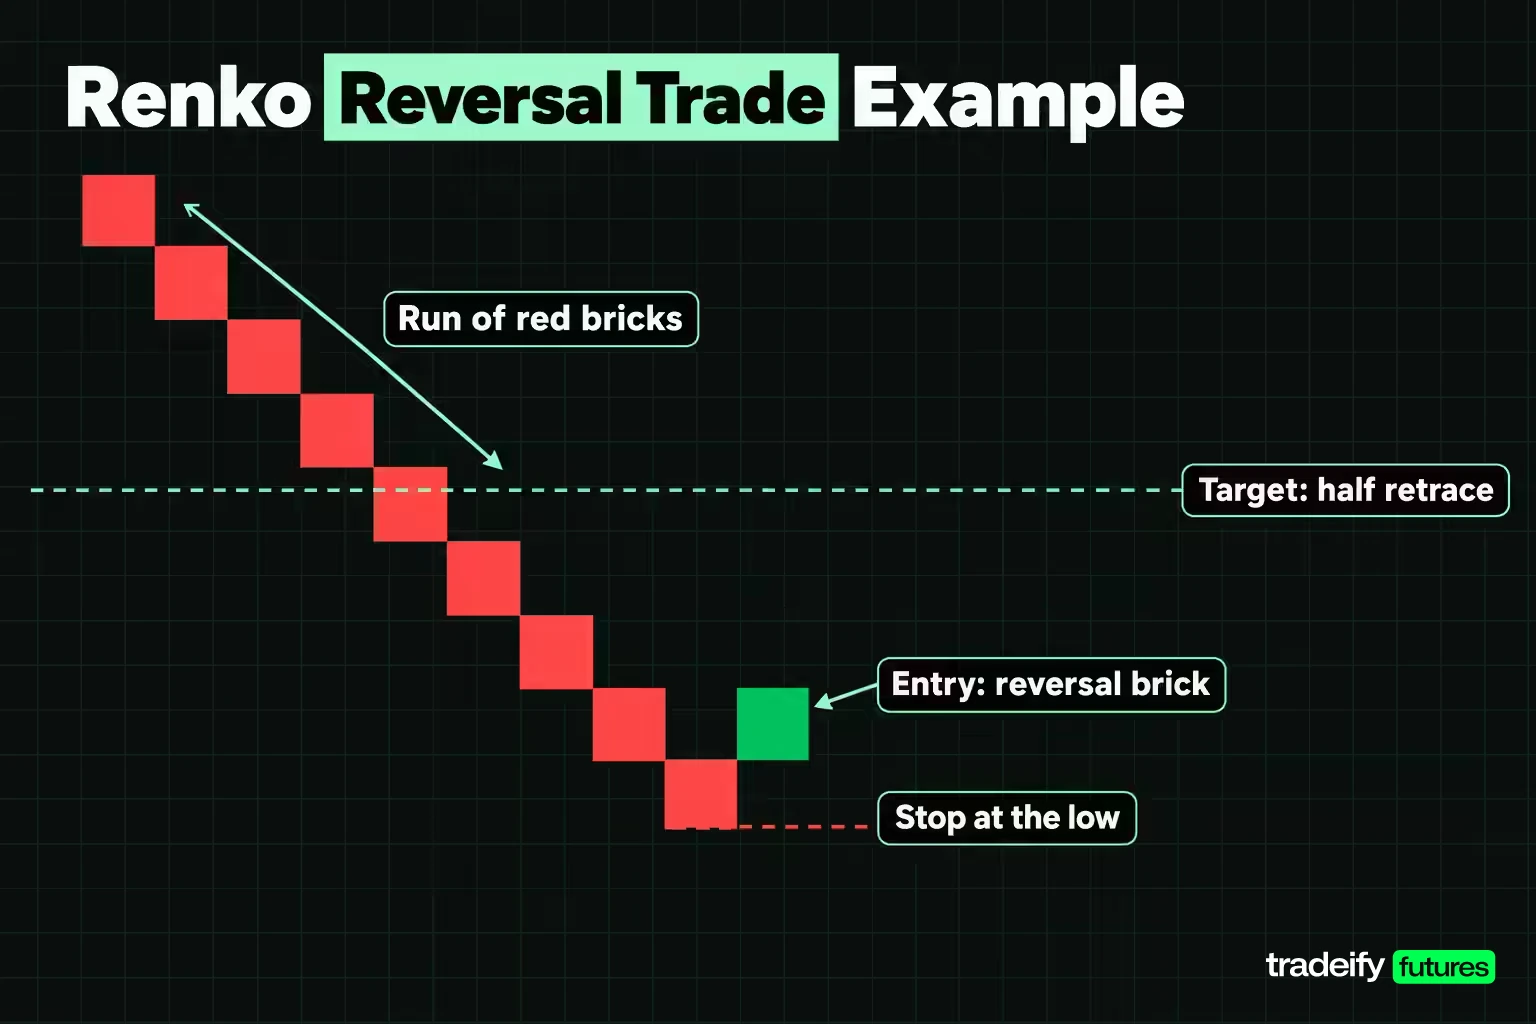
The sequence is illustrative. MES declines from 7,614.00 to 7,590.00 on a 3.00 point brick, a 24.00 point drop that prints eight red bricks. The last red brick runs from 7,593.00 to 7,590.00. A green reversal brick needs a close at or above 7,596.00.
For a long, the structural stop is the 7,590.00 low, since a move back below it means the reversal failed. The target is the 50% retrace of the decline at 7,602.00. So the stop-to-target block is fixed at 12.00 points, 48 ticks or $60.00 per contract. What changes with the entry route is how much of that block you are risking.
| Entry route | Entry | Risk | Risk per contract | Reward | Reward to risk | Break-even win rate |
|---|---|---|---|---|---|---|
| Reversal brick | 7,596.00 | 6.00 points, 24 ticks | $30.00 | 6.00 points | 1.00 | 50.00%, 52.50% with costs |
| One more brick of confirmation | 7,599.00 | 9.00 points, 36 ticks | $45.00 | 3.00 points | 0.33 | 75.00%, 77.50% with costs |
| Limit at the reversal brick midpoint | 7,594.50 | 4.50 points, 18 ticks | $22.50 | 7.50 points | 1.67 | 37.50%, 40.00% with costs |
The "with costs" figures assume an illustrative $1.50 round-turn cost per contract, added to the dollar risk and divided by the full $60.00 block.
What the Renko Entry Comparison Shows
In the MES renko example, the three entry routes share one stop at 7,590.00 and one target at 7,602.00, so only the risk changes. Waiting for one more brick feels safer, especially after a reversal or two has failed on you, and that is exactly the temptation to price. It risks 9.00 points instead of 6.00, which is 50% more money, and needs to win three times in four just to break even before costs. Confirmation here is not free patience; it moves the setup from a coin toss to one that has to be right most of the time.
The limit route goes the other way. Resting a buy at 7,594.50 cuts risk to 4.50 points and the break-even rate to 37.50%, but it fills only if price pulls back 1.50 points from the reversal threshold first. A low break-even rate on a fill you may never get is not the same as an edge.
Position size follows the same pattern on the illustrative $250 budget: eight contracts on the reversal route ($240.00), five on the confirmation route ($225.00) and eleven on the limit route ($247.50). One more honest caveat: on a close-based chart, a market order sent when the reversal brick prints fills at the actual market price, which may already sit above 7,596.00. The brick edge is the plan, not the fill.
Related lesson: Risk reward ratio
Common Renko Chart Mistakes
Most renko chart mistakes come from treating bricks as if they were ordinary price bars. The table pairs each one with the rule that catches it.
| Mistake | Why it happens | Rule that catches it |
|---|---|---|
| Reading a brick edge as a traded price | A brick is a threshold marker, not a print at a specific time | Plan entries and stops against levels on the underlying time chart |
| Backtesting at brick prices | Synthetic brick prices cannot represent fillable orders | Generate signals on bricks, record executions on real prices |
| Trading a projection brick | An unfinished brick moves with price and can vanish on reload | Treat the newest brick as provisional until its interval closes |
| Choosing a brick that is too small | A tiny brick prints constantly and filters almost nothing | Compare the brick with the instrument's average range |
| Choosing a brick that is too large for the account | A large brick forces a wide reversal stop | Convert the brick into dollars per contract before trading it |
| Changing brick size after losses | Each change redefines the setup | Fix one brick size per sample and log why it was chosen |
| Copying indicator values from candlesticks | Renko indicators are computed from bricks | Re-test settings on brick data |
| Using renko in isolation | The chart hides time, wicks and session context | Keep a time chart open beside the renko chart |
The last row is the one that costs the most. A renko chart cannot show you that a data release is five minutes away or that the session is about to close. If timing matters to your plan, it has to come from somewhere other than the bricks.
Related lesson: Trading journal
Renko Charts Compared With Other Chart Types
Renko charts are one answer to a question every chart type answers differently: what should the horizontal axis measure?
| Chart type | What the x axis measures | Keeps time | Typical use |
|---|---|---|---|
| Renko | Price travel in fixed brick sizes | No | Trend reading with small moves filtered out |
| Candlestick | Equal time periods | Yes | Open, high, low and close of each period; patterns and session behavior |
| Line | Equal time periods, closes only | Yes | Simple trend view without intrabar detail |
| Heikin-Ashi | Equal time periods, averaged candles | Yes | Smoothed trend reading that keeps the time axis |
| Point and figure | Price travel in boxes with a reversal setting | No | Columns of X and O for levels and breakouts |
| Tick chart | A fixed number of ticks per bar | Partly | Activity-based bars that still show open, high, low and close |
The switch most traders consider is renko versus candlesticks. Candlesticks keep every period's open, high, low and close and every price where it actually traded. Renko charts give up that information in exchange for a filter. If your plan is trend following, that trade can be worth making. If your plan depends on session timing, wicks or exact levels, the candlestick chart keeps information the bricks discard.
Heikin-Ashi is the closest alternative for traders who want smoothing but need the clock. Point and figure is the closest relative in construction, since it also ignores time and uses a reversal threshold.
Related lesson: Heikin-Ashi charts
Renko Chart Research and What It Shows
Research on renko-based trading is thin, recent and mostly short in sample. Three studies show the range.
- A 2025 University of Warsaw working paper tested pairs trading built on renko and kagi charts across US and Chinese equity indices, including the global financial crisis and COVID-19 periods. It reported significant excess returns and strong Sharpe ratios before costs, with profitability reduced once trading frictions were included and renko strategies holding up better in crises.
- A 2026 Springer conference paper tested an intraday renko and MACD system on 12 months of Indian equity data across 15 stocks, plus 60 days of live paper trading. It reported a 58.3% win rate, a 1.65 profit factor and walk-forward validation.
- A 2024 conference paper on the suitability of renko charts for algorithmic trading combined bricks with a neural network classifier on 50 high-volume stocks and ETFs, using renko mainly as a noise filter for the model's input.
Read these with the limits in mind, because a clean abstract is not a track record. Equity pairs and Indian single stocks are not the same as intraday index futures, 12 months is a short record, and none of the results can be transferred to a different brick size or instrument. The synthetic-price problem also applies to research: a study is only as good as how it priced its fills. These studies say renko can be a useful input in a tested system. They do not say a renko chart produces an edge on its own.
Renko Charts on TradingView, NinjaTrader, Sierra Chart and MT4
Renko charts are built into most modern charting platforms, but the settings differ, so the same brick size can draw a different chart on two platforms.
- TradingView. Renko is a chart type with ATR, Traditional and Percentage (LTP) brick methods, a choice of close or OHLC as the source, and projection bricks on intraday intervals.
- NinjaTrader 8. Renko is a bar type with a Brick size setting in ticks. A new brick prints when price exceeds the previous brick's high or low by the brick size.
- Sierra Chart. Renko, Aligned Renko and Flex Renko bar period types, set in ticks.
- MetaTrader 4. The built-in chart types are bar, candlestick and line. Renko on MT4 usually comes through an add-on or a broker-supplied tool rather than a native chart type.
- StockCharts and ProRealTime. Both offer renko for analysis, with fixed or ATR brick sizes on StockCharts.
Renko Settings to Match Across Platforms
When you move renko charts between platforms, check three settings before comparing them: the brick method, the price source (close or high-low) and the underlying interval. A mismatch in any one of them explains most "my renko chart looks different" questions.
On our accounts, renko is available in WealthCharts, which lists Renko among its bar styles and includes Chart Replay for practice on historical data, and in Quantower over a Rithmic connection. TradingView works only through the Tradovate connection. Because renko charts hide the clock, keep a time chart or alert in view: all positions on our accounts must be closed by 4:45 PM ET on regular trading days, and no position is held overnight.
Renko Charts FAQ
What are renko charts?
Renko charts plot price as bricks of one fixed size and ignore time. A new brick prints only when price travels a full brick beyond the last one, or two bricks to reverse. Quiet periods leave the chart unchanged and busy periods add several bricks.
How do renko bricks form?
Price has to clear the edge of the last brick by a full brick size. With a 3.00 point brick and a last up brick from 7,590.00 to 7,593.00, a close at 7,596.00 adds an up brick. A down brick needs a close at or below 7,587.00.
What is the best brick size for renko charts?
The best brick size is one that filters the moves you want to ignore while its two-brick reversal stop still fits your risk limit. There is no universal value, and published rules conflict, so start from the instrument's volatility. Keep it fixed for a full sample before judging it.
Do renko charts repaint?
They can. Projection bricks on an open interval can disappear, and ATR or percentage brick sizes recalculate and can redraw history. A fixed brick size on closed intervals avoids most of it.
Are renko charts good for day trading?
They can be, if the brick is small enough to print several times inside a session. The trade-off is that a small brick filters less, and the chart hides session timing, so day traders usually keep a time chart alongside it.
Are renko charts profitable?
No chart type is profitable on its own. A 2025 University of Warsaw working paper and a 2026 Springer conference paper report positive results on short samples, and the Warsaw paper found that trading costs reduce them. A renko backtest that fills at brick prices does not measure trades you could have taken.
Can you backtest with renko charts?
Only with care. Generate signals on the renko chart, but record every entry, stop and exit at real traded prices from a time chart, because brick prices are synthetic.
Risk Note for Trading With Renko Charts
This article is general education about how renko charts are built and how brick size affects risk. It is not investment advice or a recommendation to trade any product. Futures are leveraged, and losses can exceed what you expect; a stop order does not guarantee your exit price, and a fast market can fill far from a brick edge. Funded and evaluation accounts are simulated, and simulated results do not represent live trading. All prices, account sizes and costs in the examples are illustrative.


