




TL;DR: Three white soldiers and three black crows are three-candle reversal patterns that only count after a clear opposite trend. Soldiers are three tall bullish candles after a decline; crows are three tall bearish candles after a rise. A real one passes measurable tests on trend, body size, opens and closes, and most lookalikes fail them. Price the entry before you take it, because confirmation can cost more than it saves.
Three white soldiers and three black crows are the same three-candle staircase pointed in opposite directions. The soldiers climb out of a decline, and the crows step down out of a rise. Both get treated as strong reversal signals, and TradingView's screener files both under "Strong" reversal patterns.
The trouble is that three same-colour candles in a row show up constantly, and almost none of them are the pattern. The urge to call every red staircase a set of crows is strongest right after a sharp drop, which is exactly when the entry is worst. This guide turns the textbook description into seven tests you can measure, prices three different entries on one illustrative Micro E-mini S&P 500 setup, walks through a real crows formation on ES daily bars from September 2026, and lays out what the published research supports and what it does not.
What Three White Soldiers and Three Black Crows Mean
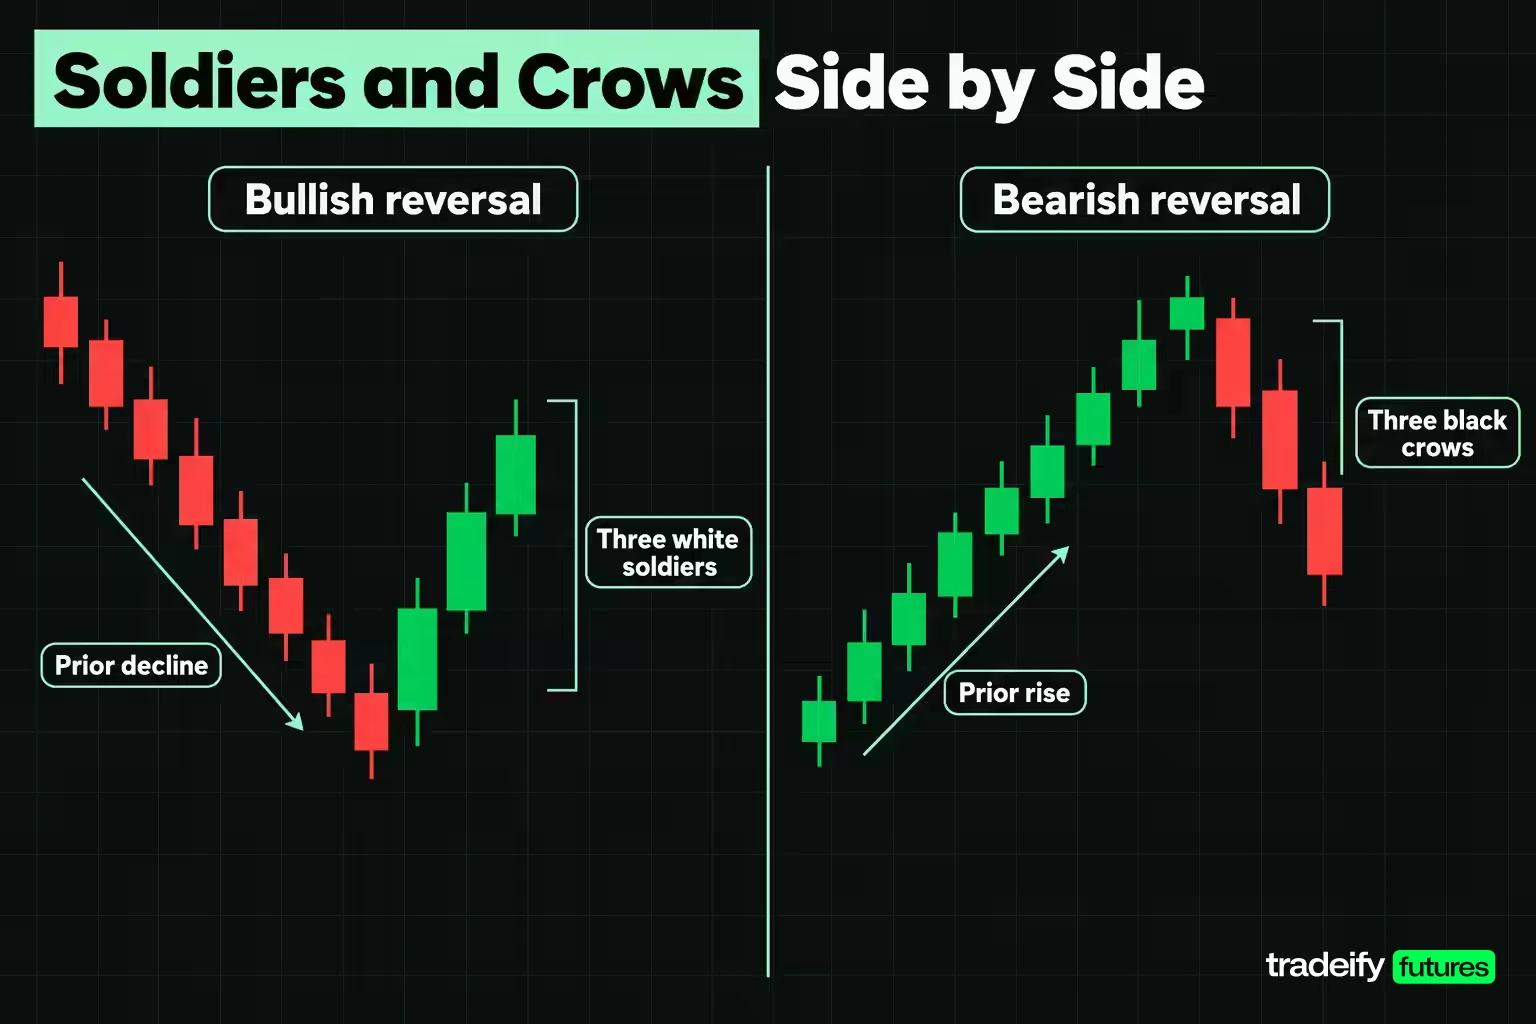
Three white soldiers is a bullish reversal pattern made of three tall bullish candles that appear after a downtrend. Each candle opens inside the previous candle's real body and closes near its own high, so every session ends with buyers in charge at the close.
Three black crows is the bearish version. It needs an uptrend first, then three tall bearish candles, with candles two and three opening inside the prior body and all three closing near their lows. Thomas Bulkowski's identification guidelines put it bluntly: not any three black candles in a downward price trend will qualify.
Both patterns make a narrow claim. They record that control changed hands across three sessions and that the change held into each close. They do not forecast how far the new move runs, and they say nothing at all if there was no trend to reverse.
What the pattern does give you is a location for being wrong. If price closes back beyond the far end of the three candles, the story of a handover is broken, and that level is where a trade built on it ends.
The names get mixed up often enough that a quick map helps.
| Name you will see | Direction | What it refers to |
|---|---|---|
| Three white soldiers | Bullish reversal after a decline | Three tall bullish candles, each opening inside the prior body and closing near its high |
| Three soldiers or three green soldiers | Bullish reversal after a decline | Short or colour-swapped names for three white soldiers |
| Three black crows | Bearish reversal after a rise | Three tall bearish candles, each opening inside the prior body and closing near its low |
| Identical three crows | Bearish reversal after a rise | A strict variant where candles two and three open near the prior close |
| Three black soldiers | Not a standard pattern | A mislabel; the bearish pattern is crows, not soldiers |
Why the Soldiers and Crows Patterns Form
The soldiers and crows patterns form when one side wins three sessions in a row and refuses to give anything back into the close. Take the crows. After a rise, the first bearish candle is easy to dismiss as profit-taking. The second one opens inside that red body, so buyers never even get a gap up to sell into, and price closes lower again. By the third candle, traders who bought the rise are sitting on losses, and their selling helps push the close down near the low a third time.
The soldiers run the same sequence after a decline. Short sellers cover, buyers step in, and each close lands near the high. The point of the pattern is persistence: three closes at the extreme, each one beyond the last.
Context changes the meaning. Bulkowski notes that three white soldiers appearing as an upward retrace inside a downtrend tend to see the downtrend resume. Three strong candles against a larger trend can be a pause, and a pause is not a reversal. That is why the trend test comes first in any qualification checklist.
How to Identify Three White Soldiers and Three Black Crows
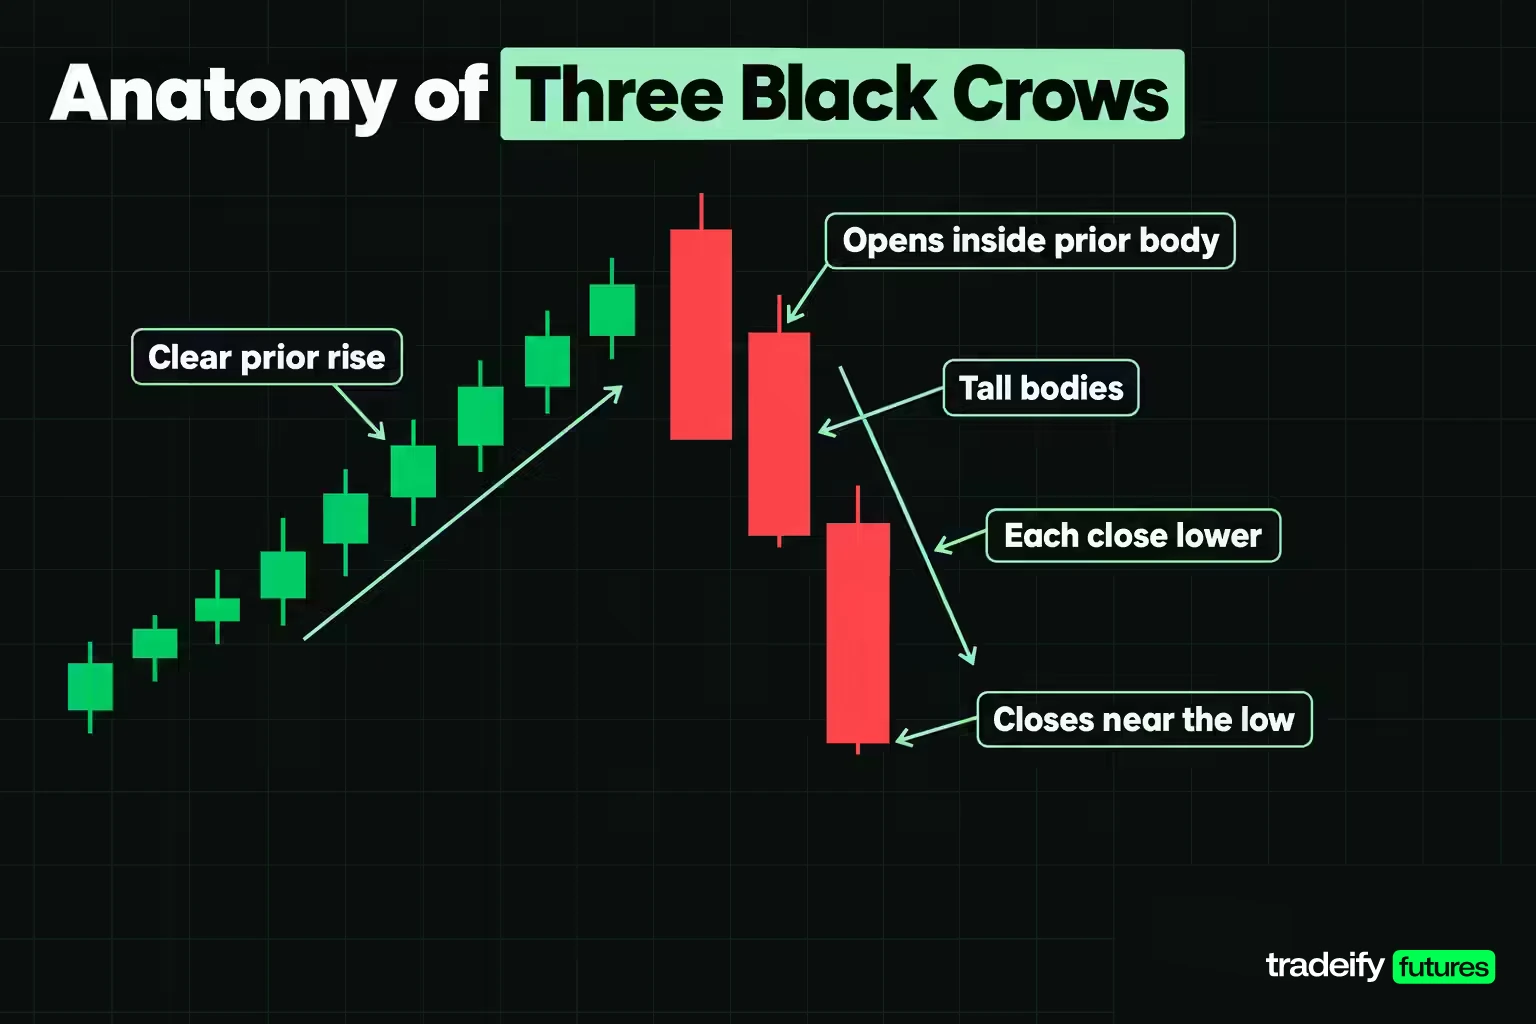
Identifying three white soldiers or three black crows reliably means writing the rules down as measurements, because a chart whose ending you already know will make almost any three candles look right. Seven tests cover it.
- Prior trend. A mechanically defined rise before the crows, or decline before the soldiers. If this fails, nothing else matters.
- Body length. Each real body is tall relative to recent candles, for example at least 1.0 times the average high-low range of the last 14 or 20 sessions. Three short candles in a quiet market are indecision, not control.
- Open inside the prior body. Candles two and three open between the previous candle's open and close rather than gapping clear of it.
- Close beyond the prior close. Every close is lower than the last for crows, higher for soldiers.
- Close near the extreme. Each close sits in the bottom quarter of the candle's range for crows, the top quarter for soldiers.
- Short opposing wick. A long upper wick on a crow, or a long lower wick on a soldier, means the other side was pushing back before the close.
- Body overlap. Consecutive bodies overlap rather than standing apart as isolated bars.
Fix your thresholds before you scan and keep them for the whole sample. Loosening the body rule because a candidate "almost" qualifies is the most common way traders talk themselves into a pattern, and changing the definition partway through a test is how a pattern study stops meaning anything.
Measuring an illustrative crows formation on MES
Here is a constructed three black crows formation on the Micro E-mini S&P 500 (MES), where one index point is worth $5 and the minimum tick of 0.25 points is worth $1.25. All prices are round illustrative levels, and the setup assumes a clear five-session rise into the pattern and a 20-session average range of 8.00 points.
- Candle 1 opens at 7,620.00, reaches 7,621.00, dips to 7,607.00 and closes at 7,608.00, a body of 12.00 points.
- Candle 2 opens at 7,612.00, inside candle 1's body, reaches 7,613.00, falls to 7,597.00 and closes at 7,598.00, a body of 14.00 points.
- Candle 3 opens at 7,602.00, again inside the prior body, reaches 7,603.00, falls to 7,584.00 and closes at 7,585.00, a body of 17.00 points.
Checking the MES crows candles against the seven tests
The illustrative MES crows candles line up against the seven tests like this.
| Test | Threshold | Measured on the illustrative candles | Soldiers version |
|---|---|---|---|
| Prior trend | A defined rise into the pattern | Five rising sessions assumed | A defined decline |
| Body length | Each body at least 1.0 times the 8.00 point average range | 1.50, 1.75 and 2.13 times | Same test on bullish bodies |
| Open inside prior body | Candles 2 and 3 open between the prior open and close | Both open 4.00 points above the prior close, inside the body | Same test, mirrored |
| Close beyond prior close | Each close lower than the last | 7,608.00, then 7,598.00, then 7,585.00 | Each close higher |
| Close near the extreme | Close in the bottom quarter of the range | 7.14%, 6.25% and 5.26% of the range off the low | Top quarter of the range |
| Short opposing wick | Upper wick under a fifth of the body | Upper wick of 1.00 point on each candle | Lower wick measured |
| Body overlap | Bodies overlap at every join | Overlap on both joins | Same test |
Every test passes. Notice that the trend, body and close-position tests do the heavy lifting, and any one of them can disqualify a candidate that looks fine at a glance. A formation this clean is rarer in practice than it looks. The real ES data later in this guide shows how often a two-year daily chart produces a formation this clean.
Soldiers and Crows Compared With Similar Candlestick Patterns
Soldiers and crows sit in a family of three-candle reversal patterns, and the differences come down to what the middle candle does and how strict the opens are. The morning star and evening star use a small middle candle that gaps away from its neighbours. The soldiers and crows use three tall candles with no pause in the middle. Identical three crows tightens the open rule so each candle opens near the previous close.
Bulkowski's published statistics, drawn from his own database and labelled as results from "perfect trades", put the patterns side by side. Ranks run out of 103 candle types, where 1 is best.
| Pattern | Trend before | Middle candle | Tested reversal rate | Overall performance rank |
|---|---|---|---|---|
| Three white soldiers | Down | Tall bullish | 82% | 32 |
| Three black crows | Up | Tall bearish | 78% | 3 |
| Identical three crows | Up | Tall bearish, opens near prior close | 79% | 24 |
| Morning star | Down | Small body gapping below | 78% | 12 |
| Evening star | Up | Small body gapping above | 72% | 4 |
Why the soldiers and crows halves are not mirrors
Two things in Bulkowski's soldiers and crows statistics deserve a second look. First, a "reversal rate" is how often price breaks out in the pattern's named direction, with a breakout defined as a close beyond the pattern's high or low. It is not a win rate. Bulkowski explains that the crows rate is inflated because price already finishes near the pattern low, so a downward break takes very little.
Second, the two halves are not mirrors. For three white soldiers, only 593 out of 3,333 samples broke downward, and Bulkowski writes that the upward breakouts "have lousy performance". The best 10-day figure for the soldiers is a move of -7.66% after a downward breakout in a bear market, from just 56 samples. For the crows, the best 10-day figure is a rise of 13.31% after an upward breakout in a bear market, from just 66 samples, and he advises against trading a downward breakout over that window. In both cases the strongest measured move ran against the pattern's name. Treat those small samples as leads, not results.
Related lesson: Morning star and evening star patterns
Confirming Soldiers and Crows With RSI, MACD and Moving Averages
Indicators can tell you whether a soldiers or crows pattern formed somewhere that makes sense, but they are derived from the same prices, so they add context rather than independent proof. Three tools come up most often.
- RSI. J. Welles Wilder's Relative Strength Index runs from 0 to 100, usually over 14 periods, with readings above 70 generally treated as overbought and below 30 as oversold. Crows that form after RSI was stretched above 70 are interrupting a genuinely extended rise. Crows that form with RSI near the middle are interrupting something much weaker.
- MACD. Gerald Appel's MACD is the 12-day EMA minus the 26-day EMA, with a 9-day EMA of that line as the signal line. A MACD line already below its signal line when the crows print says upside momentum was fading before the pattern. MACD is unbounded, so it is poor at marking overbought or oversold levels.
- Moving averages. A 50-period simple moving average is a simple trend filter, and TradingView's built-in pattern detector offers exactly that option for defining trend. A crows formation that closes below the 50-period average has done more damage than one that stays above it.
If every indicator agrees with the pattern, that is comfortable, not conclusive. The honest caveat is that indicator filters have a weak record in candlestick testing. In a ten-year study of SET50 stocks, Tharavanij and co-authors found that adding Stochastics, RSI or MFI filters generally did not improve candlestick pattern profitability. Use indicators to decide where you will look, then judge the rule on your own logged sample.
Related lesson: Relative strength index
Volume and the Soldiers and Crows Patterns
Volume gets attached to soldiers and crows constantly, usually as a rule that each candle should print above-average volume. The evidence for that specific rule is thin. In Bulkowski's candlestick testing, candle volume was a poor predictor of performance in two out of three tests. When volume trended down through the pattern, performance was better just 52% of the time. When volume inside the pattern was above average, 58% outperformed, which he still calls near random.
The one volume test that held up was the breakout day. In 91% of the candle types Bulkowski tested, patterns with heavy breakout-day volume outperformed their light-volume counterparts. That points to a practical split:
- Volume during the three candles is a description of the move, not much of a filter.
- Volume on the session that closes beyond the pattern's high or low is the part worth recording and testing.
On futures, check which contract the volume belongs to. Around a quarterly roll, volume drains from the expiring month into the next one, and a continuous chart can make a perfectly normal session look like a volume collapse.
Related lesson: What is volume
How to Trade Three Black Crows With One Stop and Three Entries
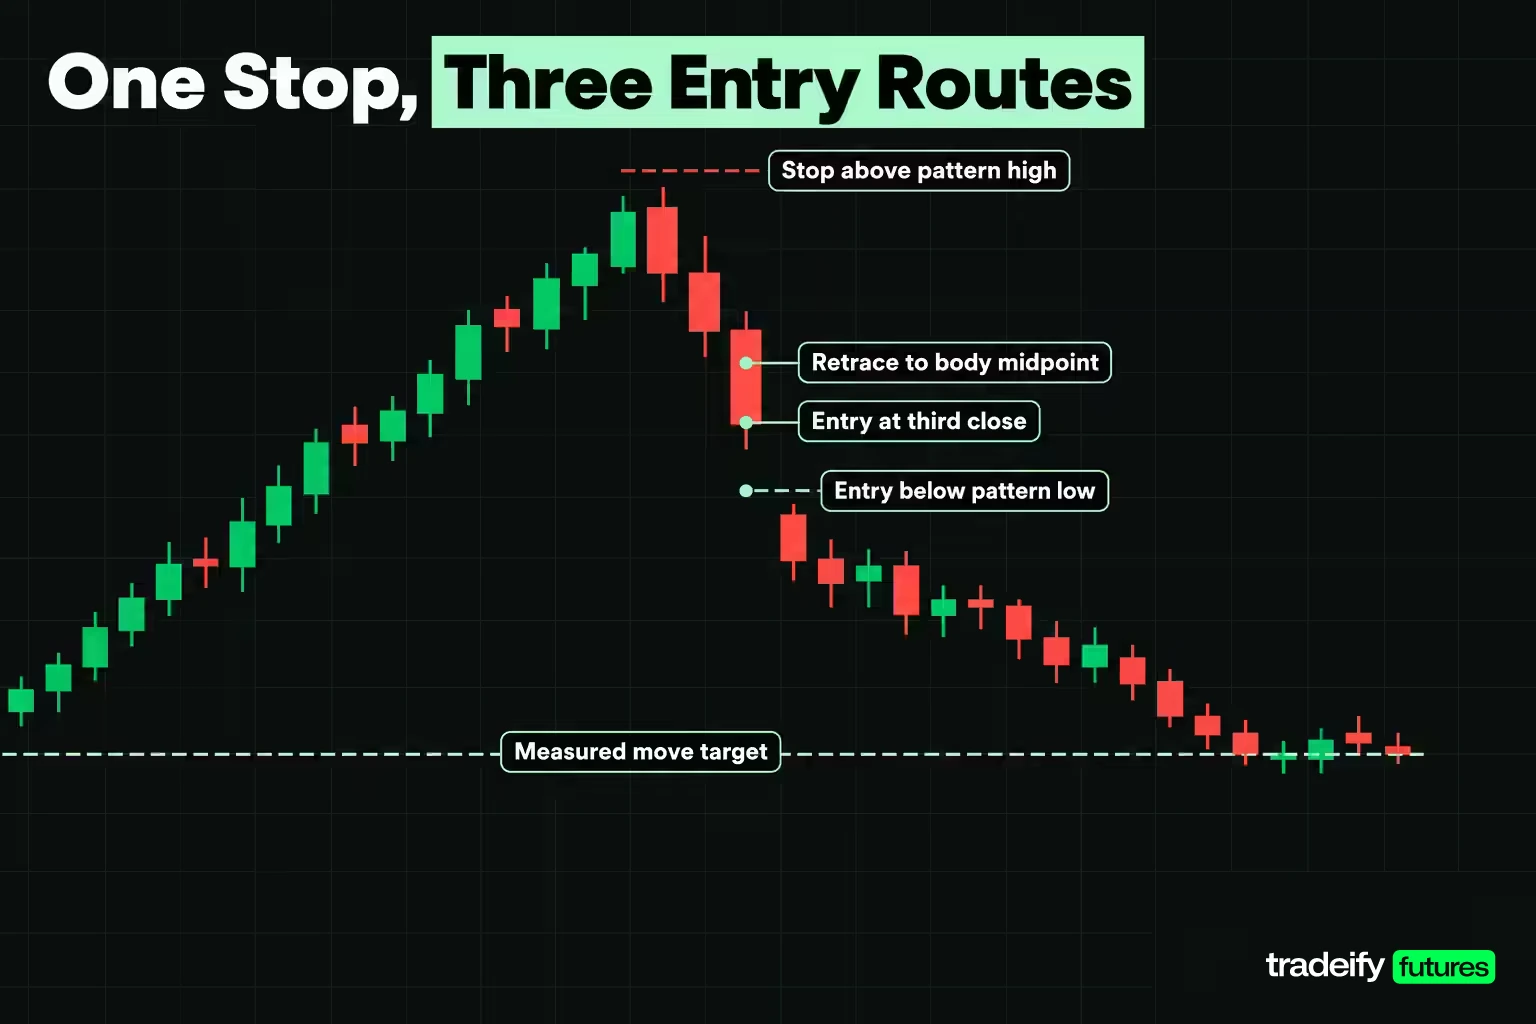
Trading three black crows comes down to three choices: where the idea is wrong, where you take profit, and where you get in. Fix the first two before you think about the third, because the entry decides how much of the trade's range you are risking.
Using the illustrative MES crows formation (high 7,621.00, low 7,584.00, height 37.00 points), the stop goes one tick above the pattern high at 7,621.25. If sellers really took control, price trading back above the whole pattern says they did not. The first target is a measured move: the 37.00 point height subtracted from candle 3's close of 7,585.00 gives 7,548.00. The distance from stop to target is 73.25 points, or $366.25 per MES contract, no matter where you enter.
Pricing three entry routes on the crows trade
Three common entry routes split the 73.25 point stop-to-target distance on the illustrative MES crows trade differently.
- At the third close (7,585.00). Risk is 36.25 points, or 145 ticks, which is $181.25 per contract, against $185.00 of reward. Break-even win rate is 49.49%.
- On confirmation, one tick below the pattern low (7,583.75). Risk grows to 37.50 points, 150 ticks or $187.50, and reward shrinks to $178.75. Break-even rises to 51.19%.
- On a retrace to candle 3's body midpoint (7,593.50). Risk drops to 27.75 points, 111 ticks or $138.75, and reward grows to $227.50. Break-even falls to 37.88%, but the order only fills if price bounces 8.50 points first.
| Entry route | Entry | Risk in points | Risk in ticks | Risk per MES | Reward per MES | Reward to risk | Break-even win rate | Break-even with $1.50 cost |
|---|---|---|---|---|---|---|---|---|
| Third candle close | 7,585.00 | 36.25 | 145 | $181.25 | $185.00 | 1.02 | 49.49% | 49.90% |
| Close below pattern low | 7,583.75 | 37.50 | 150 | $187.50 | $178.75 | 0.95 | 51.19% | 51.60% |
| Retrace to body midpoint | 7,593.50 | 27.75 | 111 | $138.75 | $227.50 | 1.64 | 37.88% | 38.29% |
The confirmation route is the most expensive of the three. Waiting for a break of the low feels safer, and it does filter out some patterns that never follow through, but in this setup it adds risk and removes reward. Whether that trade is worth it depends on how many failed patterns the filter removes, which only a logged sample can tell you.
The retrace route looks cheapest on paper, and that is exactly what its lower fill rate is paying for. If the bounce never comes, you have no trade at all, and a break-even figure on trades you never got is not a saving.
Sizing the crows trade from the stop
Size comes from the stop distance, not from how strong the pattern looks. With an illustrative $50,000 account and a $500 risk budget (1%), the close entry allows 2 contracts for $362.50 of risk (0.73%), the confirmation entry 2 contracts for $375.00 (0.75%), and the retrace entry 3 contracts for $416.25 (0.83%). Rounding down always leaves part of the budget unused, and that is the correct direction to round.
Scale matters too. The same 36.25 point stop on one full-size E-mini S&P 500 (ES) is $1,812.50, so a trader who can carry two MES on this setup cannot carry even one ES within the same budget.
For three white soldiers, mirror every step: stop one tick below the pattern low, target the pattern height added to the third close, and the same three entry routes priced upward.
Related lesson: Position sizing
A Real Three Black Crows Pattern on ES Futures
A real three black crows pattern printed on ES daily bars on September 8, 9 and 10, 2026, and it shows both what the pattern looks like in live data and how messy the follow-through can be. The bars come from Yahoo Finance's continuous front-month ES series, which was still the September 2026 contract on those dates.
| Session | Open | High | Low | Close | Body | Close off the low |
|---|---|---|---|---|---|---|
| Sept 8, 2026 | 7,715.50 | 7,728.50 | 7,672.25 | 7,680.50 | 35.00 | 14.67% |
| Sept 9, 2026 | 7,681.00 | 7,691.25 | 7,628.75 | 7,643.75 | 37.25 | 24.00% |
| Sept 10, 2026 | 7,646.50 | 7,666.25 | 7,585.50 | 7,598.50 | 48.00 | 16.10% |
Each candle opened inside the prior body, each closed lower, and each close sat in the lower quarter of its range. The weaknesses are just as visible. The prior "rise" was modest: the Sept 4 close of 7,722.00 was only 30.75 points above the close 10 sessions earlier. The bodies were 0.54, 0.58 and 0.75 times the 14-session average range of 64.27 points, so the pattern fails a strict "tall body" test and only passes a loose one. Upper wicks of 13.00, 10.25 and 19.75 points show buyers still pushing back.
Indicator and volume readings on the September crows
The indicators, computed on the same daily closes, gave a mixed read. On Sept 4, before the pattern, RSI was 53.89, nowhere near overbought, so the crows were interrupting a mild rise rather than a stretched one. MACD was already below its signal line (22.75 against 30.12), so upside momentum was fading before the first crow. By the Sept 10 close, RSI was 42.82 and price had closed at 7,598.50, below the 50-day average of 7,631.91. Volume ran 1.27, 1.15 and 1.36 times the prior 20-session average across the three candles.
By most checklists that is a well-confirmed bearish pattern. The next session, Sept 11, closed at 7,659.50, up 61.00 points and back inside the pattern, on volume 1.60 times the average. A trader who sold the third close was looking at a loss within a day, and the temptation at that point is to cover early or, worse, add to the short to "improve" the entry. The stop was still far away, which is the cost of a tall pattern.
The first close below the pattern low came on Sept 16, the day of the Fed's rate decision, at 7,556.50 after a low of 7,509.25. A confirmation short there faced a Sept 17 close of 7,640.00, up 83.50 points. The measured-move target of 7,455.50 was never reached, and those mid-September bars came from a contract that was thinning out ahead of expiry, with volume of 487,789 on Sept 16 and 285,399 on Sept 17. A stop one tick above the pattern high at 7,728.75 was not touched before the series rolled to December. Neither route paid in a straight line, which is a fair reflection of how these patterns behave.
How rare a qualifying pattern is on ES daily charts
How often ES actually prints a qualifying soldiers or crows pattern is something you can count. The scan ran on 504 ES daily bars from Nov 1, 2024 to Nov 3, 2026, starting with three-candle windows of the same colour with successively higher or lower closes, then applying the tests in order: a 10-session trend, opens inside the prior body, body length, and close position.
| Step | Soldiers windows | Crows windows |
|---|---|---|
| Three same-colour candles with stepping closes | 72 | 39 |
| Plus a prior trend in the opposite direction | 25 | 25 |
| Plus candles 2 and 3 opening inside the prior body | 3 | 7 |
| Plus bodies at least 1.0 times the average range | 0 | 0 |
| Plus bodies at least 0.5 times the average range | 0 | 2 |
| Qualifying on the loose thresholds | 0 | 1 |
Over two years, 72 soldier-like and 39 crow-like staircases produced zero strict qualifiers and one loose one, the September example. The open test and the body test do most of the filtering. On an index future that trades nearly around the clock, daily candles rarely open inside the prior body by much, and three-day moves rarely produce three bodies that each beat the average range. Run the same count on your own market before you assume the pattern is common there.
What Research Says About Soldiers and Crows Reliability
Research on soldiers and crows reliability is mixed, and most of it tests candlestick patterns as a group rather than these two alone. The strongest positive result is old. Gunduz Caginalp and Henry Laurent tested standard three-day candlestick patterns on daily prices of all S&P 500 stocks between 1992 and 1996 and reported out-of-sample significance at 36 standard deviations from the null, with a profit of almost 1% over a two-day holding period.
Soldiers and crows studies that found little or no edge
Later candlestick research is far less encouraging for soldiers, crows and their relatives:
- Marshall, Young and Rose (2006) found no profits from candlestick patterns on Dow Jones stocks from 1992 to 2002 using a bootstrap test.
- Duvinage, Mazza and Petitjean (2013) tested candlestick rules on 5-minute data for the 30 Dow Jones constituents. Around a third beat buy-and-hold before costs, just a few stayed profitable after costs, and after correcting for data snooping no single rule beat buy-and-hold.
- Tharavanij, Siraprapasiri and Rajchamaha (2017) found that the mean returns of most patterns on SET50 stocks over 10 years were not statistically different from zero.
Thomas Bulkowski's pattern statistics add one more useful finding: across 96% of the candle types he studied, performance in a bear market beat performance in a bull market. His numbers come from his own database without a trading-cost model, so they describe price behaviour after the pattern rather than the profit of a rule.
Read together, the research says the trend condition, the exit rule, costs and the market matter more than the shape. What would change that conclusion is a test that isolates these two patterns on one market, with costs and an out-of-sample period, and none of the studies in this section does exactly that. The studies test mechanical entries and fixed exits, which is not how most traders use the pattern, so the only result that applies to your rule is your own logged sample.
Related lesson: Backtesting a trading strategy
Where Soldiers and Crows Patterns Fail
Soldiers and crows patterns fail in a handful of predictable ways, and each one has a rule that catches it before it costs money.
| Failure mode | What it looks like | The rule that catches it |
|---|---|---|
| Three candles instead of the pattern | Three red candles in the middle of a range, all short-bodied | Test trend and body length first; no prior rise, no crows |
| Chasing the third candle | Selling the third close because the drop looks violent | Price the entry first; a close entry here risks about half the stop-to-target distance |
| Pattern against the bigger trend | Soldiers inside a strong downtrend on the higher timeframe | Treat it as a possible retrace; check the higher timeframe before taking it |
| Overextended pattern | Three huge candles that leave the stop far away | Size from the stop; if the setup does not fit the risk budget, skip it |
| Treating the halves as mirrors | Assuming the crows are as reliable as the soldiers, or the reverse | Test each half on its own sample |
| Reading a bounce as failure | A retrace into candle 3's body after the pattern | Decide in advance whether a retrace is your entry or your exit |
The patterns still have real advantages. They are easy to define in writing, they give a clear invalidation level beyond the pattern extreme, and they force you to look at trend context. Bulkowski also notes that a short move after an upward breakout is typical for three white soldiers, so a tight first target is usually more realistic than a big swing target.
Related lesson: Multiple timeframe analysis
A Soldiers and Crows Checklist for Intraday Futures Traders
A soldiers and crows checklist keeps the decision mechanical, which matters most on the days a fast three-candle move makes you want to act before you have checked anything.
- Define the prior trend mechanically before scanning. No decline, no soldiers; no rise, no crows.
- Record the open, high, low and close of each candle and check them against written thresholds.
- Mark the invalidation level one tick beyond the pattern extreme, then the first target.
- Pick one entry route (third close, confirmation or retrace) and keep it for the whole sample.
- Size from the stop distance and the risk budget, rounding contracts down.
- Log entry, stop, size, breakout-day volume and outcome for every instance, and review after 30 or more.
Related lesson: How to keep a trading journal
On our accounts, every position is closed by 4:45 PM ET and nothing is held overnight, so a daily soldiers or crows formation can only frame which side you favour during the session, not a multi-day hold. ES and MES are both on our supported product list, and 10 micros count as one mini against position limits, which makes MES the natural way to size the stop distances in this guide. WealthCharts on our accounts includes Chart Replay, which is a practical way to log a sample of these patterns on historical bars before trading one.
Three White Soldiers and Three Black Crows FAQ
Are three white soldiers bullish or bearish?
Three white soldiers is a bullish reversal pattern. It needs a prior decline, then three tall bullish candles that each open inside the previous body and close near the high. The same shape inside a downtrend is often only a retrace.
What is the opposite of three black crows?
Three white soldiers is the opposite of three black crows. The crows step down out of a rise; the soldiers step up out of a decline. The tests are the same, mirrored.
What is the identical three crows pattern?
Identical three crows is a stricter version of three black crows where candles two and three open near the previous candle's close. Bulkowski reports a 79% bearish reversal rate and an overall rank of 24 out of 103, from only 921 patterns.
Is there a three black soldiers pattern?
No, three black soldiers is a mislabel. The bearish pattern is three black crows. Soldiers always refers to the bullish version.
Which timeframe works best for soldiers and crows?
Daily charts are where most of the evidence sits, though no timeframe is best for everyone. The published research mostly uses daily data, where each candle covers a full session. On intraday charts the pattern prints more often but means less, and costs take a bigger share of a smaller stop.
Do three white soldiers and three black crows work?
Sometimes, under specific conditions. Caginalp and Laurent's study of S&P 500 stocks from 1992 to 1996 found strong results for three-day patterns, while later studies found the edge disappeared after costs and data-snooping corrections. Test your exact rule on your own market.
Risks of Trading Soldiers and Crows Patterns
Trading futures involves substantial risk of loss and is not suitable for everyone, and leverage means losses can exceed what you expect on a single trade. A stop order does not guarantee your exit price, and a fast market can fill far from the level you set. The MES candles, account balance, position sizes and $1.50 round-turn cost in this guide are illustrative, and the September 2026 ES example is a historical observation, not a prediction. Evaluation and funded prop firm accounts are simulated, and simulated results do not represent live trading. This guide is general education, not investment advice.


