




TL;DR: Entry and exit strategies are the written rules that open and close a trade, and the exit often decides more of the result. On 87 ES and NQ breakouts, eight exits on identical entries moved the average by 0.181R per trade. The median trade ran only 0.59R in your favour, so a 2R target was rarely reachable. Pick exits from what your own trades actually reach, then measure the pair together.
Most traders spend weeks on the entry and about thirty seconds on the exit. The entry has the setup, the story and the screenshot. The exit is where the story either pays or quietly turns into a scratch.
This guide covers both halves of the decision: how to define an entry, the main exit types and what each costs, stop placement, profit taking, trade management and the psychology of sticking to the plan. It also scores eight exit strategies on the same 87 futures entries so you can see how much the exit alone moves the result.
What entry and exit strategies include
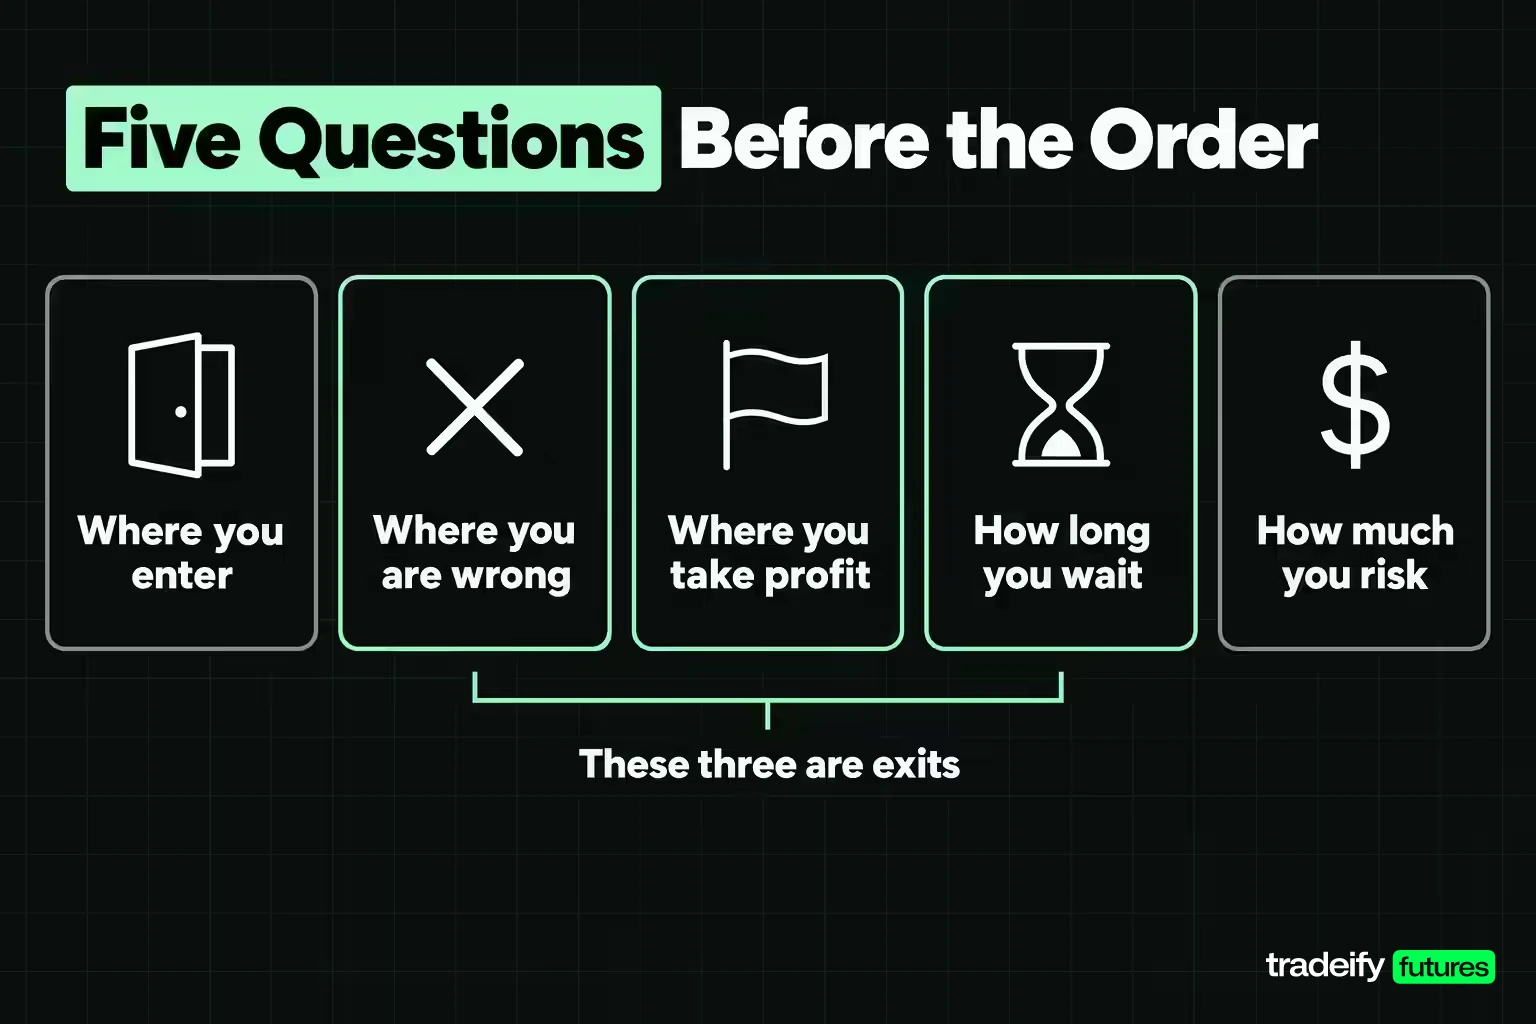
An entry strategy is the set of conditions that must be true before you open a position, plus the price or order type you use to get in. An exit strategy is the set of conditions that close it.
The exit is really three separate decisions that traders often collapse into one:
- The invalidation level. The price at which the reason for the trade no longer exists. This is where the stop-loss goes.
- How a winner ends. A fixed target, a trailing stop, a partial scale-out, or a combination.
- The time limit. How long the position may stay open without meeting either condition.
All three are exits. Most traders write down the second one, improvise the other two, then judge the whole strategy on the result. That makes it impossible to tell which part failed.
A complete entry and exit strategy answers five questions before the order goes in: where you enter, where you are wrong, where you take profit, how long you wait, and how much you risk. If one of those answers is "I'll see how it goes", that is the part that will hurt you.
Related lesson: How to create a trading plan
How to identify entry points
An entry point is the specific price and moment where your conditions line up. Good entries usually combine three layers, and each layer answers a different question.
Location, trigger and confirmation for an entry
- Location answers "is this a place worth trading?" Support and resistance, the prior day's high or low, an opening range, a volume-weighted average price (VWAP) or a round number. Location is what makes the stop distance sensible, because the invalidation level sits on the other side of it.
- Trigger answers "why now?" A candle closing through a level, a break of a recent swing, a failed breakdown that snaps back. The trigger turns a level you are watching into an order.
- Confirmation answers "is the market agreeing?" Volume expanding on the break, the move holding above VWAP, a higher timeframe trend pointing the same way. Confirmation reduces false starts but it costs price, because you enter later and further from your stop.
That last point matters more than most entry guides admit. Every confirmation filter you add moves the entry away from the invalidation level, which makes 1R larger in points and dollars. A filter only helps if it removes enough failures to pay for that extra distance.
Technical indicators for entries and exits
Indicators are measurement tools, not signals by themselves. Each one answers a narrow question:
- Moving averages show trend direction and slope. Traders use price above or below a moving average as a directional filter, and crossovers as triggers, accepting that crossovers lag.
- VWAP shows the average price paid during the session weighted by volume. Intraday futures traders often treat a hold above or below VWAP as a bias filter, and VWAP itself as a target or a trailing reference.
- Volume shows participation. A breakout on rising volume has more traders behind it than one on thin volume, which is a reason to trust the trigger a little more, not a promise.
- Average true range (ATR) shows how far the market typically moves per bar. It is the most useful indicator for exits, because it sizes stops and targets to current volatility instead of a fixed number of points.
Price action entries without indicators
Price action traders define the same three layers from the chart alone: a level that has mattered before, a candle that closes through it or rejects it, and follow-through on the next bars. The advantage is speed. The weakness is that "clean" is in the eye of the trader, so price action entries need written definitions even more than indicator entries do.
Whatever method you use, write the entry as a rule another trader could follow without asking you questions. If they could not, you cannot test it either, and you will end up judging it by how the last trade felt.
Related lesson: Trade setups and confirmation
Exit strategy types and what each costs
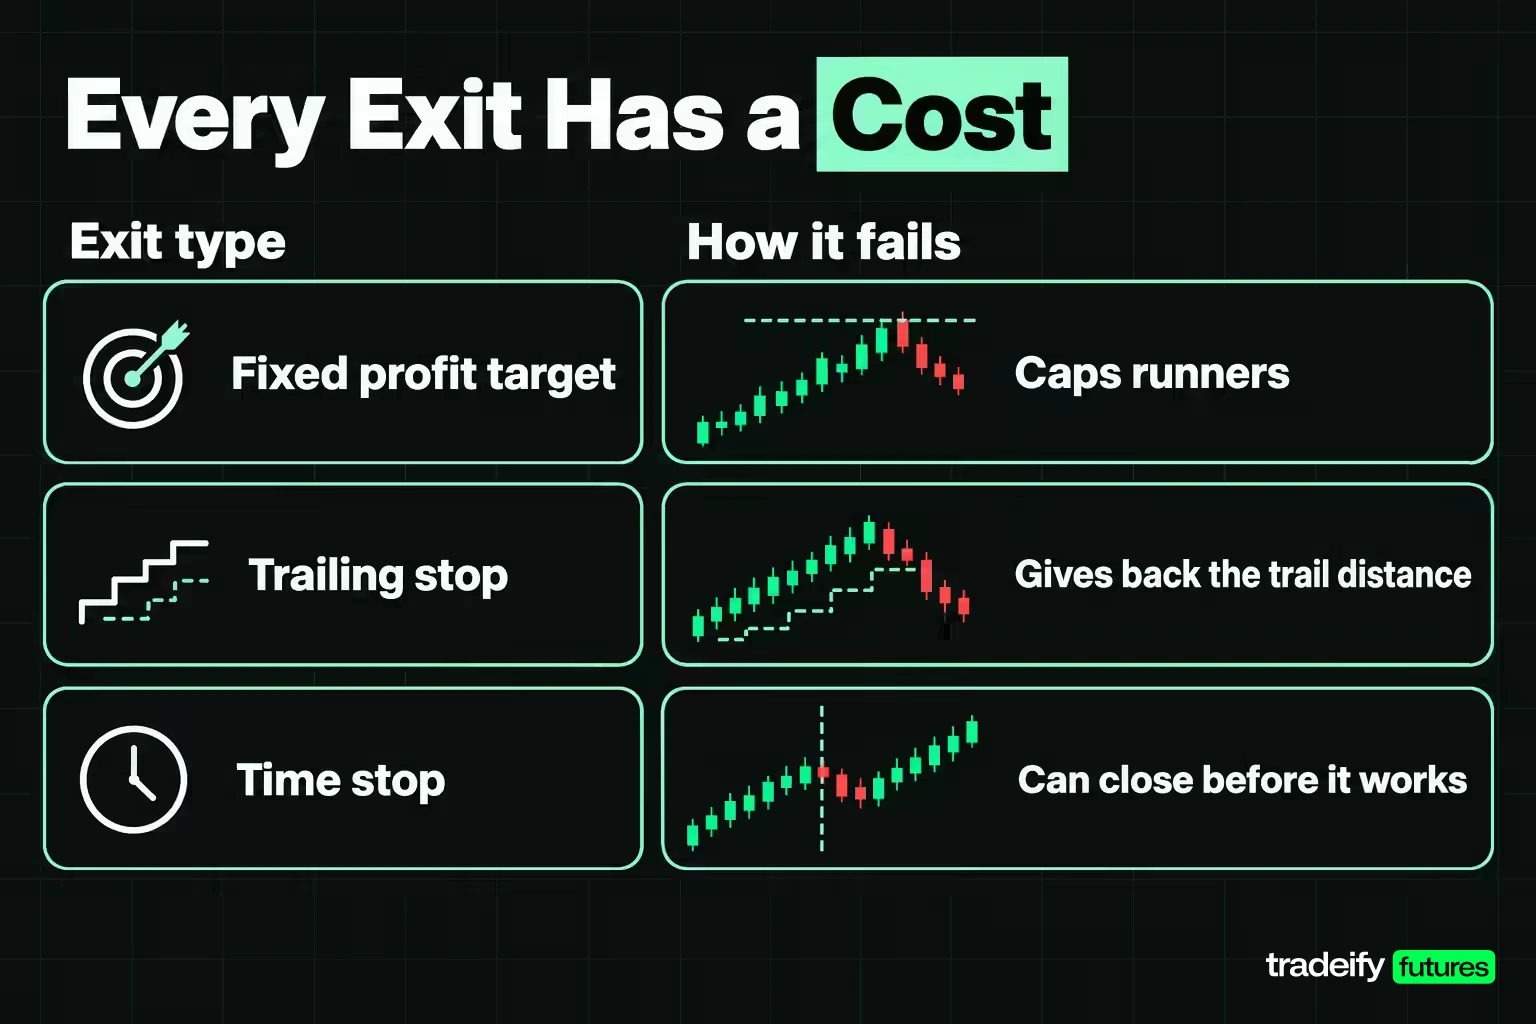
Every exit strategy protects something and gives something up. The useful question is not "which exit is best" but "which failure can I live with for this setup". Pick the one whose bad days you can sit through without overriding it.
| Exit type | How it works | What it protects | How it fails |
|---|---|---|---|
| Fixed profit target | Limit order at a set distance, often a multiple of risk | Locks in a planned gain | Caps runners and fails if the target is rarely reached |
| Trailing stop | Stop follows price at a set distance, ATR multiple, swing point or moving average | Lets a trend pay | Gives back the trail distance and stops out trades that only wobble |
| Breakeven stop | Stop moves to entry after a set gain | Removes the full loss once a trade works | Turns pullbacks inside a good trade into scratches |
| Scale-out | Part of the position closes at a first target, the rest runs | Banks some gain while keeping exposure | Lowers the average win and adds decisions |
| Time stop | Position closes at a set time or after a set number of bars | Stops a stalled idea from tying up risk | Can close a trade just before it works |
| Session-close exit | Position held until the end of the session | Gives the idea the whole day | Leaves winners exposed to late reversals |
| News or fundamental exit | Close before or after a scheduled release, or when the reason for the trade changes | Avoids event volatility | Can exit a valid position on noise |
Trailing stop methods
Trailing stops come in four common forms:
- Fixed distance, a set number of ticks or points behind the best price. Simple, but blind to volatility.
- Volatility-based, a multiple of ATR behind the best price. Adapts to fast and slow days.
- Structure-based, under each new higher low in a long trade or above each lower high in a short. Follows how the market is actually building.
- Indicator-based, behind a moving average or VWAP. Smooth, but usually wider and later than structure.
The tighter the trail, the more often it converts a healthy pullback into an exit. The looser the trail, the more open profit it gives back at the end.
Fundamental and news exit signals
A fundamental exit closes a position because the reason behind it has changed, not because of a price level. For a day trader that usually means a scheduled event: a Federal Reserve decision, an inflation report or an employment release. Some traders flatten before the release because a stop can fill well past its price when the market gaps on a number. Others hold with the stop in place and accept that risk. Either choice is defensible if it is written down before the day starts.
Related lesson: Trailing stops
Stop-loss placement inside an exit strategy
The stop-loss is the exit you hope not to use, and it is the one that sets everything else. It defines 1R, which means it defines your position size, your target distances and your required win rate.
Four ways to place a stop-loss
- Structure stop. Beyond the level that invalidates the idea: under the swing low, on the other side of the range, past the failed breakout. This is the stop that asks "where am I wrong?"
- Volatility stop. A multiple of ATR from entry. This is the stop that asks "how far does this market wander without meaning anything?"
- Fixed-risk stop. A set dollar amount per trade. This is honest about the account, but it ignores the chart, so it often sits in the middle of normal noise.
- Time-and-price stop. A stop plus a rule that the trade must work by a certain time. This combines invalidation with a clock.
The best stops usually start with structure, check the distance against volatility, then size the position so the dollar risk fits the account. Size changes; the stop location should not move to make the size fit.
Stop orders, slippage and gaps
A standard stop order becomes a market order when the stop price is reached, according to the SEC's investor education site, so the fill can be worse than the stop price, especially in a fast market. A stop-limit order controls the price but may not fill at all, which can leave you in a losing position.
In equity index futures, gaps mostly show up at the open of a new Globex session. CME lists E-mini S&P 500 (ES) trading from Sunday 6:00 PM to Friday 5:00 PM ET with a daily maintenance break from 5:00 PM to 6:00 PM ET, so a stop resting through that break or through a weekend can fill far from its price. Intraday traders avoid most of that risk by being flat before the break.
Stop distance in dollars
Turning the stop into dollars keeps the plan honest. ES moves $50 per index point and the Micro E-mini S&P 500 (MES) $5 per point. The Nasdaq-100 contracts move $20 per point on NQ and $2 on the Micro E-mini Nasdaq-100 (MNQ). All four tick in 0.25 points.
In this guide's opening range study, the median ES stop was 24.625 points, which is $123.13 per MES or $1,231.25 per ES. The median NQ stop was 174.5 points, which is $349 per MNQ or $3,490 per NQ. A structure stop that looks small on a chart can be a large number on the statement, and the micro contracts are often the only way to keep it inside a sensible per-trade limit.
Related lesson: Stop-loss orders and placement
How far breakout entries ran in an ES and NQ study
Before choosing any exit, it helps to know how far your entries actually travel. This guide measured that directly with its own calculation on Yahoo Finance price data, on an opening range breakout, one of the most common intraday entry strategies in index futures.
Method of the opening range exit study
- Data. ES and NQ 5-minute bars from Yahoo Finance, regular trading hours (9:30 AM to 4:00 PM ET), 47 sessions per market from August 27 to November 4, 2026. September 14 (the front-month roll happened inside that session) and October 30 (a corrupted afternoon bar) were excluded.
- Opening range. The high and low from 9:30 AM to 10:00 AM ET.
- Entry. The close of the first 5-minute bar between 10:00 AM and 11:30 AM ET that closes outside the range, long above it and short below it.
- Stop. The opposite side of the opening range. 1R is the distance from entry to that stop.
- Scoring. A bar that touches both the stop and a target counts as a loss, because 5-minute bars cannot show which came first. No commissions, slippage or position sizing are modelled, so every result is arithmetic on price, not a filled trade.
That produced 87 trades: 46 in ES and 41 in NQ, 47 long and 40 short.
Maximum favourable excursion results
Maximum favourable excursion (MFE) is the furthest a trade moved in your direction before it hit the stop or the session ended, measured in R.
| Breakout measure | ES | NQ | Both markets |
|---|---|---|---|
| Trades | 46 | 41 | 87 |
| Median MFE | 0.64R | 0.53R | 0.59R |
| Reached 0.5R | 56.5% | 53.7% | 55.2% |
| Reached 1R | 32.6% | 24.4% | 28.7% |
| Reached 1.5R | 13.0% | 9.8% | 11.5% |
| Reached 2R | 6.5% | 4.9% | 5.7% |
| Reached 3R | 4.3% | 0.0% | 2.3% |
Source: this guide's own calculation on Yahoo Finance ES and NQ 5-minute bars, August 27 to November 4, 2026, before costs.
In this guide's own measurement, the typical breakout trade never got a full R in profit, and fewer than three in ten ever touched 1R. A 2R target, which many trading guides treat as a minimum, was reached by 5.7% of trades. If your exit sits at a distance most trades never reach, it is not a plan. It is a slow way of turning small winners into scratches.
This guide's earlier measurement with the same rules, on 90 trades from July 8 to September 15, 2026 (a window that partly overlaps this one), found a median MFE of 0.63R and 31.1% reaching 1R. Two windows agreeing does not make this a law of the market, but it does make the shape hard to dismiss: for this entry, distance was scarce.
Eight exit strategies scored on the same entries
The exit study in this guide held the opening range breakout entry and its stop fixed on all 87 ES and NQ trades, and changed only how each trade could end. Every rule closes any open position at the 4:00 PM ET session close.
| Exit rule | Win rate | Full 1R losses | Average result | Median result | Standard deviation | Total |
|---|---|---|---|---|---|---|
| 1R target | 44.8% | 34.5% | -0.095R | -0.226R | 0.840R | -8.25R |
| 1.5R target | 39.1% | 39.1% | -0.191R | -0.500R | 0.860R | -16.62R |
| 2R target | 39.1% | 39.1% | -0.176R | -0.500R | 0.901R | -15.30R |
| 2R target with breakeven stop after 1R | 35.6% | 34.5% | -0.149R | -0.226R | 0.872R | -12.94R |
| Half off at 1R, rest to 2R | 44.8% | 34.5% | -0.122R | -0.226R | 0.831R | -10.60R |
| Trailing stop 1R behind best price | 39.1% | 0.0% | -0.048R | -0.257R | 0.818R | -4.17R |
| Noon time stop | 55.2% | 17.2% | -0.010R | +0.067R | 0.654R | -0.87R |
| Hold to the session close | 39.1% | 39.1% | -0.162R | -0.500R | 0.956R | -14.09R |
Source: this guide's own calculation on Yahoo Finance ES and NQ 5-minute bars, August 27 to November 4, 2026, before costs.
What the exit comparison shows
Three things stand out in this guide's comparison of eight exits on the same ES and NQ breakout entries.
The exit moved the result a lot. The gap between the best and worst average was 0.181R per trade, or 15.75R across the 87 trades, with the entries untouched. 30 of the 87 trades (34.5%) were a winner under at least one exit and a loser under another.
No exit created an edge. Every rule finished negative. The noon time stop came closest at -0.010R per trade, which is flat before costs and negative after them. A better exit changes the size of the outcome; it did not change its sign here.
Exits that left trades open longest did worst. Holding to the session close, and targets most trades never reached, gave back the small gains the breakouts did make. The time stop worked because it closed positions while the move was still alive, and cut full 1R losses from 39.1% to 17.2%.
The trailing stop is the most interesting row. It never took a full 1R loss, because it tightened the moment price moved in the trade's favour, yet its win rate was lower than the 1R target's. It traded many small losses for a few big runners.
This is one entry, two correlated markets and about ten weeks. The ranking of exits can change with a different entry or a different month. The size of the gap between them is the lesson.
The win rate each exit strategy needed
Every exit strategy has a break-even win rate you can calculate before you trade. If your average win is W and your average loss is L (both in R), the strategy breaks even when the win rate equals L divided by W plus L.
With a clean 1R stop and a 2R target, that is 1 divided by 3, or 33.3%. With a 1R stop and a 1R target it is 50%. Real exits are messier, because some trades close at the session end for less than a full win or less than a full loss. The table below uses the actual averages from the 87-trade ES and NQ exit study.
| Exit rule tested | Average win | Average loss | Required win rate | Actual win rate | Gap in points |
|---|---|---|---|---|---|
| 1R target | +0.767R | 0.795R | 50.9% | 44.8% | -6.1 |
| 1.5R target | +0.751R | 0.796R | 51.4% | 39.1% | -12.3 |
| 2R target | +0.790R | 0.796R | 50.2% | 39.1% | -11.1 |
| Breakeven after 1R | +0.813R | 0.681R | 45.6% | 35.6% | -10.0 |
| Half off at 1R | +0.707R | 0.795R | 52.9% | 44.8% | -8.1 |
| Trailing stop | +0.761R | 0.567R | 42.7% | 39.1% | -3.6 |
| Noon time stop | +0.474R | 0.606R | 56.1% | 55.2% | -0.9 |
| Session close | +0.826R | 0.796R | 49.1% | 39.1% | -10.0 |
Source: this guide's own calculation on Yahoo Finance ES and NQ 5-minute bars, August 27 to November 4, 2026, before costs.
Look at the 2R target row. On paper a 2R target needs only 33.3%. In practice so few trades reached 2R that most "wins" were small session-close gains, the average win fell to +0.790R, and the real requirement jumped to 50.2%. The headline reward-to-risk ratio of an exit means little if the target is rarely filled.
That is the risk-reward trap. A big target looks like a high-quality plan, but the ratio that pays you is the realised average win divided by the realised average loss, not the distance you typed into the order ticket.
Related lesson: Win rate vs payoff ratio
Profit-taking exits for targets, scale-outs and runners
Profit taking is the part of an exit strategy that decides how much of each move you keep. It has three main tools: a fixed target, a scale-out, and a runner managed by a trail.
Choosing a profit target
Start from what your entries actually reach, not from a ratio you like. In this guide's ES and NQ breakout study, 55.2% of trades reached 0.5R, 28.7% reached 1R and 5.7% reached 2R. A target is a bet on that distribution. A 2R target on this entry was a bet on roughly one trade in eighteen.
Good targets usually sit at a place the market has a reason to react: the prior day's high or low, VWAP, the far side of a range, a measured move. Then check the target distance against your own MFE records. If fewer than a third of your trades ever get there, the target is decoration.
Scaling out of a winner
A scale-out closes part of the position at a first target and lets the rest run. In this guide's own 87-trade ES and NQ measurement, taking half off at 1R and holding the rest for 2R (with the stop moved to entry after the first half) produced the same 44.8% win rate as the plain 1R target, but a lower average of -0.122R against -0.095R. The scale-out kept fewer full winners because the remaining half was often stopped at entry.
That does not make scaling out wrong. It makes it a trade-off: smoother results and less regret on runners in exchange for a smaller average win. It works best when your setups regularly run well past the first target. With micro contracts it is also the easiest way to split a position, because one ES equals ten MES in exposure.
Letting a runner work
A runner is the part of a position you keep open for an outsized move. Runners need a trail, a clear invalidation and the willingness to give back some open profit. In this guide's own ES and NQ measurement, the trailing stop's best trade made more than 3R while its most common outcome was a small loss. That is the profile of a runner strategy: many paper cuts, a few large wins, and a result that depends heavily on catching those few days.
Related lesson: Scaling in and scaling out
Trade management after the entry fills
Trade management is everything you do between the fill and the exit: moving stops, adding size, taking partials or doing nothing. The rule of thumb is simple: any change to an open trade should be a change you wrote down before the trade.
Moving the stop to breakeven
Moving the stop to entry after a trade reaches a set gain feels safe. It is not free. In this guide's own 87-trade ES and NQ measurement, a 2R target with the stop moved to breakeven after 1R won 35.6% of the time, against 39.1% for the same 2R target with the stop left alone. The breakeven rule turned several trades that pulled back and then worked into scratches.
A breakeven stop makes most sense when a pullback to your entry genuinely means the idea has failed. If normal pullbacks in your market regularly retest the entry, moving the stop there early mostly hands those trades back.
Adding to a position and widening stops
- Adding to a winner (pyramiding) can increase gains on trend days, but every add raises your average price and shrinks the cushion to your stop. Only add if the combined position still loses no more than your original planned risk at the stop.
- Adding to a loser (averaging down) increases risk exactly when the market is telling you the idea is wrong. Most risk frameworks forbid it for intraday futures.
- Widening a stop after entry changes 1R mid-trade. The trade you are now in is not the trade you planned or sized.
Account-level exit rules
Individual trades also need account-level exits. A daily loss limit, a maximum number of trades, or a rule to stop after two full losses are all exit strategies for the day rather than the position. A profit target for the day can work the same way: once it is hit, the next trade risks a good day for a marginal one. Write these limits next to your per-trade rules so they get followed on the day you least want to follow them.
Account-level exits work best when they are expressed in R. If your per-trade stop is 1R, a daily limit of 3R tells you exactly how many full losses end the day, and a weekly limit does the same for a bad week. Tie position size to the account too: when the account falls, the dollar value of 1R should shrink with it rather than staying fixed while the cushion gets thinner. If you are working toward an account target, such as a profit goal on an evaluation, resist raising size as the goal gets close. The last part of a target is where traders most often hand back the first part.
Changing the entry while the exit stays fixed
The reverse test asks whether a different entry would have helped. In this guide's 87-trade opening range study on ES and NQ, the stop stayed at the opposite side of the range and the exit stayed at a 1R target. Only the entry changed.
| Entry rule | Fills | Win rate | ES median risk | NQ median risk | Average result | Total result |
|---|---|---|---|---|---|---|
| Enter at the breakout bar close | 87 of 87 | 44.8% | 24.625 points | 174.5 points | -0.095R | -8.25R |
| Enter one bar later at that bar's close | 87 of 87 | 39.1% | 25.00 points | 159.75 points | -0.146R | -12.68R |
| Limit order back at the broken range edge before 12:00 PM | 69 of 87 | 47.8% | 22.25 points | 147.75 points | -0.064R | -4.38R |
Source: this guide's own calculation on Yahoo Finance ES and NQ 5-minute bars, August 27 to November 4, 2026, before costs.
Waiting one bar did not help: it chased price without improving the stop distance and lost the most. The retest limit order did best of the three because it bought back at the range edge, which cut the risk per trade, but it missed 18 of the 87 breakouts entirely. None of the three entries was profitable with a 1R target.
The useful lesson is that entry and exit are one decision. A better entry price shrinks 1R, which makes any R-based target closer and easier to fill. A missed fill removes a trade from the record, and if the missed trades are the ones that ran hardest, the "better" entry quietly gives up the best days.
Related lesson: Opening range breakout
Market conditions that change which exit strategy works
The same entry and exit strategy can behave very differently depending on the session. Before entering, and again before deciding how to exit, check what kind of day it is.
Trend days, range days and volatility
- Trend days reward trailing stops and runners. Fixed targets cut them short.
- Range days reward fixed targets near the far side of the range and quick time stops. Trailing stops get chopped.
- High-volatility days need wider stops and smaller size. A stop sized for a quiet day becomes noise.
- Low-volatility days often produce breakouts that stall. Time stops and modest targets usually beat holding for distance.
What the opening range width showed
The 87-trade ES and NQ study split the sample by opening range width, using each market's median (21.375 points for ES and 149.0 points for NQ) as the dividing line.
| Range width | Trades | 1R target win rate | 1R target average | Session-close average | Noon stop average |
|---|---|---|---|---|---|
| Narrow range days | 44 | 38.6% | -0.159R | -0.302R | -0.032R |
| Wide range days | 43 | 51.2% | -0.030R | -0.018R | +0.012R |
Source: this guide's own calculation on Yahoo Finance ES and NQ 5-minute bars, August 27 to November 4, 2026, before costs.
In this guide's own measurement, narrow-range breakouts were the weaker group under every exit, and holding them to the close was the worst combination tested at -0.302R per trade. Wide-range days came close to break even on most exits. One caution: the R unit is bigger on wide days, so a wide-range trade risks more points and dollars per contract for the same R.
Warning signs before an entry or exit
- A scheduled release inside your holding window, such as a Federal Reserve decision or an inflation report.
- Price chopping back and forth across VWAP without commitment.
- A breakout on falling volume.
- A move that has already travelled most of a typical day's range before your trigger.
- Your stop sitting right where obvious stops cluster, such as just beyond a round number.
None of these is a rule to skip a trade. Each is a reason to check whether the exit you planned fits the day you are actually trading.
Matching entry and exit strategies to your trading style
Entry and exit strategies have to fit the trader using them. Holding period, attention span and risk tolerance all change which exit is realistic.
| Trading style | Typical holding time | Entry approach | Exit approach | Main risk |
|---|---|---|---|---|
| Scalping | Seconds to minutes | Order flow, the DOM, very short-term levels | Small fixed targets, tight stops, fast time stops | Costs and slippage take a large share of each trade |
| Day trading | Minutes to hours | Session levels, opening range, VWAP, intraday trend | Targets, trails or time stops, flat by the close | Overtrading and holding losers into the close |
| Swing trading | Days to weeks | Daily chart structure and trend | Wider structure stops, partial targets, trailing stops | Overnight and weekend gaps |
| Position trading | Weeks to months | Fundamentals and weekly trend | Wide stops, fundamental exits | Large open drawdowns and margin changes |
Risk tolerance matters as much as style. If a 50% win rate with small wins and small losses feels comfortable, fixed targets and time stops suit you. If you can sit through long strings of small losses waiting for a trend day, trailing exits and runners suit you. Choose the exit whose losing streak you can tolerate, because you will meet it.
Whatever style you trade, size the position from the stop distance, not from how confident you feel. A scalper with a 2-point stop on MES risks $10 per contract; a day trader with a 24.625-point opening range stop on MES risks $123.13 per contract. Same market, very different exposure.
The psychology of sticking to an exit plan
Most exit failures are not analysis failures. They are decisions made while the position is open, the P&L is flickering and the plan suddenly feels negotiable. That is normal. It is also why the exit has to be decided before the entry.
Common exit mistakes
- Moving the stop away from price. It feels like giving the trade room. It is really changing a planned loss into an unplanned one.
- Taking profit early because a winner feels fragile. After a few losses, a small open gain feels precious. Grabbing it repeatedly lowers the average win until the strategy cannot pay for its losers.
- Holding a loser because closing it makes the loss real. The loss is already real. The stop just records it.
- Chasing a missed entry. Entering late at a worse price changes 1R and the target distance. In this guide's own 87-trade ES and NQ measurement, entering one bar late was the worst entry tested.
- Revenge entries after a stop-out. The next trade inherits the emotion of the last one instead of its own setup.
Exit rules that take the decision out of the moment
- Place the stop and target as one bracket order when the entry fills, so the plan is on the server rather than in your head.
- Write down the one condition that would justify changing the plan mid-trade. If it is not on the list, the plan stands.
- Use a time stop, so a stalling trade ends on schedule rather than when your patience runs out.
- After two full losses in a row, stop for a set period. Fresh eyes beat a fast third attempt.
- Record MFE and what you took on every trade. The gap between them shows whether your exits or your nerves are the problem.
Related lesson: Trading psychology
Three ES trades from the exit study
These three trades come from the 87-trade ES and NQ opening range study described in this guide. Each used the opening range from 9:30 AM to 10:00 AM ET, entry on the first 5-minute close outside it, and the opposite side of the range as the stop. Prices are ES futures; dollar figures use MES at $5 per point and are arithmetic, not filled trades.
A trade the exit turned from a win into a loss
On September 1, 2026, the ES opening range ran from 7638.75 to 7652.75, a width of 14.00 points. The bar closing at 10:10 AM finished at 7656.25, above the range, so the entry was long at 7656.25 with the stop at 7638.75. Risk was 17.50 points, or $87.50 per MES, and the 1R target sat at 7673.75.
Price climbed through the morning. The bar from 11:50 AM to 11:55 AM printed a high of exactly 7673.75, filling the 1R target for +1.00R. Under a noon time stop the trade closed at the 11:55 AM bar close of 7670.00, which is +13.75 points or +0.79R.
Every exit that stayed in longer lost. Price slid through the afternoon and hit 7638.75 in the 1:25 PM bar. The 1.5R and 2R targets and the hold-to-close rule finished at -1.00R, the breakeven version scratched at 0.00R, and the half-off version kept +0.50R. Same entry, same stop, results from +1.00R to -1.00R. Note too how thin the margin was: the target filled by touching its exact price, which a live limit order might not have.
A runner that a fixed target cut short
On October 16, 2026, the opening range ran from 7779.75 to 7803.25. The bar closing at 10:30 AM finished at 7779.00, below the range, so the entry was short at 7779.00 with the stop at 7803.25. Risk was 24.25 points, or $121.25 per MES.
The trade first went the wrong way. The 10:45 AM bar traded up to 7795.25, 16.25 points or 0.67R against the position. Then it broke. The 1R target at 7754.75 filled in the 11:20 AM bar, and the 2R target at 7730.50 filled in the 12:45 PM bar.
From there it kept going, according to this guide's own replay of the Yahoo Finance bars. The trailing stop exited in the 1:35 PM bar at 7719.75 for +2.44R, and the hold-to-close rule exited at the 4:00 PM close of 7703.00, 76.00 points in profit, or +3.13R ($380 per MES). The best point of the day was 4.25R. This is the kind of day the session-close and trailing exits exist for, and it is rare: only 2.3% of the 87 trades reached 3R.
A losing ES trade no exit strategy could save
On October 2, 2026, the opening range ran from 7773.50 to 7804.75. The bar closing at 10:25 AM finished at 7807.00, above the range, so the entry was long at 7807.00 with the stop at 7773.50. Risk was 33.50 points, or $167.50 per MES.
The best the trade did was 7810.25, 3.25 points or 0.10R in its favour. Price then rolled over and hit the stop in the 11:05 AM bar. Every fixed exit lost the full 1.00R, and the trailing stop lost 0.90R. Price drifted back up to 7779.00 by the 4:00 PM close, still below the entry. A target, a trail or a time stop only helps when a trade survives long enough for the rule to matter.
Entry and exit rules on a prop firm account
Prop firm evaluations and funded accounts add rules that act as exits whether you plan for them or not. A typical firm uses some mix of a daily loss limit, a trailing drawdown and a required flat time, and each one changes which exit strategy is practical.
- A daily loss limit is an account-level stop. If your per-trade stop is 1R, decide how many R the daily limit allows, and stop well before it rather than letting one more trade decide the day.
- A trailing drawdown follows your account's peak, so giving back open profit can tighten your room for the next trade. Exits that surrender large open gains, like holding to the close, cost more here than in a personal account.
- A required flat time turns every trade into a day trade. Time stops and session-close exits stop being optional, and any exit plan needs a final exit before the cutoff.
On our accounts, every position must be closed by 4:45 PM ET, with no overnight or weekend holds, and a daily loss limit puts the account in liquidation-only mode until the next trading day. Our end-of-day trailing drawdown is enforced in real time, so a bracket placed at entry is the simplest way to keep a plan intact: Tradovate's ATM strategies place the stop and target as a linked OCO pair once the entry fills, and R Trader Pro keeps stops and brackets on Rithmic's servers. Our funded accounts are simulated.
Related lesson: Risk management for traders
A checklist for pairing an entry with an exit
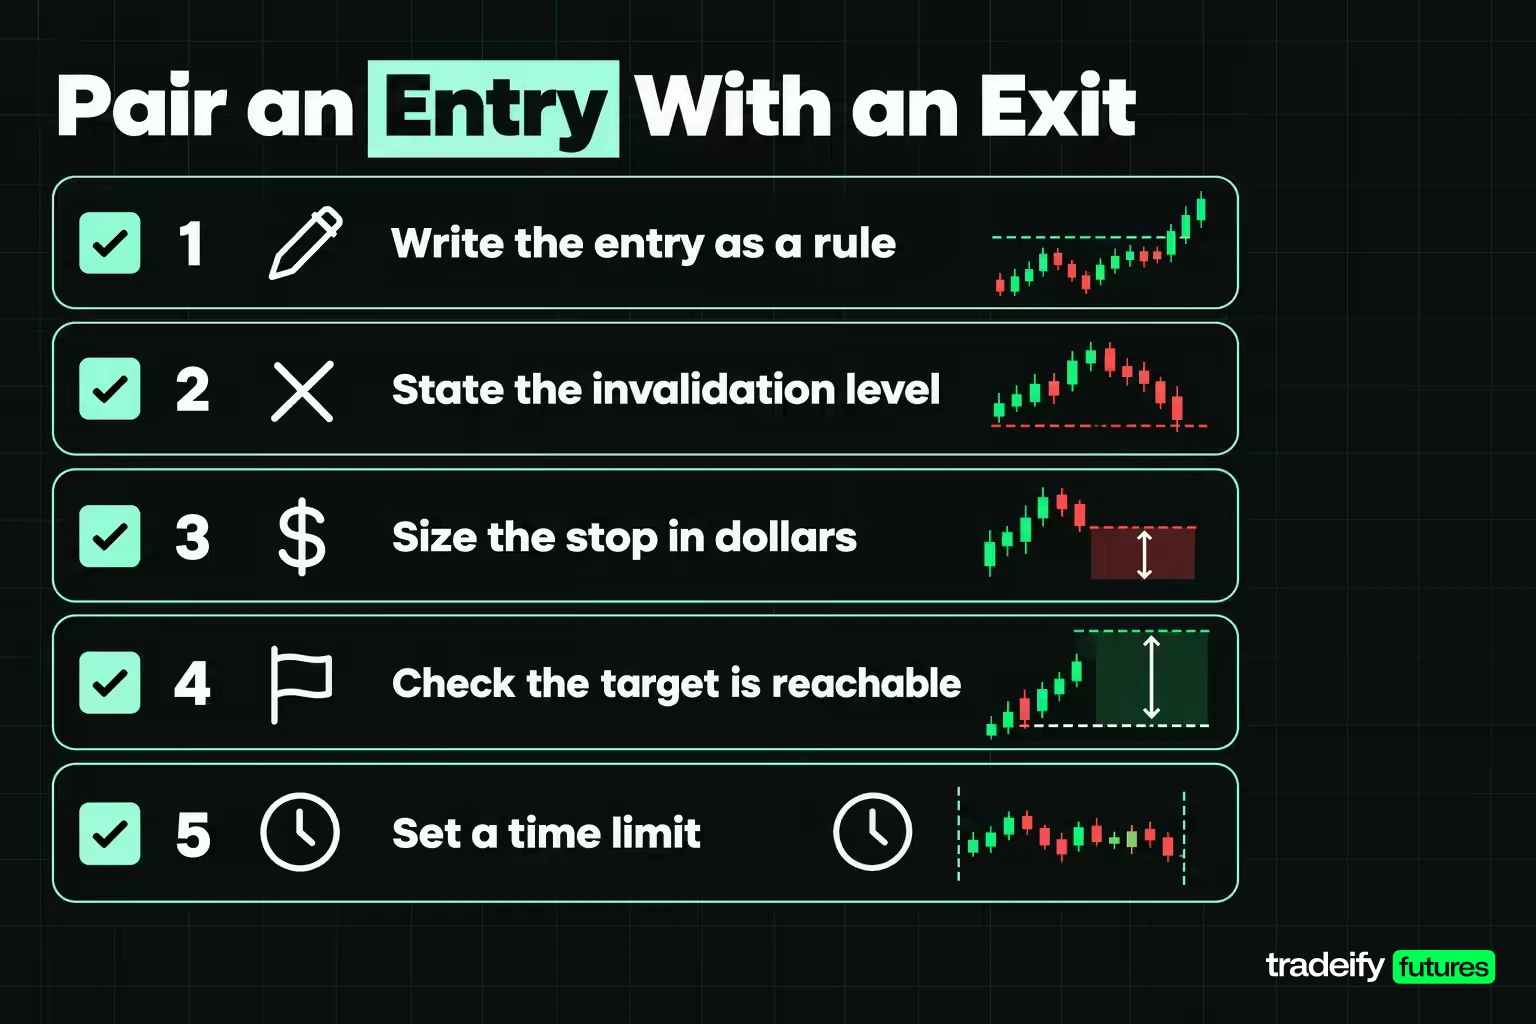
Use this checklist to build and test an entry and exit pair before the next trade, not after it.
Before placing the trade
- Write the entry as a rule: location, trigger and any confirmation, in words another trader could follow.
- State the invalidation level as a price, and what would make the idea wrong.
- Convert the stop distance to dollars for the contract you will trade, and size so it fits your per-trade limit.
- Choose how a winner ends, and check the target is reachable by looking at how often your past trades reached it.
- Calculate the required win rate from your realistic average win and average loss, and write it beside the setup.
- Set a time limit, including a final exit before any session or account cutoff.
After the trade closes
- Score bars that touch both your stop and your target as losses in your records, so the results are not optimistic.
- Record MFE and the actual result on every trade.
- Change one rule at a time. Moving the entry, the stop and the target together produces a result you cannot attribute to anything.
- Judge a rule on at least 50 trades. With a spread of around 0.8R per trade, a handful of results says almost nothing.
Related lesson: How to keep a trading journal
Entry and exit strategies FAQ
How do you identify entry and exit points in trading?
Start with a location that matters, such as support, resistance, VWAP or an opening range. Enter on a written trigger at that location, place the stop where the idea is wrong, and set the target where your past trades actually reach. Then add a time limit so the trade ends even if neither price is hit.
Is it true that 97% of day traders lose money?
It is true for one well-known study, not as a universal law. The figure comes from a study of Brazilian equity futures by Chague, De-Losso and Giovannetti. Of everyone who started day trading between 2013 and 2015 and kept going for more than 300 days, 97% lost money, and only 1.1% earned more than the Brazilian minimum wage. It is one market and one period, but it is a fair warning about how hard consistent day trading is.
Can you make $200 per day in day trading?
Some days, possibly, but no strategy can promise it. $200 is 40 points on one MES contract, 4 points on one ES, or 10 points on one NQ, before costs. The real question is how much you risk to try for it, because a strategy that needs $200 every day usually ends up forcing trades on days that offer nothing.
What is the 3-5-7 rule in trading?
The 3-5-7 rule is an informal risk heuristic, not an exchange or regulatory rule. A common version says risk no more than 3% of the account on one trade, keep total open risk at or under 5%, and aim for winners at least 7% larger than losers. Many futures traders use much smaller per-trade risk than 3%, because a short losing streak at 3% removes a large share of the account quickly.
Which matters more, the entry or the exit?
In this guide's own measurement the exit mattered more. Across 87 ES and NQ trades, changing only the exit moved the average result by 0.181R per trade. Changing only the entry moved it by 0.082R. Both matter, but the exit is usually the less tested half, so it is often where the cheapest improvement is.
Can a good exit strategy fix a bad entry?
No. In this guide's own 87-trade ES and NQ measurement, every exit rule lost money because the entry had no edge to protect. A better exit made the loss smaller. Fix the entry first, then fit the exit to what that entry actually delivers.
Should I use a fixed target or a trailing stop?
Use a fixed target when your setups usually move a modest, predictable distance, and a trailing stop when they occasionally run very far. Your own MFE records tell you which kind of setup you have.
Futures trading uses leverage, and losses can exceed what you expect, including through slippage on stop orders. The study in this guide is a description of historical price data, not a backtest with fills, costs or sizing, and its results may not repeat in other markets or periods. Prop firm evaluation and funded accounts are simulated, and results in them do not imply results in a live brokerage account. This guide is educational and is not investment advice or a recommendation to buy or sell any contract.


