




TL;DR: Building trading confidence means matching your belief in a rule to the evidence your record actually holds. On 20 years of ES data, a positive rule still lost 60.7% of its trades even with perfect execution. A 20-trade record still had a 35% chance of finishing at or below zero, so short streaks prove very little. Build execution confidence through a written rule, fixed risk, a journal and slow size increases.
Building trading confidence usually gets sold as a mindset project. Stay positive, trust the process, believe in yourself. The next decision does not care how you feel, though. The setup prints, and you either take it at the planned size or you don't.
That moment is the real problem. Not a lack of positivity, but a record too small to tell you whether hesitating is wise or costly.
This guide treats trading confidence as something you can measure instead. It uses a 20-year study of one plain E-mini S&P 500 breakout rule to show what a small record can and cannot tell you, then turns that into a practical routine for execution, risk, journaling and position size.
What Building Trading Confidence Really Means
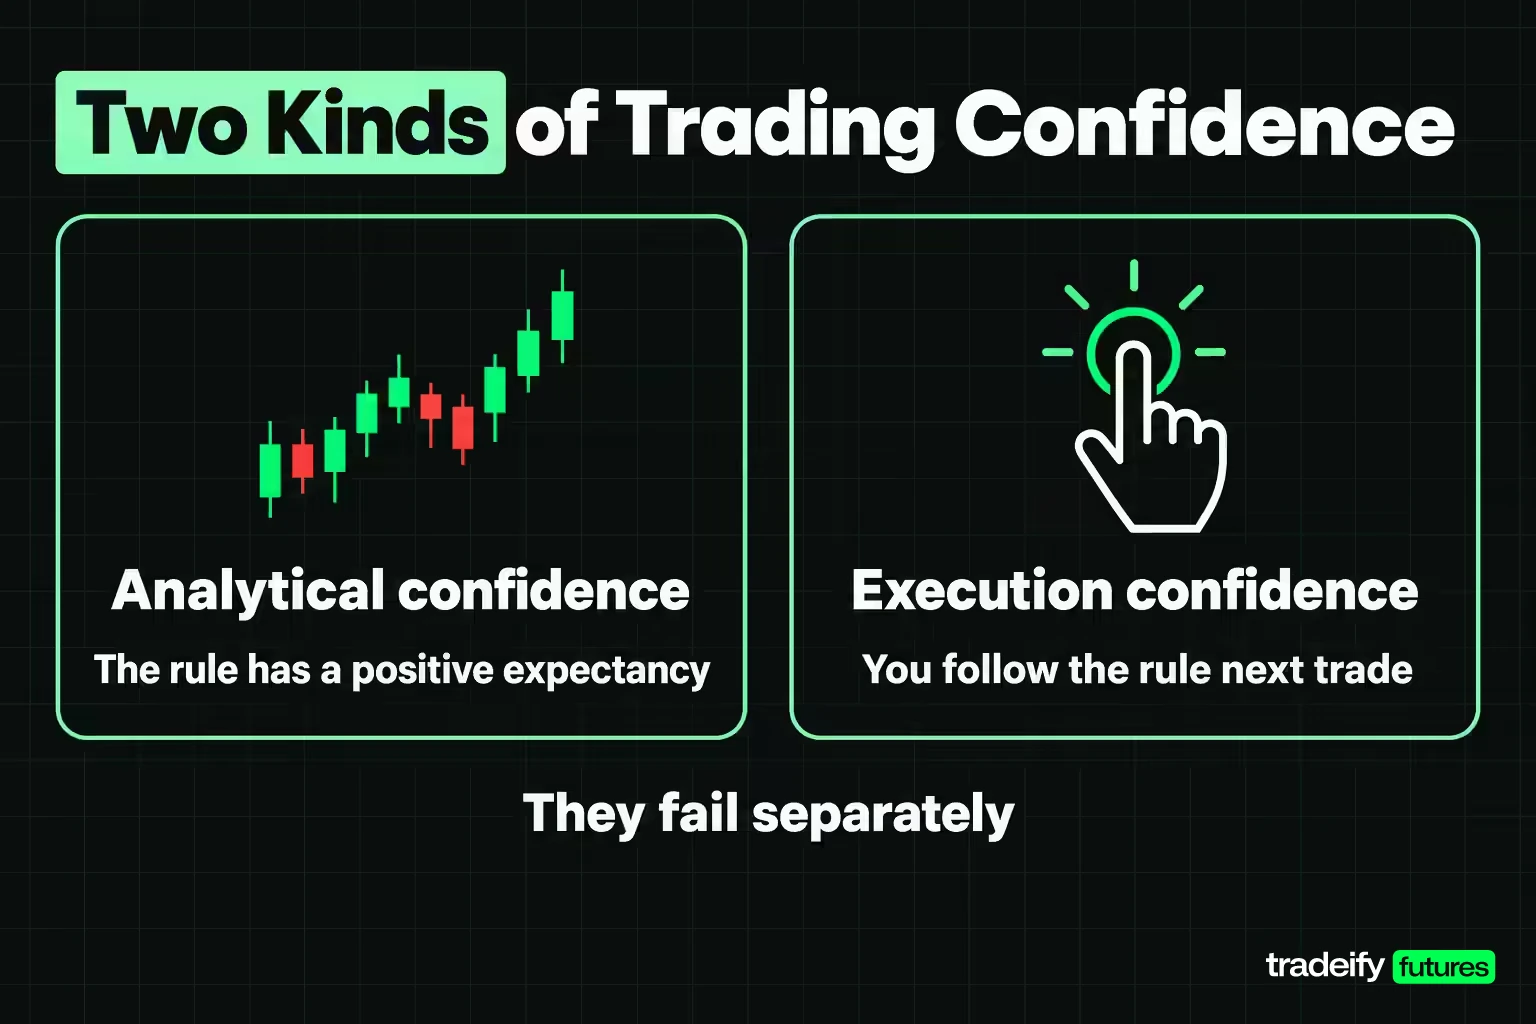
Trading confidence is a belief about results you have not seen yet. When you take the next signal without flinching, you are acting on the claim that your rule makes money over the number of trades you will take. That claim has a sample size, and it can be too big or too small for the evidence.
It helps to split it into two parts.
- Analytical confidence is your belief that the rule has a positive expectancy.
- Execution confidence is your belief that you will follow the rule on the next trade, at the planned size, whatever the last trade did.
They fail separately. A trader can believe in the rule and still freeze at the entry. Another can execute flawlessly on a rule that has never been tested. Most confidence advice blends the two, which is why it rarely helps.
The two classic errors are both estimating mistakes. Underconfidence reads a record as worse than it is and skips valid trades. Overconfidence reads a record as more settled than it is and adds size too early. Psychologist Albert Bandura's 1977 work on self-efficacy found that performance accomplishments are the most dependable source of belief in your own ability, ahead of watching others, being persuaded or how your body feels. For a trader, the performance that counts is the trade you executed according to plan, not the trade that happened to win.
Why Traders Lose Confidence and Hesitate

Confidence usually breaks after a loss, and the reason is less about the loss itself than about what it seems to say. A stop-out on a valid setup feels like a verdict on your judgment, so the next setup carries the weight of the last one. That is where hesitation starts. You wait for one more candle, the entry runs, and now you are watching a trade you were right about without being in it.
Three things make this worse.
- Outcome scoring. If you judge each trade by its result, a rule that loses most of the time will feel broken most of the time.
- Uneven timing. In this guide's 20-year E-mini breakout study on Yahoo Finance daily data, the average stop-out resolved in 5.7 sessions while the average target took 10.3 sessions. Losses arrive faster than wins, so a bad patch compresses time and feels like a regime change.
- No reference point. Without a written base rate, every loss is open to interpretation, and an anxious mind tends to pick the worst one.
Fear in trading is not a character flaw. It is a reasonable reaction to uncertainty nobody has put a number on. Put a number on it and the fear has less room to fill.
Related lesson: Why a loss feels like a verdict on the plan
A Breakout Rule Used as a Consistent Trading System
You cannot measure confidence in a rule you change every week. A consistent trading system is the precondition, because it turns your results into a sample instead of a series of unrelated experiments. So every figure in this guide comes from one fixed rule applied to one fixed data set.
This is an illustrative study computed for this guide, not a strategy recommendation. The data is Yahoo Finance's front-month continuous E-mini S&P 500 futures (ES) history on daily bars, 5,032 completed sessions from 18 September 2006 to 16 September 2026. The rule is written so anyone could rebuild it.
- Signal when a session closes above the highest high of the prior 20 sessions.
- Enter long at the next session's open.
- Place the stop 1.0 times the 14-session average true range (ATR) below entry and the target 2.0 times ATR above it.
- Close the trade at the 20th session if neither level is hit.
- If a bar touches both levels, count the stop first. A gap through a level fills at the open.
Results are measured in R, where 1R is the amount risked on the trade. Costs are not charged, so treat these as gross figures.
Taking every signal produced 590 trades with an average of 0.15R. But many of those signals fired while an earlier trade from the same breakout was still open. A real account holding one position at a time would have skipped 361 of them, leaving 229 separate trades with an average of 0.13R and a standard deviation of 1.42R. The 229 is the honest record, and it is the one this guide uses for most of the evidence.
The rule is not a recommendation, and the point is not that it works. It is a stand-in for your rule, chosen because its numbers are known.
Confidence From Evidence Starts With the Loss Rate
Here is the first number worth sitting with. In this guide's 20-year E-mini breakout study, 352 of the 590 trades lost, a loss rate of 59.7%. Of the 229 separate positions, 60.7% lost. Nothing went wrong in those trades. Every signal was taken, every stop was honoured and every exit was mechanical.
So when a trade goes against you and something in you says the method is broken, the base rate says a loss was the single most likely outcome. A rule with this shape is not failing when it loses. It is working as measured.
That is what confidence through evidence looks like in practice. A pep talk tells you to believe. Evidence tells you what to expect. Only the second one survives a losing week, because the losing week was already in the numbers.
The exit mix makes the same point.
| Exit type | Trades | Average result |
|---|---|---|
| Stop-out | 343 | -1.00R |
| Target | 203 | +2.00R |
| Time exit at 20 sessions | 40 | +0.81R |
| Gap through the stop | 4 | -1.11R |
Stop-outs were 58.1% of all trades. The edge came from targets paying twice what stops cost. If your own rule has a similar shape, a high loss rate is the design, and your confidence should be built around that fact rather than in spite of it.
How Much Confidence a Small Trading Record Can Support
The honest unit of self-belief is not the trade you just won. It is how likely a record of your size is to be positive, and how wide the range of plausible averages still is. The table below uses the 229-trade record's unrounded average of 0.125R and standard deviation of 1.418R, with a standard 95% interval around the average.
| Trades in the record | Chance the record is positive | 95% range for the average trade | Time at 11.45 trades a year |
|---|---|---|---|
| 10 | 61% | -0.75R to 1.00R | under 1 year |
| 20 | 65% | -0.50R to 0.75R | 1.7 years |
| 30 | 69% | -0.38R to 0.63R | 2.6 years |
| 50 | 73% | -0.27R to 0.52R | 4.4 years |
| 100 | 81% | -0.15R to 0.40R | 8.7 years |
| 200 | 89% | -0.07R to 0.32R | 17.5 years |
Read it as a confidence budget. Even a rule with a real positive average has a 35% chance of showing a flat or losing 20-trade record. At 100 trades the range for the average still includes zero.
Push the arithmetic further and the record needs about 490 trades before its own interval stops containing zero. At one position at a time, that is about 43 years of this rule. The real record agrees with the theory. Cut the 229 trades into 11 back-to-back blocks of 20, and 8 were positive while 3 were not, with the worst block at -11R and the best at +9.5R.
None of this is a reason to quit. It is a reason to stop treating two good months as proof and two bad months as disproof. A trader with 60 trades does not have a small amount of evidence about the rule. They have almost none. What they can build in that time is execution confidence, the ability to keep taking the signal while the answer is still unknown.
Related lesson: Waiting on a sample that has not spoken yet
Backtesting and Forward Testing Before You Trust a Rule
If a live record takes years to speak, the only way to start with analytical confidence is to borrow evidence from history. That is the job of backtesting, and each testing stage proves something different.
- Backtesting runs the written rule over historical data. It gives you the base rate, the average R, the exit mix and the size of normal losing runs. It cannot prove you will execute the rule.
- Forward testing runs the same rule in real time without changing it, on a simulator or at minimum size. It checks that the rule behaves in current conditions roughly as the backtest said, and that you can actually follow it.
- Small live or evaluation trading adds real fills and real emotion at a size where mistakes are cheap.
The mistake at each stage is expecting it to do the next stage's job. A forward test of 20 trades cannot confirm a backtest, because a 20-trade record of a working rule finished at or below zero in 35% of 20,000 resampled records drawn from the 229 separate trades in this guide's E-mini breakout study. What a forward test can confirm is that your fills, stop placement and behaviour match the rule as written.
A backtest also needs to be honest about overlap. In that same study, the 590-trade version of the rule looks better on paper than the 229-trade version because repeated signals from one breakout count the same market move several times. If your backtest takes trades your account could not hold at once, remove them before you trust the average.
Related lesson: Testing a rule on history before trusting it
Why a Winning Streak Is Not Proof of Edge
The feeling after a win is the most persuasive and least reliable evidence a trader gets. In this guide's 20-year E-mini breakout study, counting all 590 signals, it looks like a law. After a winning trade, the next trade averaged 0.96R and won 68.1% of the time. After three losses in a row, the next trade averaged -0.33R.
A shuffle test checks whether that is real. Take the same results, shuffle their order 10,000 times and measure the same thing each time. On the 590-trade sequence, the after-a-win figure beat every shuffle and the after-three-losses figure was worse than every shuffle. It looks like hot and cold streaks carry information.
Now run the same test on the 229 separate positions. After a win, the next trade averaged 0.07R and won 36.7% of the time, slightly below the record's normal 39.3%. After three losses, the next trade averaged 0.14R. Against the shuffles those readings landed at about the 35th percentile and the 49th percentile, right in the middle of chance. The streak effect on the full sequence came from overlapping trades counting one breakout several times. Remove the repeats and the streak tells you nothing about the next trade.
The same caution applies to setup probability claims. You will see setups described as working more than 65% of the time. A high win rate is only useful alongside the average win and loss, the sample size and whether the trades overlap. This rule won 39.3% of its separate trades and still had a positive average, while a 70% win rate with large losses can be negative. Edge is the average result over a large, honest sample, not the hit rate of a recent run.
Related lesson: How a short winning run inflates the estimate of your own skill
Twenty Real Trades and How Confidence Swings Through Them
Talk about sample size lands better as an actual list. These are the 20 most recent separate trades from this guide's E-mini breakout study (a 20-session high breakout with a 1 ATR stop and 2 ATR target), entries from 23 January 2025 to 5 August 2026, chosen only because they are the latest, not because they look good or bad.
Trades 1 to 10 of the twenty-trade record
| Trade | Entry date | Exit | Result | Running total |
|---|---|---|---|---|
| 1 | Jan 23 2025 | Stop | -1.0R | -1.0R |
| 2 | Feb 20 2025 | Stop | -1.0R | -2.0R |
| 3 | May 5 2025 | Time exit | +1.5R | -0.5R |
| 4 | Jun 11 2025 | Stop | -1.0R | -1.5R |
| 5 | Jun 24 2025 | Target | +2.0R | +0.5R |
| 6 | Jul 1 2025 | Target | +2.0R | +2.5R |
| 7 | Jul 24 2025 | Stop | -1.0R | +1.5R |
| 8 | Aug 14 2025 | Stop | -1.0R | +0.5R |
| 9 | Aug 29 2025 | Stop | -1.0R | -0.5R |
| 10 | Sep 12 2025 | Target | +2.0R | +1.5R |
After ten trades the record was up 1.5R, with four winners. On a small record that already feels like proof.
Trades 11 to 20 of the twenty-trade record
| Trade no. | Entered | Exit type | R result | Running R |
|---|---|---|---|---|
| 11 | Sep 23 2025 | Stop | -1.0R | +0.5R |
| 12 | Oct 2 2025 | Stop | -1.0R | -0.5R |
| 13 | Oct 27 2025 | Stop | -1.0R | -1.5R |
| 14 | Dec 23 2025 | Stop | -1.0R | -2.5R |
| 15 | Apr 10 2026 | Target | +2.0R | -0.5R |
| 16 | Apr 20 2026 | Target | +2.0R | +1.5R |
| 17 | May 7 2026 | Target | +2.0R | +3.5R |
| 18 | May 29 2026 | Stop | -1.0R | +2.5R |
| 19 | Jul 13 2026 | Stop | -1.0R | +1.5R |
| 20 | Aug 5 2026 | Stop | -1.0R | +0.5R |
Read the running total across both halves, not the rows. Ten trades in, the record was up 1.5R and looked competent. Fourteen trades in it was down 2.5R after four straight stop-outs. Then three targets in a row took it to +3.5R before three more stops gave most of it back. Only 7 of 20 trades won, 35%.
At an illustrative $250 of risk per trade, that is a low of -$625, a peak-to-trough drop of $1,250 and a finish of +$125. A trader living through this window would have felt like a genius in July 2025, a fraud by December and a genius again in May 2026. The rule did not change once.
Execution Discipline When Confidence Is Low
Low confidence becomes a problem when it changes what you do. The most common version is hesitation: skipping a valid signal, entering late, or taking it at half size because the last one hurt. Each of those quietly changes the rule you are testing.
The cost is concrete. A rule's average only applies to the trades you actually take. In the latest 20 trades of this guide's E-mini breakout study, a trader who sat out after the four straight stops would have missed the three targets that rescued the record. Skipped trades are not neutral. They cluster after losses, and the shuffle test on separate positions found that the trade after a losing run was no worse than any other.
A few practical rules help.
- Track your execution rate: valid signals taken divided by valid signals seen. Aim to raise that number before you raise size.
- Decide entry, stop and target before the market reaches your level, then place them as one bracket order so there is nothing left to decide.
- Write a rule for hesitation in advance, such as "if I miss the entry by more than a set amount, the trade is skipped and logged as missed".
- Shrink size instead of skipping. Taking a valid signal at minimum size keeps the habit intact when your nerve is short.
Some traders automate the rule entirely to remove the decision. That can help with hesitation, but it moves the confidence problem rather than solving it. You still have to trust the code through a losing run, and an automated rule that you switch off after five losses has the same problem as a manual one.
Related lesson: Holding to a written process when the answer is unsettled
Keeping Confidence Inside an Open Trade
Hesitation hurts at the entry. Inside the trade the risk flips, and it becomes the fear of giving back open profit. The trade runs toward the target, pulls back, and the urge to grab what is there gets loud. Closing early feels like protecting yourself. Over a sample it often removes the wins the rule depends on.
In this guide's 20-year E-mini breakout study, the 203 targets paid +2.00R each and averaged 10.3 sessions to arrive. Trades that reached neither level and closed at the time limit still averaged +0.81R. A trader who routinely cut winners at +1R would have turned the largest source of the rule's profit into something much smaller, while every stop-out still cost a full -1R. With a loss rate near 60% in that study, that is the difference between a positive and a negative rule.
Managing emotions inside a trade works best with decisions made in advance.
- Know the trade's job before entry: target, stop and time limit, written down.
- Decide when, if ever, you move the stop, and make it a rule rather than a feeling. Moving a stop to breakeven early changes the rule's win and loss mix and needs its own test.
- Look away from open profit and loss if you check it compulsively. The bracket order is already working.
- After the trade, log whether you followed the plan, separate from whether it won.
Stop Losses and Risk Limits Set Before the Entry
Predefined stops do more for confidence than almost anything else, because they price being wrong before you are wrong. When the loss is known in advance, a stop-out is a business expense, not a crisis.
The stop in this guide's E-mini breakout study was based on volatility, one ATR below entry, so its width followed the market. In its latest 20 trades, stop distances ranged from 59.1 to 161.6 points. That is why sizing in R matters. An 80-point stop is $4,000 on one ES at $50 a point, and $400 on one Micro E-mini S&P 500 (MES) at $5 a point. The same chart idea can be a reasonable risk or a reckless one depending on the contract and quantity.
Layer the limits.
- Per trade: a fixed dollar risk or fixed fraction of the account, set by the stop distance and contract size.
- Per day: a daily loss limit that ends the session, so a bad day cannot become a bad month.
- Per week or per drawdown: a pause and review point, decided in advance.
Many platforms let you set these as hard lockouts rather than relying on willpower at the worst moment. A limit you set while calm protects the version of you that has just taken three stops.
Related lesson: Where to place a stop and why
The Before, During and After Loop for Building Trading Confidence
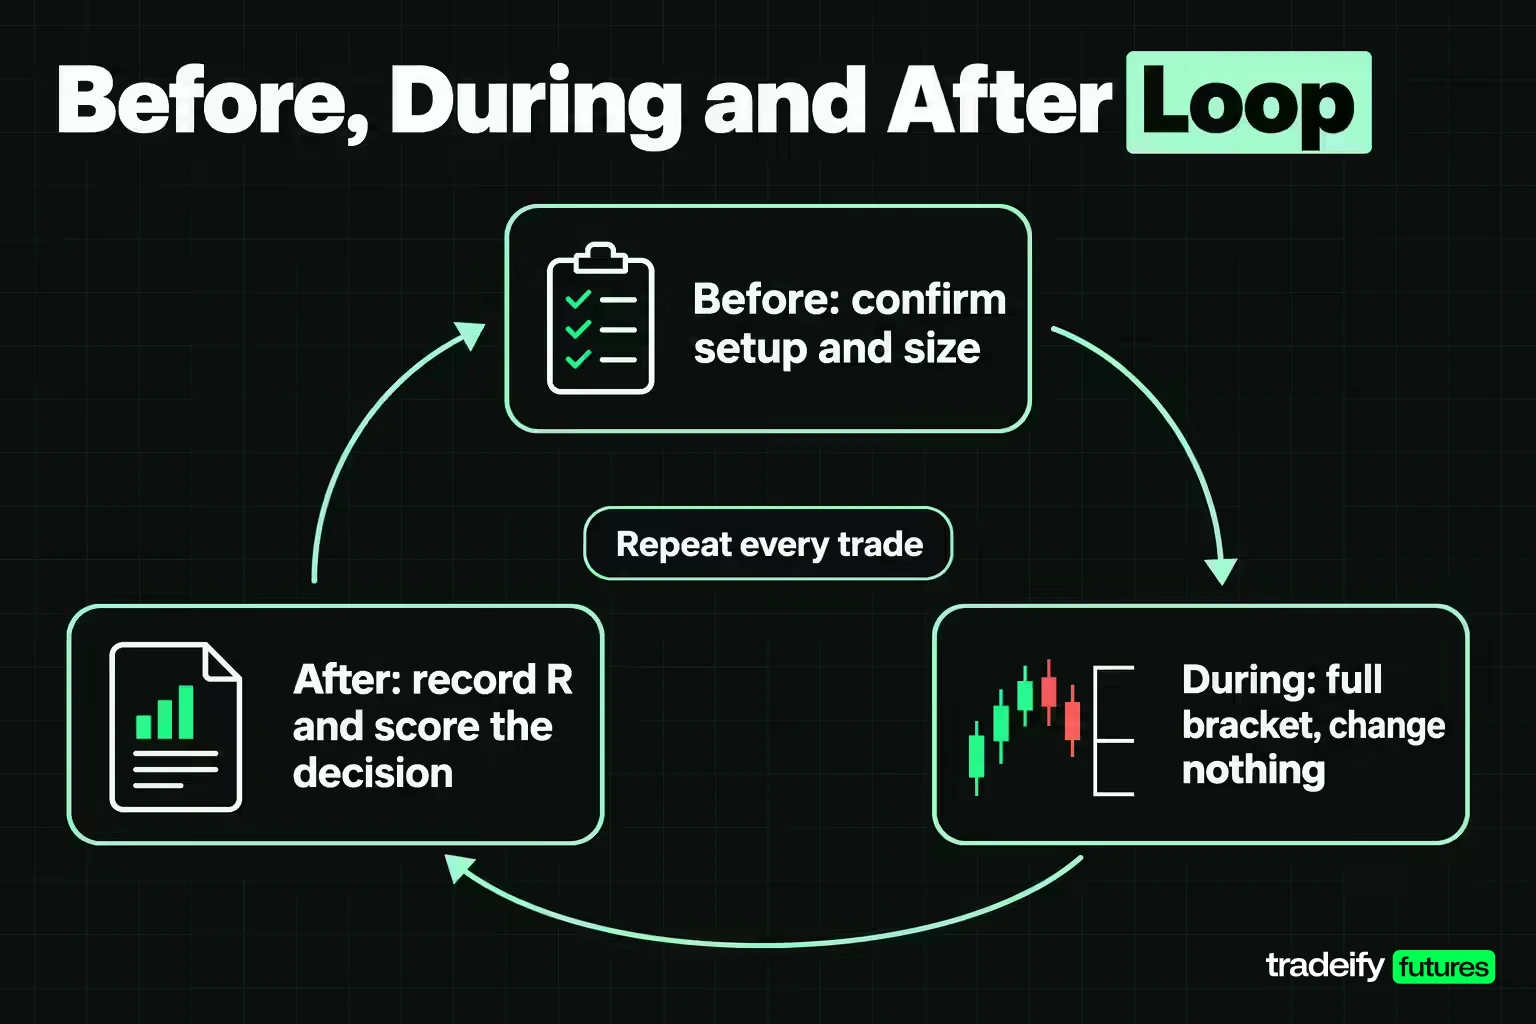
Confidence that lasts comes from a loop you repeat on every trade, not from a single good week. Each pass through the loop is one more piece of evidence that you can execute, regardless of whether the trade won.
Before the trade:
- Confirm the setup meets the written rule, not most of it.
- Check the stop distance and size the position so the loss equals your planned R.
- Note anything that would make you skip it, such as a scheduled data release your rule excludes.
During the trade:
- Place the full bracket at entry.
- Change nothing that the plan does not allow.
- If you feel the urge to intervene, write the urge down instead of acting on it.
After the trade:
- Record the result in R and whether you followed every step.
- Score the decision, not the outcome. A followed stop-out is a good trade.
- Once a week, compare your loss rate and average R with the rule's base rate.
The loop matters because it builds the competence part of confidence directly. After 50 trades you may still not know whether the rule works. You will know whether you can follow it, and that is the part you actually control.
A Trading Journal That Records Decisions, Not Just Results
A journal is where confidence gets its evidence, but only if it records the right things. A bare list of wins and losses mostly feeds mood swings, a great week followed by a crushing one. A useful journal separates the decision from the result.
For each trade, record:
- Date, instrument and setup, in the rule's own terms.
- Planned entry, stop, target and size, and the actual fills.
- Result in R.
- Whether the rule was followed fully, partly or not at all, with a short reason.
- Whether the trade overlapped another open position on the same idea.
- Your state before entry in a word or two: calm, rushed, tired, angry.
Then review on a schedule, not after each loss. Weekly, check execution rate and rule breaks. Monthly, check loss rate and average R against the base rate. Every 50 trades, recompute your interval and see whether it has narrowed.
The journal makes one distinction possible that nothing else does. A stop-out that followed the plan and a stop-out after you moved the stop are different events. If your records cannot tell them apart, every loss reads as a personal failure.
Related lesson: Recording the decision separately from the result
The Confidence Claim Audit
The Confidence Claim Audit is six lines on one page, filled in before you change size or change rule. The idea is to write your confidence down in a form that can be wrong.
- The claim. The sentence you are acting on, such as "this rule is profitable" or "I am ready to size up".
- The sample. How many trades, and how many were separate positions. In this guide's E-mini breakout study that was 590 against 229.
- The interval. The range your average trade plausibly sits in. If it contains zero, write that down. It is a normal state for a young record.
- The base rate. The share of trades that should lose if the rule is working. In the same study it was 60.7%. If your recent loss share is near your base rate, nothing has gone wrong.
- The falsifier. The result that would make you abandon the claim, written before you need it, such as a drawdown deeper than the worst the backtest produced.
- The review date. When you will look again, chosen in advance so a bad Tuesday cannot trigger a rewrite.
The audit is not a trading plan. It is the minimum paperwork for holding a belief at the size the evidence supports.
Related lesson: Measuring the process rather than the equity curve
Scaling Position Size as Your Confidence Is Earned
Position size is where confidence turns into money, so it should follow evidence rather than mood. The common mistake is sizing up after a hot week. On separate positions in this guide's E-mini breakout study, the trade after a win was no better than any other, so that is sizing up on noise.
A steadier approach ties size steps to sample size and execution quality.
- Start at a size where a full losing run is boring. The breakout study's 229 separate trades included a run of 9 losses in a row, so assume a long losing run is coming.
- Use micro contracts for the first stage. One MES is one tenth of an ES. With a 20-point stop, one ES risks $1,000 while one MES risks $100.
- Raise size in small steps, such as 2 MES ($200 at a 20-point stop) and then 5 MES ($500), only after a set number of trades with a high execution rate and no rule breaks.
- Cut back a step after a predefined drawdown, and step back up only through the same criteria.
The trigger for each step should be written before the trades happen. That stops a good week from setting your risk and a bad week from wrecking your process.
On our accounts, contract limits do part of this work for you. A 50K account allows 4 minis or 40 micros, with 10 micros counting as one mini, so you can trade micros well inside the limit while your record builds. Select funded accounts start with reduced contract limits and scale up as the account grows, while Growth and Lightning accounts use the full limit from day one. Positions must be closed by 4:45 PM ET, so a multi-day rule like the study's would need an intraday version on our accounts. Tradovate Risk Settings and Tradesea lockouts let you set your own daily loss limits on top of our rules, and funded accounts are simulated.
Related lesson: Sizing positions from the stop distance
Where the E-mini Confidence Study Stops
The E-mini breakout study behind this guide's confidence figures has clear limits. It covers one instrument, one rule and daily bars from one 20-year stretch. The continuous series splices contract months together, and rolling costs, commissions and slippage are not charged. Daily bars force an assumption about which level a bar touched first. The trades hold for days, which an intraday trader cannot copy directly.
None of that changes the core lesson, which comes from arithmetic rather than from this particular rule. A rule with a modest positive average and a loss rate near 60% needs hundreds of separate trades before its record settles. Your rule will have different numbers. Compute them the same way before you decide how confident to be.
Questions About Trading Confidence
How long does it take to build confidence in trading?
Execution confidence can build within weeks if you follow a written rule on every trade and score yourself on following it. Analytical confidence takes far longer. In this guide's 20-year E-mini breakout study, a rule with a positive average needed about 490 separate trades, roughly 43 years at its pace, before its own record excluded zero. That is why backtesting and execution metrics carry most of the load early on.
Does a losing streak mean I have lost my edge?
Usually not. In the 229 separate trades of this guide's 20-year E-mini breakout study, the trade after three losses averaged 0.14R, close to the normal average, and the record included a run of 9 losses in a row. Compare your streak with the losing runs your backtest already produced before drawing a conclusion.
Should I feel confident after a winning streak?
Enjoy it, but do not size up on it. In this guide's E-mini breakout study, counting separate positions only, the trade after a win averaged 0.07R and won 36.7% of the time, no better than any other trade. A streak tells you about your recent past, not your next trade.
Is it bad to trade with low confidence?
It depends on what the low confidence does. If it makes you skip valid signals, it is changing your rule and costing you trades. If it keeps your size small while your record is young, it is doing useful work.
How many trades do I need before I size up?
There is no single number. In resampling from this guide's 20-year E-mini breakout study, a 20-trade record of a working rule finished at or below zero 35% of the time. Tie size increases to a written rule based on sample size, execution rate and drawdown, and take small steps rather than one large jump.
A Confidence Plan for Your Next Twenty Trades
Before your next 20 trades, write down six things: the claim you are acting on, your trade count, the range your average trade plausibly sits in, your rule's expected loss rate, the result that would prove you wrong, and your next review date. Keep the page where you look before you trade. The range for your average will probably still contain zero. That is not a verdict on your ability. It is an accurate description of a young record, and the work for the next 20 trades is to follow the rule, log every decision and leave size alone until your written criteria say otherwise.
Related lesson: The foundations this measurement assumes
Futures trading involves substantial risk of loss, and leverage means losses can exceed what you expect. The study in this guide applies a mechanical rule to historical daily data under stated assumptions, and past results do not indicate future results. Funded and evaluation accounts are simulated and differ from live trading in fills, costs and rules. This guide is educational and is not individual advice or a recommendation to trade any instrument.


