



TL;DR: Trading is buying and selling stocks, futures, forex or crypto to profit from price moves over minutes to weeks, not years. Size every trade from a fixed risk first, such as 1% of a $50,000 account, or $500. Eight MES contracts with a 12-point stop risk $480 at $5 per index point. Thirty contracts risk $1,800 a trade, and three losses cost nearly 11% and need a 12.1% gain to recover.
Trading is buying and selling a financial instrument, such as a stock, a futures contract or a currency pair, to profit from a change in its price. That definition is accurate. It just won't help much the first time price moves against you and you have to decide what to do.
What it leaves out is that every trade is a decision made under uncertainty. Most of the work happens before the order goes in: how much you can lose, the price where your idea is wrong, and what you will do when price gets there. Get those three right and a losing trade is just a cost. Skip them and one bad afternoon can end an account.
This guide covers what trading is, how an order turns into a fill, what you can trade, the main styles and strategies, and the risk arithmetic that keeps a normal losing streak survivable. It is written for someone who has not placed a live trade yet, or who has placed a few and wants the foundation rebuilt properly.
What Is Trading in Financial Markets
Trading in financial markets means buying and selling instruments over a short to medium window to profit from price changes, rather than owning them for years. You take one side of a price agreement and accept the result if price moves against you.
A market price is the last price at which a buyer and a seller agreed to transact. It is not a verdict on value. It is the current best guess of everyone willing to trade at that moment, and it changes the second someone with a different view acts on it.
Why every trade has someone on the other side
You cannot buy unless someone sells. The person on the other side may be closing an old position, protecting a business from a price move, or betting the opposite way on purpose. They are not automatically wrong, and you are not automatically right.
The CFTC describes most futures market participants as hedgers, who trade to reduce the risk of losses from price changes, and the rest as speculators, who try to profit from those changes. A trader is usually a speculator. That role is useful: speculators take on price risk that hedgers want to hand off, and they expect to be paid for carrying it only when they carry it well.
What makes trading different from just buying something
Buying a stock and forgetting about it is ownership. Trading adds three decisions that ownership can skip:
- An exit plan. A trade has a price where you take profit and a price where you admit you were wrong.
- A time window. The idea is expected to work within minutes, days or weeks, not someday.
- A defined size. The quantity comes from how much you are willing to lose, not from how much money is sitting in the account.
Miss any of the three and you still have a position. You just don't have a trade.
Trading vs Investing
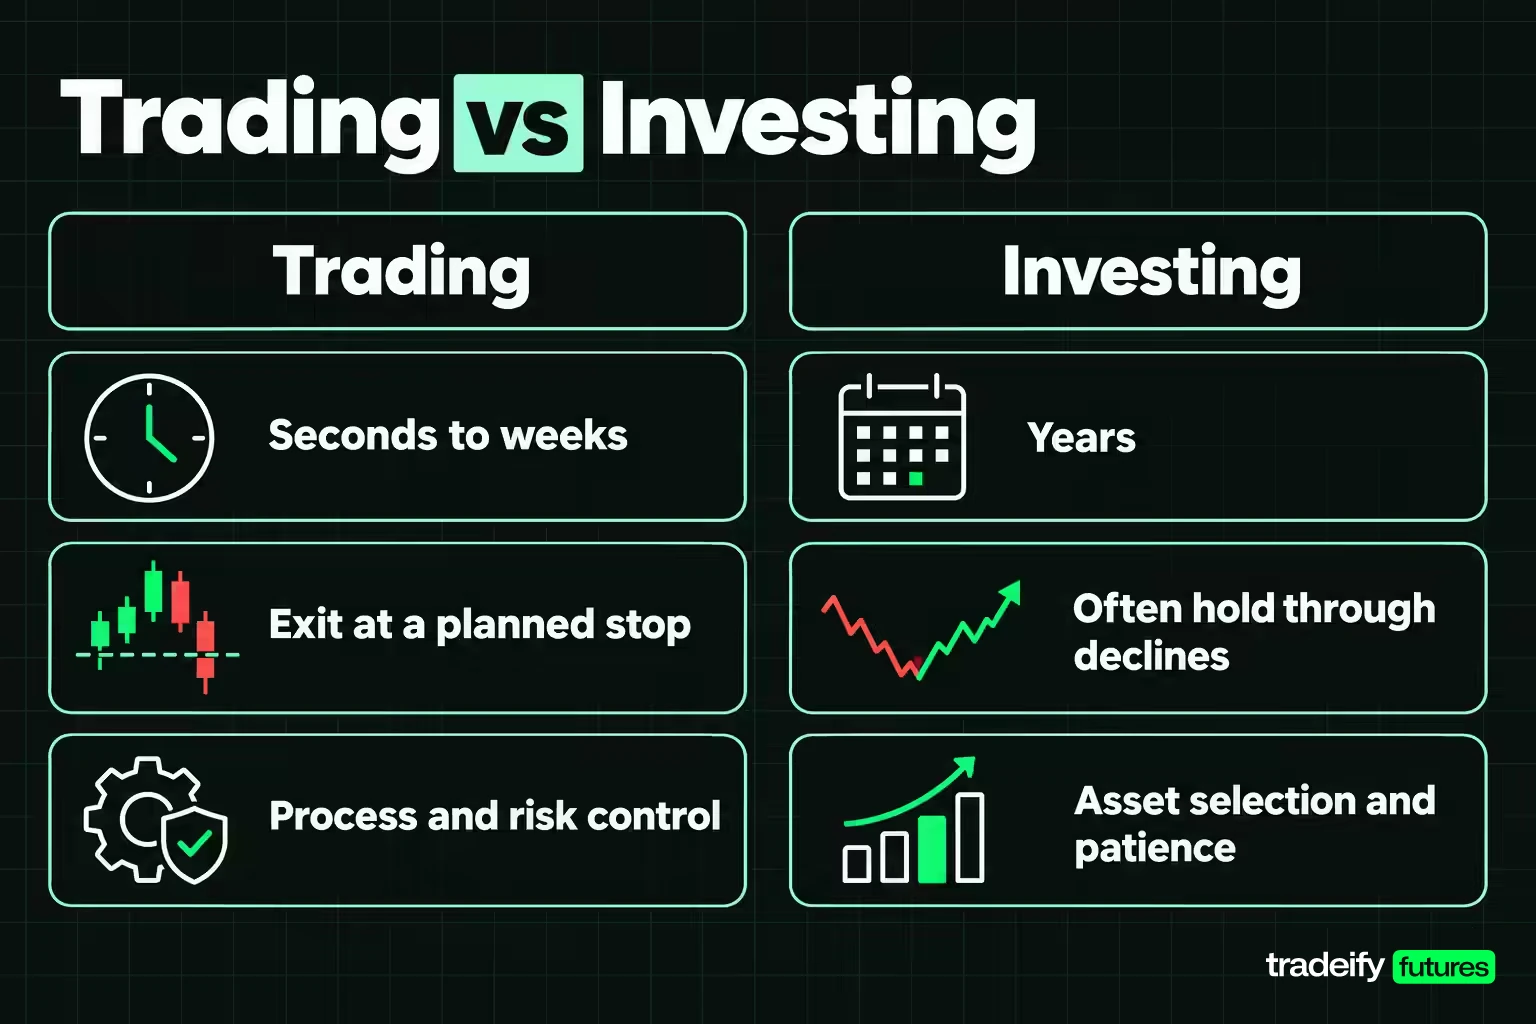
Trading and investing both involve buying financial assets, and they get used as if they mean the same thing. They do not, because they pay you for different things.
Investors are paid for owning an asset over a long period, through price appreciation and sometimes dividends or interest. Traders are paid for being right about price movement over a shorter window and for managing that decision well when they are wrong.
| Factor | Trading | Investing |
|---|---|---|
| Typical holding period | Seconds to weeks | Years |
| What you are paid for | Correct, well-managed short-term price calls | Growth and income from owning the asset |
| Response to a drawdown | Exit at a planned stop | Often hold if the long-term case is intact |
| Profiting from falling prices | Common, by selling short | Rare for long-term investors |
| Main skill | A repeatable process and risk control | Asset selection and patience |
| Time commitment | High, often daily screen time | Lower, periodic review |
The drawdown row is where beginners get caught. An investor can sometimes sit through a decline because the reason for owning the asset runs over years. A trader's holding period is too short for that reasoning to work, so a trader who "just holds" a losing trade has quietly turned it into an unplanned investment with no thesis behind it.
Neither approach is better in general. They are different jobs with different risks, and the right one depends on the hours you actually have and the kind of decision you want to be judged on. Plenty of people do both, in separate accounts, with separate rules.
Related lesson: Trading vs. investing
How Trading Works From Order to Settlement
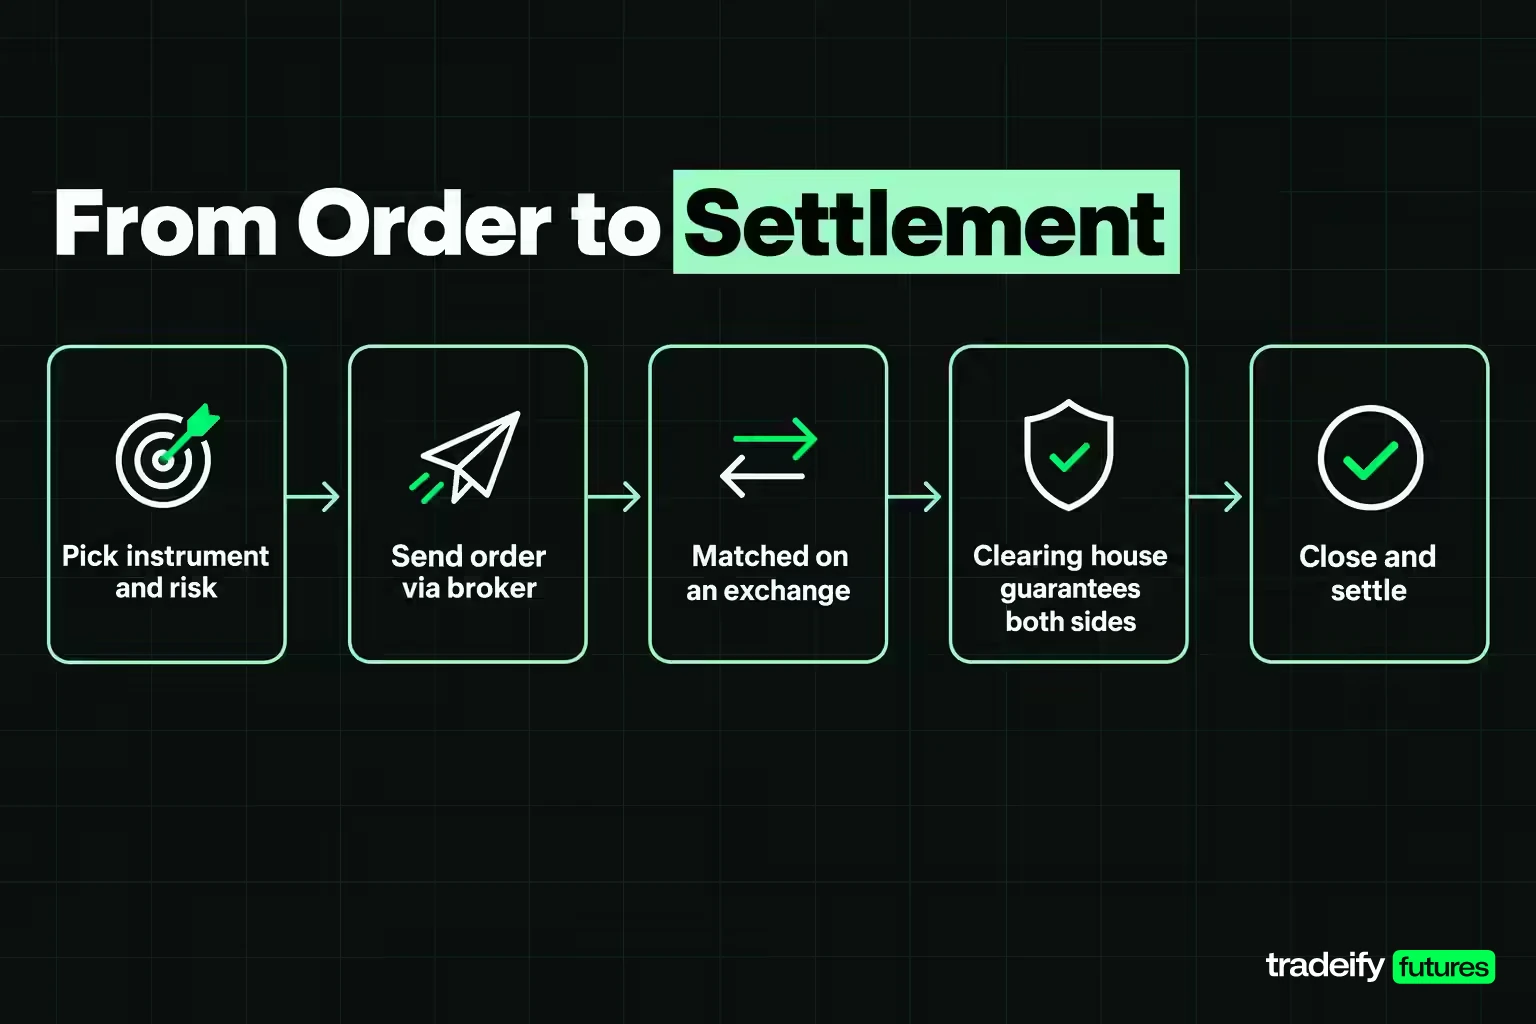
Trading works through a chain of steps that turns your decision into a completed transaction. The mechanics look like this:
- You choose an instrument, such as a stock, an ETF, a futures contract or a currency pair.
- You decide how much you are willing to lose if you are wrong.
- You choose a direction and an order type, then send the order through your broker's platform.
- The broker routes the order to an exchange or other venue, where it is matched against an opposite order.
- A clearing house steps between buyer and seller so each side's obligation is guaranteed.
- You close the position later at a profit or a loss, and the transaction settles.
Steps 2 and 6 are where accounts are made and lost. Steps 1, 4 and 5 are mostly plumbing, but knowing the plumbing explains why fills are not always the price you saw.
Who is in the market with you
Every market mixes several kinds of participants, and each has a different reason to trade:
- Hedgers such as farmers, airlines or fund managers who use markets to reduce a price risk they already carry.
- Market makers who post bids and offers continuously and earn the spread in exchange for supplying liquidity.
- Institutions such as pension funds and asset managers moving large orders, often split into many smaller pieces.
- Speculators, including retail and professional traders, who take directional price risk.
Liquidity, meaning how easily you can trade without moving the price, comes from this mix. In a deep market your order fills close to the price on screen. In a thin market your own order moves the price, and you pay for that move.
When markets are open and how trades settle
Market hours depend on the venue. The NYSE Core Trading Session runs 9:30 AM to 4:00 PM ET. CME Globex lists E-mini S&P 500 futures from Sunday 6:00 PM to Friday 5:00 PM ET, with a daily maintenance period from 5:00 PM to 6:00 PM ET, which is why futures traders can react to overnight news that stock traders only see at the open.
Settlement is the official exchange of cash and securities after a trade. Since May 28, 2024, most US securities transactions settle on T+1, one business day after the trade, so a stock sold on Monday settles on Tuesday. Futures work differently: positions are marked to the market daily, and gains and losses move through the account every session.
Related lesson: How financial markets work
Trading Orders and Long or Short Positions
Trading orders are the instructions that tell the market what you want and on what terms. The order you pick decides whether you get price certainty or fill certainty, because you rarely get both.
- Market order. Fills right away at the best available price. Fastest fill, least control over price.
- Limit order. Fills only at your price or better. You control price and give up certainty of a fill.
- Stop order. Becomes a market order once a trigger price trades. Used to exit a losing position or to enter on confirmation.
- Stop-limit order. Becomes a limit order at the trigger. You avoid a bad fill but may not get filled at all.
- Bracket order. An entry with a stop loss and a profit target attached, where filling one exit cancels the other.
A stop order is not a guarantee. In a fast market, or when price gaps past your level, a stop can fill well beyond the price you chose. Plan around the fill you might get, not the one you asked for.
Going long and going short
Going long means you profit if price rises. Going short means you profit if price falls, by selling first and buying back later. Both are directional decisions, and they differ only in which direction proves you wrong.
Short selling carries one structural risk worth naming. A price can rise further than it can fall, so a short position has no natural ceiling on its loss. Risk on a short has to be defined by your stop and your size, not by the shape of the chart.
In futures, going short is as simple as going long, because a futures contract is an agreement rather than a borrowed share. In stocks, shorting usually requires borrowing shares through a margin account, with borrowing costs and the chance of a forced buy-in.
Related lesson: Order types overview
Trading Assets and Instruments Compared
Trading happens across several asset classes, and each one has its own hours, leverage, costs and quirks. Here is how the main ones compare in plain terms.
| Instrument | What you trade | Typical hours | Built-in leverage | Notes for beginners |
|---|---|---|---|---|
| Stocks | Shares of ownership in a company | Exchange session plus extended hours | None unless you use margin | Simple to understand, settle T+1 in the US |
| ETFs | A basket of assets traded like one stock | Same as stocks | None unless you use margin | One trade gives exposure to an index or sector |
| Futures | Standardized contracts to buy or sell later at an agreed price | Nearly around the clock on weekdays for major contracts | High, set by contract size | Contracts expire and have fixed tick values |
| Forex | Currency pairs such as EUR/USD | 24 hours on weekdays | Often high | The largest market by turnover |
| Options | The right, not the obligation, to buy or sell at a set price | Exchange session | High, and nonlinear | Prices depend on time and volatility as well as direction |
| Crypto | Digital assets and their derivatives | 24 hours, 7 days | Varies widely | Rules and protections differ by venue and country |
| CFDs | A contract paying the price difference of an underlying | Varies by provider | High | EU regulators restricted retail CFD sales in 2018 |
Scale differs enormously across these markets. The BIS Triennial Survey puts global FX trading at $9.6 trillion per day in April 2025, which is why major currency pairs are so liquid.
Why futures size works differently
Futures make the link between instrument choice and risk very visible. A Micro E-mini S&P 500 contract (MES) is worth $5 times the index, with a minimum tick of 0.25 index points worth $1.25. The full E-mini (ES) is $50 times the index, with each tick worth $12.50.
At an illustrative index level of 7,000, one ES contract controls $350,000 of exposure and one MES controls $35,000. Same chart, ten times the consequence per point. The contract you pick is part of your position size before you have decided how many to trade.
Related lesson: Major asset classes
Trading Styles and How Long Trades Last
Trading styles are mostly defined by how long you hold a position, and that one choice drives everything else: how much screen time you need, what costs matter, and which risks you carry.
| Style | Typical holding period | Screen time | Main risk | Cost sensitivity |
|---|---|---|---|---|
| Scalping | Seconds to minutes | Constant during the session | Costs and slippage eat a small edge | Very high |
| Day trading | Minutes to hours, flat by the close | Several focused hours a day | Overtrading and impulsive entries | High |
| Swing trading | Days to weeks | An hour or two a day | Overnight and weekend gaps | Moderate |
| Position trading | Weeks to months | Periodic review | Large adverse trends and patience | Low |
Each style trades one problem for another. Day traders avoid overnight gap risk but pay more in commissions and spread because they trade more often. Swing traders pay less in costs but can wake up to a price far beyond their stop after weekend news.
How to choose a trading style
Start with your real schedule, not the style that sounds most exciting. If you work during market hours, scalping a stock index at the open is not a style. It is a scheduling conflict with money attached. A swing approach reviewed in the evening, or a day-trading window that matches a session you can actually attend, will usually be more honest.
Then match the style to how you handle pressure. Some traders find fast decisions easier because there is no time to second-guess. Others make their worst decisions in fast markets and do better with a plan written the night before. Your journal, not your preference, should settle it after a few weeks.
Related lesson: Trading styles explained
Trading Analysis and Common Strategies
Trading analysis is how you form a view on where price might go and, more importantly, where your view is wrong. Most approaches fall into three groups.
- Technical analysis reads price, volume and chart structure: trends, support and resistance, ranges and breakouts.
- Fundamental analysis looks at what drives value: earnings and guidance for stocks, interest rates and inflation for currencies and index futures, supply and demand for commodities.
- Sentiment and flow analysis looks at positioning and behaviour, such as how crowded a trade is or how price reacts to news.
Short-term traders lean on technical analysis because it gives precise levels for entries and stops. Fundamental analysis often decides the backdrop, such as whether a data release makes a trend more or less likely to continue.
Three common trading strategy families
Most beginner strategies belong to one of three families:
- Trend following. Trade in the direction of an established move, usually after a pullback. It works when markets trend and bleeds small losses in ranges.
- Breakout trading. Enter when price leaves a defined range with conviction. It catches big moves and suffers from false breakouts that snap back.
- Mean reversion. Fade stretched moves back toward an average or the middle of a range. It wins often and can take large losses when a range turns into a trend.
None of them works all the time. The skill is recognising which conditions suit your strategy and doing nothing when they don't. In a dull, sideways session, sitting out is a decision, not a failure to act.
Observation, confirmation and invalidation
A useful habit is to separate what you see from what would confirm it. Imagine price pulls back to a level that held twice before. That is an observation. A confirmation might be price holding the level and printing a higher low on your timeframe. Invalidation is a clean break and close below the level.
You can read the direction correctly and still have no entry. Those are two separate decisions, and treating them as one is how traders end up chasing.
Why expectancy matters more than win rate
A strategy does not need to win most of the time. Take an illustrative strategy that wins 40% of trades, with an average win of $300 and an average loss of $150. Its expectancy is 0.40 times $300 minus 0.60 times $150, which is $120 minus $90, or $30 per trade before costs.
That strategy loses more often than it wins and still has a positive expectancy. The reverse is also true: a high win rate with small wins and occasional large losses can quietly lose money. Judge a strategy on a journal or backtest of many trades, never on how the last three felt.
Related lesson: Technical analysis complete beginner guide
Risk Management in Trading
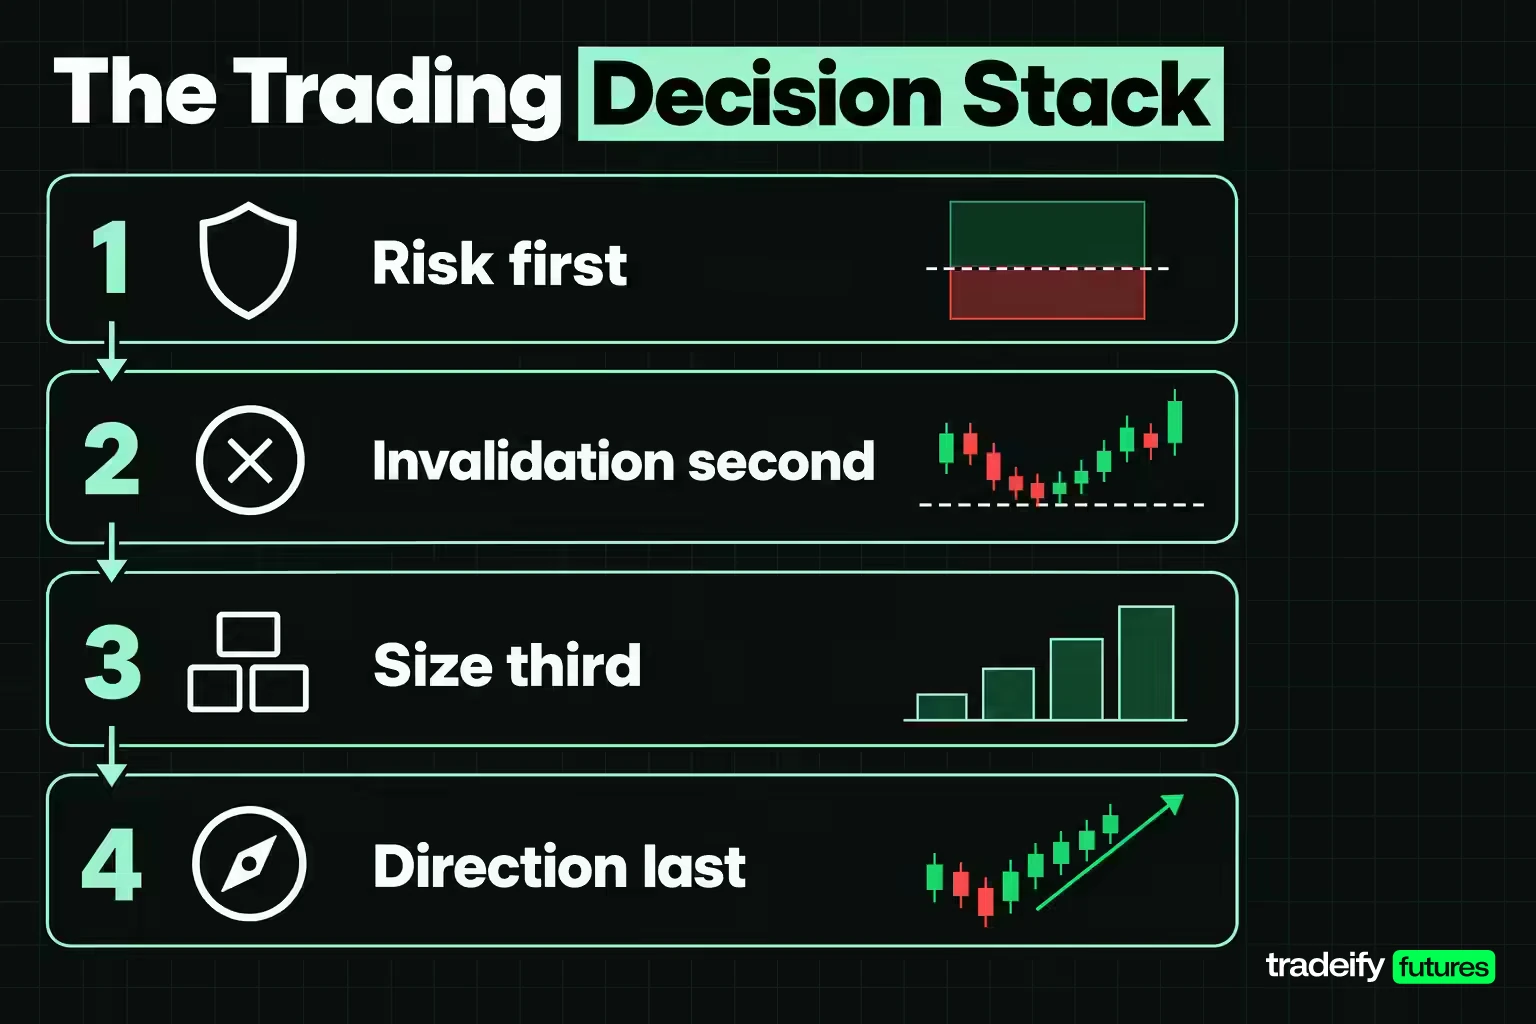
Risk management in trading is the set of decisions that controls how much you can lose on any trade, any day and any losing streak. Most new traders order those decisions backwards. They pick a direction, look for somewhere to put a stop, and size from whatever money is available. That turns risk into an afterthought, and afterthoughts get ignored under pressure.
The trading decision stack, size first and direction last
Run the decisions in this order instead:
- Risk first. Decide the most you will lose on this trade before you know whether you like it. Many traders use a small fixed percentage of account equity. The exact number matters less than the fact that it is fixed in advance.
- Invalidation second. Find the price where your reason for the trade stops being true. That price sets your stop distance. If the distance is too wide to size sensibly, the trade is a pass, not a reason to tighten the stop.
- Size third. Divide your risk amount by the risk per share or contract, then round down. Always down.
- Direction and entry last. With the first three fixed, direction is simply the side your analysis supports.
This order will occasionally tell you to skip a trade you really wanted. That is the point of it. The trades your rules reject are often the ones you would have sized from excitement.
Worked example for sizing a stock trade
Take an illustrative $25,000 account with a rule of risking 0.5% per trade, which is $125. You want to buy a $40 stock, and your invalidation price is $38, so your risk per share is $2.
$125 divided by $2 is 62.5 shares. Round down to 62 shares. That position commits $2,480 of the account, and you risk $124 if the stop fills at your price.
Notice what this exposes. A half-percent risk decision still committed nearly 10% of the account to one position. Risk-based sizing controls what you lose when you are wrong. It does not control how much capital is tied up or how many positions you hold at once, so set those limits separately.
Worked example for sizing a futures trade
Risk-based sizing works the same way in futures, with contracts instead of shares. Take an illustrative $50,000 account risking 1% per trade, which is $500. The setup is long MES, the Micro E-mini S&P 500 futures contract, with a 12-point stop.
One MES contract moves $5 per index point, so a 12-point stop risks $60 per contract. $500 divided by $60 is 8.33, so you trade 8 contracts, for $480 of risk.
Now the failure mode. Say the setup looked strong and you took 30 contracts instead. Each loss now costs $1,800, which is 3.6% of the account. Three ordinary losses in a row cost $5,400, a drawdown of nearly 11%, and recovering it needs a gain of 12.1% on the $44,600 left.
At the planned size, the same three losses cost $1,440, leave $48,560, and need a gain of about 3% to recover. The entries did not change. Only the size did.
Why trading losses get harder to recover
Losses and recoveries are not symmetrical. The deeper the drawdown, the larger the gain you need on what is left just to get back to even.
| Drawdown | Gain needed to recover |
|---|---|
| 10% | 11.1% |
| 20% | 25% |
| 30% | 42.9% |
| 50% | 100% |
This table is why small, fixed risk per trade matters. It keeps an ordinary losing streak in the top rows, where recovery is realistic.
Leverage and margin multiply both outcomes
Leverage lets you control more value than your account holds, and margin is the deposit that makes it possible. Both are often sold as ways to make more money, which skips the part that matters. Leverage multiplies gains and losses with equal efficiency and makes both arrive faster.
In futures the contract is already leveraged, as the MES and ES notional values show. Margin requirements are set by exchanges and brokers and change with volatility, so treat any margin figure as a moving number and size from your stop and risk budget instead.
Three trading position sizing approaches compared
- Fixed size. The same number of shares or contracts every time. Easy to execute, and it quietly makes your risk larger when stops are wide and smaller when they are tight.
- Risk-based size. The same dollar risk every time, with quantity adjusting to the stop distance. More arithmetic up front, and it keeps a normal losing streak survivable.
- Size by conviction. Bigger on the trades you like most. It feels smart and turns emotion into position size, which is where emotion does the most damage. A setup you like is not evidence unless your journal says so.
Related lesson: Position sizing
What Trading Really Costs
Trading costs go well beyond losing trades, and new traders often budget for losses while forgetting everything else. These are the costs that quietly shrink an account:
- Commissions and exchange fees. A fixed charge every time you trade. They bite hardest when your average win is small, which is why faster styles need a larger edge.
- The bid-ask spread. You buy at the offer and sell at the bid, so you start every trade behind. On MES a one-tick spread is $1.25 per contract, and on ES it is $12.50.
- Slippage. The gap between the price you expected and the price you got. It widens in fast markets and when your order is large compared with available liquidity.
- Data, platform and subscription fees. A recurring cost you pay whether or not the month went well.
- Behavioural cost. The extra loss from moving a stop, adding to a loser, revenge trading or letting a winner turn into a loser. It is often the largest item and the only one that never sends an invoice.
You cannot remove the first four, but you can measure them. Compare your intended entries and exits against your actual fills for 20 trades and look at the gap. The fifth shrinks only when a written rule exists before the moment of pressure.
Related lesson: Slippage explained
How Much Money You Need to Start Trading
How much money you need to start trading depends far more on risk arithmetic than on the smallest deposit a broker accepts. The useful question is whether your account can take a sensible stop at a sensible size.
Run the numbers on a very small account. At a 1% risk rule, $100 gives you $1 of risk per trade, which is less than one $1.25 tick on the smallest S&P 500 futures contract. No sensible risk model works at that size, even though some platforms will accept the deposit.
At $1,000, the same 1% rule gives $10 of risk. On one MES contract that is 8 ticks, or a 2-point stop. That is workable for some intraday setups and far too tight for many others, so the account size quietly decides which trades you are allowed to take.
The pattern day trader rule is changing for stock accounts
US stock day traders have long faced the pattern day trader rule, with a $25,000 minimum equity requirement for frequent day trading in a margin account. FINRA Regulatory Notice 26-10 replaces those day-trading margin requirements, including the $25,000 minimum, with new intraday margin standards effective June 4, 2026, and a phase-in period that ends October 20, 2027.
Because brokers can phase the change in, some firms may still apply the old rule as of November 2026, so check your broker's current terms. The PDT rule never applied to futures accounts.
Whatever the market, size the account from what your rules require, and treat the first months as tuition you have already decided you can afford to spend.
Related lesson: How much money do you need to start trading
Choosing a Broker and Opening a Trading Account
Choosing a broker for trading comes down to whether it gives you the markets, tools and protections your plan needs at a cost you can sustain. Check these before you fund anything:
- Markets offered. Make sure the broker offers the instruments you plan to trade, not just the popular ones.
- Regulation. Confirm the firm is registered with the right regulator for your country and for the products you trade.
- Costs. Compare commissions, exchange fees, data fees and platform fees as a total per round trip.
- Platform and order types. Check that the platform supports the orders you rely on, such as brackets and stop-limits, and that it is stable when markets move fast.
- Account types and margin terms. Read how margin is calculated and what happens when an account falls below requirements.
Opening an account usually involves identity verification, questions about your experience and finances, and agreeing to the broker's risk disclosures. Read those disclosures. They describe what happens to your positions when things go wrong, which is exactly when you will not have time to look it up.
Most brokers also offer a demo or paper account. Use it to practise placing, modifying and cancelling orders until the mechanics are boring, so live decisions are about the market rather than the buttons.
Trading Psychology and Discipline
Trading psychology matters because your rules are tested at the exact moment they feel least important. Most damaging trades are not analysis failures. They are behaviour failures that happen after a loss, a missed move or a big win.
The common patterns are easy to recognise once you name them:
- Fear of missing out. Price moves without you and the urge to chase builds. Missing the entry does not make the next price a good entry. It makes it a different trade, with a worse stop.
- Revenge trading. A loss stings and the next trade is about getting the money back. The rule that helps is a daily loss limit and a set number of losses after which you stop for the day.
- Hesitation after losses. A few stops in a row and you freeze on the next valid setup. Smaller size for the next few trades often helps more than willpower.
- Overconfidence after wins. A strong week tempts you to size up. Change size only on a schedule you set in advance, based on a journal sample.
None of this means something is wrong with you. Every trader feels these pulls. The fix in every case is the same idea: decide the rule before the pressure arrives. A written trade plan, a journal and platform-level loss limits do the job that good intentions cannot do in the moment.
Related lesson: Trading psychology
Is Trading Gambling?
Trading can look like gambling because any single trade has an uncertain outcome. The difference is whether you have a repeatable edge and whether you control the size of every attempt.
A casino does not care about one spin of the wheel. It cares that its edge repeats over thousands of spins and that the bets stay within limits. Trading offers the same posture: a setup with positive expectancy, a fixed risk per trade and enough trades for the edge to show. Clicking buttons with no edge and no size rule is gambling with more steps, whatever the instrument is called.
An edge does not have to be large. An illustrative setup that wins 55% of the time with equal-sized wins and losses earns 0.10 R per trade, where R is the amount risked, before costs. Small edges only work when size stays consistent and costs stay below the edge.
What the data says about retail trading losses
You will often see the claim that 90% of traders lose money. Treat that specific number with suspicion. Figures like it vary by market, sample, period and definition of a trader, and they get repeated far more often than they get sourced.
Some regulators have published real data for particular products. In 2018 ESMA, the EU securities regulator, reported national regulators' analyses showing that 74-89% of retail CFD accounts typically lose money, with average losses per client from €1,600 to €29,000. That is a statement about CFD clients in those samples, not a law of nature, but it is a sober reminder that losing is the default outcome without an edge and risk control.
The more useful question is what the surviving group does differently. The answers tend to converge: small defined risk per trade, a setup that repeats, a written record, and the discipline to stop when the plan says stop.
Related lesson: Trading expectancy
A Short History of Trading
Trading is older than money. Early communities bartered goods directly, then used commodities and coins as a common measure, and merchants built trade routes and markets around them. Financial trading grew out of the same need: a place where buyers and sellers could meet and trust the terms.
In the United States, the NYSE traces its origins to the Buttonwood Agreement, signed by 24 stockbrokers on May 17, 1792, which set rules and commissions for trading securities. Brokers traded informally in coffeehouses until a formal constitution was adopted on March 8, 1817.
Futures trading took shape in Chicago. CME Group dates the world's first futures exchange to 1848, when the Chicago Board of Trade formed as a central grain market, and the CBOT introduced standardized futures contracts in 1865. The CBOT and the Chicago Mercantile Exchange merged in 2007 to form CME Group.
The biggest modern change is electronic trading. Orders that once passed through trading pits and phone calls are now matched by computers, which is why a retail trader can reach the same order book as an institution from a laptop.
How to Start Trading as a Beginner
Starting to trade as a beginner works best as a sequence, where each step earns the next one. Skipping ahead feels efficient, and it is the most common way early accounts end.
- Learn the vocabulary and mechanics. Know what a bid, ask, spread, tick and order type are before you risk money on them.
- Pick one market and one style. Choose an instrument and a holding period that match your schedule and your account size.
- Write a simple trade plan. Define your setup, your risk per trade, your daily loss limit and the conditions that keep you out.
- Practise in a simulator. Place, modify and cancel orders until the mechanics are automatic, and log every trade.
- Review a meaningful sample. After at least 50 trades, check your win rate, average win, average loss and how often you broke your own rules.
- Go live small. Start with the smallest size your plan allows and raise it only when the journal supports it.
A readiness checklist before your first trade
Answer honestly. A no is information, not a verdict.
- I can name the exact price where I am wrong, and I set it before I entered.
- I know my size and why that number is correct in dollars of risk.
- I know how many losses my rules allow before I stop for the day.
- I have written down what would change my mind about the trade.
- I know my average win, average loss and win rate over at least 50 trades from a journal, backtest or simulator.
- I know this setup's ordinary losing streak, and my account can survive it.
- I am not trading to win back a specific amount I lost this week.
Five or more honest yeses and the trade has a process behind it. Fewer than five, and the missing item is your next task rather than your next trade.
On our accounts, you trade futures only (CME, CBOT, NYMEX and COMEX contracts, plus EUREX on Tradovate), and funded accounts are simulated. Positions are closed by 4:45 PM ET each regular trading day, and size is capped by contract limits, such as 1 mini or 10 micros on a 25K account. We do not offer stocks, options, spot forex or crypto derivatives, so the same decision stack applies, just to futures contracts.
Related lesson: New to futures learning path
Common Questions About Trading
How much can you make day trading with $1000?
No honest fixed figure exists for what $1,000 can make day trading, because results depend on your edge, costs and risk control, and many beginners lose money. At a 1% risk rule, $1,000 allows about $10 of risk per trade. Focus first on whether your setup has a positive expectancy over a large sample at that size.
Is trading haram in Islam?
Trading is not automatically haram or halal; scholars differ, and the answer depends on how the trading is done. Common concerns include interest (riba), excessive uncertainty (gharar) and gambling (maysir), which affect views on margin, short selling and derivatives. If this matters to you, ask a qualified scholar of Islamic finance about the specific products you plan to trade.
What is a stock?
A stock is a security that gives its holder a share of ownership in a company, which is why stocks are also called equities. Stockholders can benefit from price appreciation and dividends, and common stock usually carries voting rights. Traders buy and sell stocks for shorter-term price moves rather than long-term ownership.
How do traders actually make money?
Traders make money by taking price risk that others want to transfer, through a setup that has a positive expectancy over many trades. They keep each loss small enough to survive a normal losing streak and keep a record that proves the edge exists. Remove any of those three parts and the other two stop holding up.
Can you trade with no money?
You can practise with no money in a demo or paper-trading account, which is the right place to learn order mechanics. Real trading needs capital at risk, and the amount should come from your risk rules rather than from a platform's minimum deposit.
This guide is educational content, not financial advice or a recommendation to buy or sell any instrument. Trading futures, stocks, options, forex, crypto and other leveraged products involves substantial risk of loss, leverage can make you lose more than you expect, and funded and evaluation accounts are simulated, so their results do not predict live results.


