




TL;DR: A trading plan for beginners answers nine decisions before the first trade, and the risk decisions must work on your real account. Size every trade from the stop, not from how confident you feel. On a $25,000 account risking 1%, a 10-point MES stop allows 5 contracts and an 80-point stop allows none. Convert every limit into dollars, journal every trade, and judge the plan after 100 trades, not after one bad week.
Most first trading plans fail before the first trade, and discipline is rarely the reason. They fail because the plan asks for something the account cannot do. "Risk 1% per trade with an 80-point stop" reads like a rule, but on a $25,000 account trading Micro E-mini S&P 500 futures it cannot be executed at all.
A beginner's trading plan has a narrower job than most guides suggest. It has to decide your trades before pressure shows up, and every line has to be something you can check afterwards. This guide builds one in nine steps, with the arithmetic shown, then gives you a sample plan and a blank one-page sheet to copy.
The Trading Plan for Beginners in Nine Steps
A first trading plan is nine decisions written in build order. Each one depends on the decisions before it, so writing them out of order is how plans end up with stops chosen to fit a contract count.
- Know your starting point. Hours you can actually trade, money you can afford to lose, and how you react to losing.
- Set process goals. What you will measure in the first 100 trades, written as behaviour rather than dollars.
- Choose one market and one instrument. Write down what one tick and one point are worth in dollars.
- Choose a trading style. The holding period that fits your schedule and your account.
- Pick one setup. One repeatable pattern, described in prices or chart facts.
- Write entry and exit rules. The trigger, the stop where the idea is wrong, the target, and the conditions under which you do not trade.
- Set risk per trade and size from the stop. One percentage, converted into dollars, divided by the dollar risk per contract and rounded down.
- Set daily and weekly loss limits. Dollar amounts at which you stop, written as multiples of your per-trade risk.
- Journal every trade and review on a fixed date. What you record, and when the plan is allowed to change.
Each step has a test. If you cannot say what one point of your instrument is worth, step three is not finished. If your plan has no dollar figure for a daily stop, step eight is not finished. A missing answer is the next task, not something to fix after the first loss.
The first two steps are about you, steps three to six describe the trade, and steps seven to nine decide whether the plan survives contact with your account. That last group is where beginner plans most often break, so it gets the most arithmetic in this guide.
Related lesson: How to start trading
What a Trading Plan Is and How It Differs From a Strategy
A trading plan is a written set of rules covering what you trade, when, how you enter and exit, how much you risk, when you stop for the day, and how you review your results. It is a decision document. It does not predict where the market goes. It decides what you do when the market goes there.
A trading strategy is narrower. It is the method that finds and triggers trades: the setup, the entry signal, the stop logic and the target. The plan is the container the strategy runs inside.
| Question | Trading strategy | Trading plan |
|---|---|---|
| What does it answer? | When does a trade exist? | Which trades, at what size, and when do I stop? |
| Example line | Enter long when price closes back above the prior session high after a retest | Trade only MES, 9:45 AM to 11:30 AM ET, risk 1% per trade, stop for the day at 3R |
| Can it work alone? | No, a good setup at the wrong size can still end the account | No, a plan with no tested setup has nothing to execute |
| How often it changes | Rarely, and only after a full sample | Limits can change with account size, but only on review day |
The difference matters because beginners often swap strategies when the real problem is the plan. A setup that loses because it was traded at three times the intended size is not a broken setup. It is a plan that was not followed.
Two things a trading plan is not. It is not a motivational document: "be patient" and "follow the trend" are not decisions, and if a line cannot be checked afterwards it does not belong in the plan yet. And it is not something to rewrite every week. A plan gets revised from evidence, but rebuilding it after every losing week destroys the one thing it is for, a stable baseline to measure yourself against.
Related lesson: How to create a trading plan
Why Beginners Need a Written Trading Plan
Beginners need a written trading plan because the decisions that hurt most are made under pressure, and a plan moves those decisions to a calm moment before the session starts. The size of your next trade, whether to take the setup you just missed, and whether to keep trading after three losses are all easier to answer at 8 AM than at 10:40 AM with a red day on the screen.
The stakes are real. Investor.gov states that day trading "is extremely risky and can result in substantial financial losses in a very short period of time." A study by Chague, De-Losso and Giovannetti of Brazilian equity index futures day traders found that of the 1,551 who persisted more than 300 days, 97% lost money net of fees. A plan does not change those odds by itself. What it does is make your losses the planned kind: sized, capped and recorded.
What a written plan does for a beginner
A written plan gives a beginner four practical things:
- Decisions made before emotion gets a vote. Size, stops and daily limits are set when nothing is at stake.
- A way to tell bad luck from bad execution. If you followed the plan and lost, that is data about the setup. If you broke the plan, that is data about you.
- A limit on how bad a bad day gets. A daily stop written in dollars turns a possible disaster into a known, survivable number.
- A baseline for improvement. You can only test a change if you know what you were doing before it.
Does every trader need a trading plan?
Some experienced discretionary traders work without a formal document, but they usually carry the rules in their head after years of repetition. A beginner does not have that yet. Writing the plan down is how the rules get into your head in the first place, and it is what makes your journal comparable from one week to the next.
A plan also has limits worth stating plainly. It cannot create an edge where the setup has none, it cannot stop slippage, and it does not make losses smaller than the market allows. It makes them consistent, which is the condition for learning anything from them.
Self-Assessment Before You Write a Trading Plan
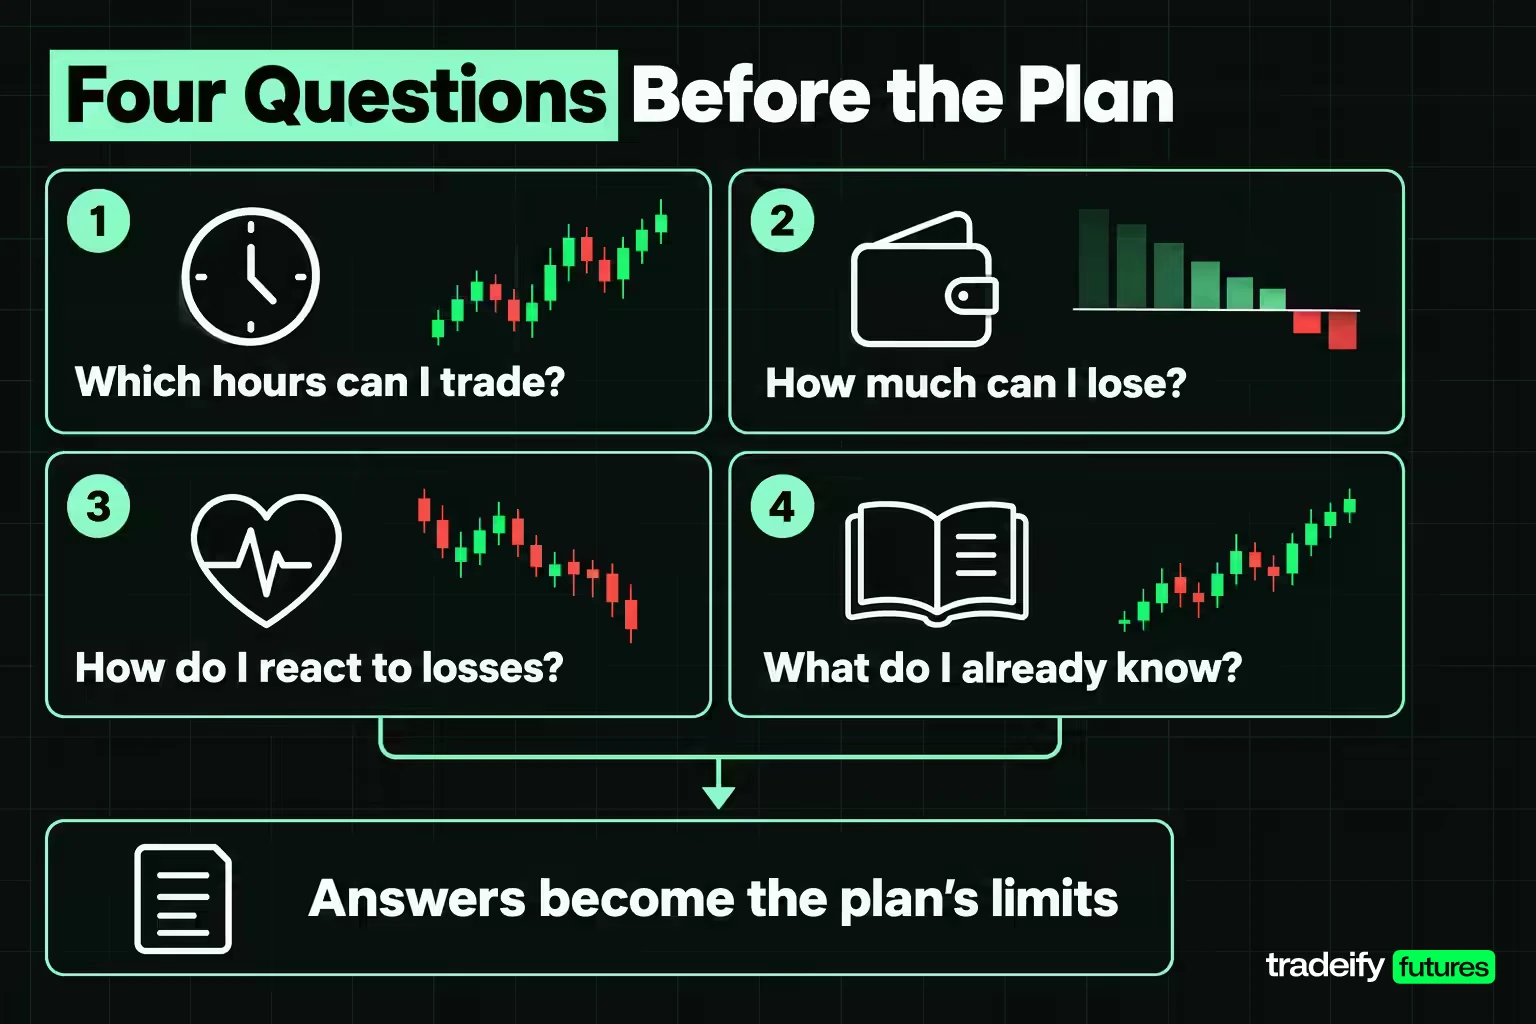
Self-assessment is the step most beginners skip, and it decides what the rest of the plan is allowed to contain. Before you choose a market or a setup, answer four questions honestly and write the answers at the top of the plan as constraints.
| Question | Why it matters | Example answer that becomes a rule |
|---|---|---|
| Which hours can I trade without distraction? | A setup that appears outside your free hours gets chased or missed | Weekdays 9:45 AM to 11:30 AM ET only |
| How much money can I lose without it changing my life? | This is your trading capital, and it sets every dollar limit | $10,000, separate from savings and bills |
| How do I react after two or three losses? | It tells you which impulse rules the plan needs most | I size up to win it back, so size is fixed for the whole session |
| What do I already know? | Skill gaps decide what you practice before risking money | I can read a chart but have never placed a bracket order |
Time is the constraint people overstate. If you have a day job, your real window may be ninety minutes before work or an evening session, and the plan should fit that window rather than the one you wish you had.
Capital is the constraint people misjudge. The question is not what a broker lets you deposit. It is whether your setup's normal stop fits inside your risk rule. If your setup needs an 80-point stop on MES, one contract risks $400, so at 1% per trade you need $40,000 before a single position is allowed. That is a sizing fact, not a judgement on you, and it is far better to find it on paper than in the middle of a session.
Temperament is the constraint people hide. Write down your worst habit honestly. If you know you chase moves, your plan needs a rule about missed entries. If you freeze after losses, it needs a rule about taking the next valid setup. Self-assessment turns a personal weakness into a specific line in the plan.
Setting Realistic Goals in a Trading Plan
Trading goals belong in the plan, but for a beginner they should be process goals, not dollar goals. A process goal is something fully under your control: taking only planned setups, honouring every stop, stopping at the daily limit, and logging every trade.
Dollar goals are where plans go wrong. A target of $1,000 a day on a $25,000 account is 4% of the account in one session, which is 4R if you risk 1% per trade, before costs and before any losing day. Writing that number down does not make it likely. What it tends to do is pressure you into raising size on the days you are behind, which is the exact behaviour the plan exists to prevent.
Good first-plan goals look like this:
- Follow the plan on every trade in a block of 20 trades.
- Log every trade the same day, including the ones you would rather forget.
- Never exceed the daily stop.
- Reach a sample of 100 trades before judging the setup.
Measure these as a percentage. If 18 of your last 20 trades followed the plan, that is 90% adherence, and it is a number you can improve directly. Profit follows from a working setup traded consistently. It is not something you can schedule.
Related lesson: Trading goals and process metrics
Choosing a Market and Instrument to Trade
Choosing a market is a sizing and schedule decision before it is a preference. The right first market is one where your normal stop fits inside your risk rule, during hours you are actually free, with costs that do not eat a small edge.
The main markets work differently:
| Market | What you trade | When it trades | First-plan consideration |
|---|---|---|---|
| Stocks | Shares of individual companies or ETFs | US cash session 9:30 AM to 4:00 PM ET | Simple to understand; share count can be sized finely |
| Futures | Standardized contracts on indexes, energy, metals, currencies and grains | Equity index futures trade Sunday 6:00 PM to Friday 5:00 PM ET with a daily 5:00 PM to 6:00 PM ET break | Micro contracts allow small dollar risk per point; leverage is built in |
| Forex | Currency pairs | Around the clock on weekdays | Leverage limits and dealer pricing differ by jurisdiction |
| Crypto | Digital assets and their derivatives | Every day | Investor.gov notes characteristics and risks vary significantly |
| Options | The right, not the obligation, to buy or sell | Tied to the underlying market's hours | One contract generally covers 100 shares; pricing has more moving parts |
Dollar risk per point by instrument
For a first plan, the useful number is how many dollars one unit of price movement costs per contract or share. Futures make this explicit. The four common micro contracts below all reach the same $50 of risk per contract, but with very different stop distances.
| Contract | Dollar value per move | Illustrative stop | Risk per contract |
|---|---|---|---|
| MES (Micro E-mini S&P 500) | $5 per index point; 0.25 tick = $1.25 | 10 points | $50 |
| MNQ (Micro E-mini Nasdaq-100) | $2 per index point; 0.25 tick = $0.50 | 25 points | $50 |
| MGC (Micro Gold) | $10 per $1 move; $0.10 tick = $1.00 | $5.00 | $50 |
| MCL (Micro WTI Crude Oil) | $100 per $1 move; $0.01 tick = $1.00 | $0.50 | $50 |
The stops are illustrative, not a statement of how far each market normally moves. The point is the method: write your instrument's dollar value per point at the top of the plan, because every sizing line depends on it.
Then stay in that one instrument. After a rough week, a different market that seems to be moving better is tempting. Switching resets your learning, because you never collect enough repetitions in one place to know what normal looks like.
Related lesson: How to choose a market to trade
Choosing a Trading Style That Fits Your Schedule
A trading style is mostly a holding period, and the holding period sets your stop width, the capital you need and how much screen time the plan demands. Pick the style your schedule and account can carry, not the one that looks most exciting.
| Style | Typical hold | Illustrative MES stop | Risk per MES contract | Screen time |
|---|---|---|---|---|
| Scalping | Seconds to minutes | 3 points | $15 | Constant attention during the window |
| Day trading | Minutes to hours, flat by the close | 10 points | $50 | A fixed block of the session |
| Swing trading | Days to weeks | 40 points | $200 | A short daily check |
| Position trading | Weeks to months | 150 points | $750 | Low |
Run the account test on each row. On a $25,000 account at 1% risk ($250), a day-trading stop allows 5 MES contracts and a swing stop allows 1. A 150-point position stop risks $750 on one contract, three times the budget, so that style is simply not available at that size under that rule.
Each style has its own trap. Scalping produces many trades, so costs and impulse decisions pile up fast. Day trading asks you to sit through quiet periods without inventing trades. Swing and position trading carry overnight and weekend gap risk: price can open well beyond your stop, and a stop order fills at the next available price. Holding longer means fewer decisions, but each one carries more dollars.
For a first plan, choose one style and write its holding rule as a line in the plan, for example "all positions closed before 11:30 AM ET" for a morning day-trading plan.
Related lesson: Trading styles explained
Beginner Trading Strategy Examples for Your Plan
A beginner strategy should be simple to describe, easy to check afterwards, and frequent enough to build a sample. Here are three common setup families written the way a plan needs them: as rules with an entry, an invalidation and a target. They are examples of how to write a setup, not recommendations or proven edges.
Trend pullback setup
- Context: on a 5-minute chart, price is above a rising 20-period moving average.
- Entry: after a pullback toward the average, go long when a candle closes back above the high of the prior candle.
- Stop: one tick below the pullback low.
- Target: 2x the stop distance.
- Invalidation: a 5-minute close below the moving average cancels the setup for that leg.
The appeal for a beginner is that the trend condition filters out many low-quality entries. The trap is entering every small dip and calling it a pullback.
Breakout and retest setup
- Context: price breaks above the prior session's high.
- Entry: wait for price to come back to that level, then go long when a candle closes back above it.
- Stop: below the low of the retest.
- Target: 2x the stop distance.
- Invalidation: a close back inside the prior range means the breakout failed.
This setup teaches patience, because the first push is not the entry. Missing the breakout does not make a later price a good entry. If the retest never comes, there is no trade.
Opening range breakout setup
- Context: mark the high and low of the first 30 minutes after the 9:30 AM ET US stock open.
- Entry: go long on a 5-minute close above the range high, or short on a close below the range low.
- Stop: the midpoint of the range.
- Target: 2x the stop distance, or exit by a fixed time.
- Invalidation: price closes back inside the range.
It suits traders with a morning window. Its weakness is wide stops on volatile days, which is why the stop distance has to be checked against your risk rule before each trade.
What makes a beginner strategy worth committing to
Pick one setup and commit to it for a full sample. A setup is a good first choice when:
- It appears often enough in your hours to reach 100 trades in a few months.
- Its normal stop fits your risk rule on your account.
- Its invalidation is a price, not a feeling.
- Someone else could read your rules and mark the same trades on a chart.
Committing matters because a setup cannot be judged on a handful of trades. If you switch after four losses, you never learn whether the setup worked or whether you hit a normal losing run. Variety is something you earn after the journal shows what works for you.
Related lesson: Backtesting a trading strategy
Entry and Exit Rules in a Trading Plan
Entry and exit rules are the lines in a trading plan that a camera could check. If someone watching your screen could not tell whether a rule was met, it is not a rule yet. The table shows common vague rules and checkable versions.
| Rule type | Vague version | Checkable version |
|---|---|---|
| Entry trigger | Buy when it looks strong | Buy when a 5-minute candle closes above the prior session high after a retest |
| Stop | Get out if it turns | Stop one tick below the retest low, placed with the entry |
| Target | Take profit when it feels right | Exit at 2x the stop distance |
| Time exit | Don't hold too long | If the trade has not reached 1x the stop distance within 30 minutes, exit at market |
| No-trade rule | Be careful around news | No new trades from 5 minutes before a scheduled release in my window until 5 minutes after |
| Session end | Stop when tired | Last entry 11:15 AM ET, all positions closed by 11:30 AM ET |
The stop comes first. Find the price at which your idea is wrong, and place the stop there. Do not choose the stop to fit a contract count. Position size is calculated from the stop, never the other way round.
Entry rules also need to say what happens when you miss the entry. Price running away from your level does not make the next price a good entry. It makes it a different trade, one your plan never tested, and the honest rule is usually to let it go.
How stop orders and exits behave
Know what a stop order does. Investor.gov explains that a stop order becomes a market order when the stop price is reached, and the price you get may differ from the stop price, especially in a fast-moving market. Your plan should assume some slippage on stops rather than treating the stop price as a guaranteed exit.
Write one more exit rule that beginners forget: what you do if the platform disconnects or an order is rejected. A simple line such as "if I cannot see my position, I call or flatten through the broker's backup route" saves real money on the day it is needed.
Related lesson: Stop-loss orders and placement
Risk Management and Position Sizing in a Trading Plan
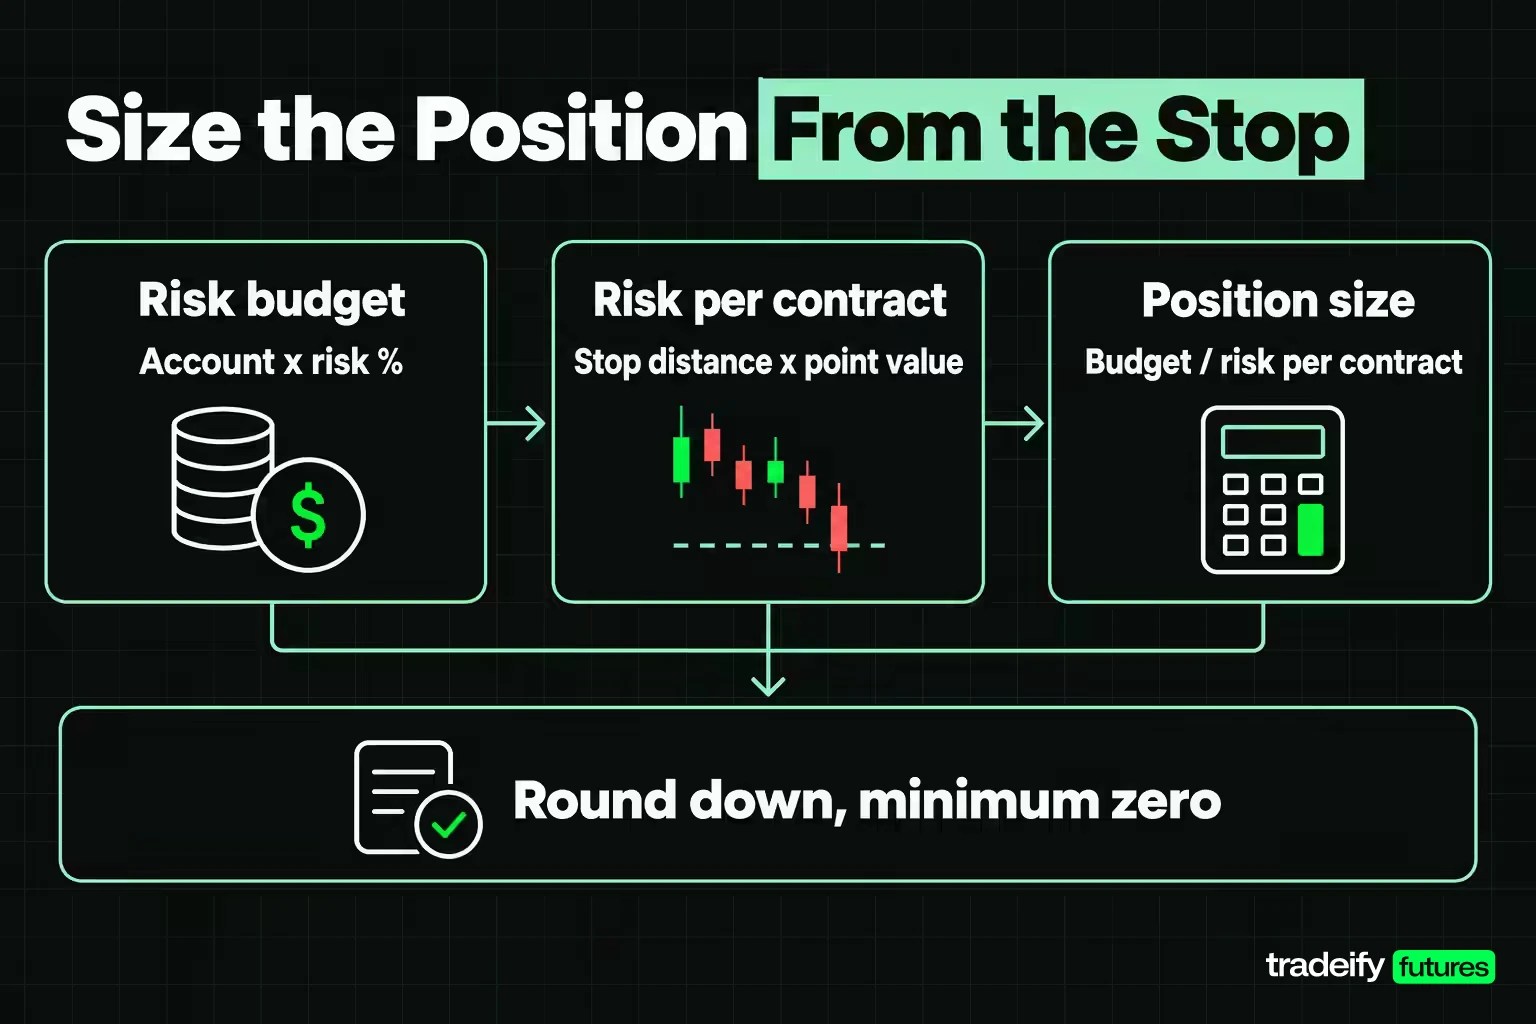
Risk management in a trading plan starts with one number: the maximum you will lose on a single trade, as a percentage of the account. Many beginner guides use 1% to 2%. Whatever you pick, it is a cap, not a target, and it sets your position size, not your conviction.
Position sizing from the stop
The sizing rule takes three lines:
- Risk budget = account equity x risk percentage.
- Dollar risk per contract = stop distance x dollar value per point.
- Position size = risk budget divided by dollar risk per contract, rounded down, with a minimum of zero.
Hold everything constant and change only the stop width. The assumptions: a $25,000 account, 1% risk ($250), MES at an illustrative S&P 500 level of 7,000, $5 per point, and an illustrative $2.00 round-turn cost per contract. These are rounded working numbers, not quotes or a fee schedule, so you can check every figure.
| Stop width | Risk per contract | Contracts for $250 | Actual risk | Notional exposure | Round-turn cost | Cost as share of $250 |
|---|---|---|---|---|---|---|
| 10 points | $50 | 5 | $250 | $175,000 (7.0x the account) | $10.00 | 4.0% |
| 25 points | $125 | 2 | $250 | $70,000 (2.8x) | $4.00 | 1.6% |
| 50 points | $250 | 1 | $250 | $35,000 (1.4x) | $2.00 | 0.8% |
| 80 points | $400 | 0 | $0 | None | None | None |
What the sizing table shows
Same account, same instrument, same $250 of risk, and four rows that share almost nothing else. Three lessons come out of it.
The stop decides the size. The 80-point row works out to 0.625 contracts, and there is no such thing as part of a contract, so the plan takes none. That trade is not aggressive. It is unavailable at this account size. The honest fixes are a smaller instrument, a larger account, or accepting that this setup does not fit yet. Tightening a valid stop to make the size work is how a risk plan quietly stops being one.
Tight stops mean more notional exposure. The 10-point row controls $175,000 of index exposure with a $25,000 account. The dollar risk is the same $250 only if the stop fills where you placed it. A gap or a fast market hits five contracts, not one.
Costs scale with contracts. The 10-point row pays $10.00 to carry the same $250 of risk the 50-point row carries for $2.00. That is 4.0% of every trade's risk spent before the market moves. Swap in your broker's actual all-in rate before relying on these numbers.
Risk per trade for a first plan
The percentage itself is your choice, and smaller is more forgiving while you are learning. Ten straight losses at 1% risk cost 9.56% of the account. The same ten losses at 3% cost 26.26%, and that is a hole most beginners do not climb out of with the same calm they started with.
For a first plan, pick a percentage you could keep through ten straight losses without changing anything else. If the honest answer is "I would start sizing up to win it back," the percentage is too high.
Related lesson: Position sizing
Loss Limits and Losing Streak Math
Loss limits are the circuit breakers in a trading plan: a daily stop that ends the session and a weekly stop that ends the week. A percentage is hard to enforce mid-session. A dollar figure is easy. Convert every limit once, write both numbers in the plan, and keep the dollar figure visible while you trade.
Converting loss limits into dollars and R
R is your planned risk on one trade. On a $25,000 account at 1%, 1R is $250. These are illustrative plan choices, not industry standards:
| Plan limit | Percent | Dollars on $25,000 | In units of trade risk |
|---|---|---|---|
| Risk per trade | 1% | $250 | 1R |
| Daily stop | 3% | $750 | 3R |
| Weekly stop | 6% | $1,500 | 6R |
| Monthly review trigger | 10% | $2,500 | 10R |
"3R" is easy to track in the moment: three full losses and you are done for the day. It also tells you whether the limits make sense together. If your risk per trade were 3%, a 3% daily stop would end the session after one loss, which leaves no room for a normal sequence.
Losing streaks are normal
Losing streaks are a normal part of any setup with a win rate under 100%, and they are longer than most beginners expect. If a setup wins 35% of the time, the chance that any given run of 10 trades is all losses is 0.65^10, about 1.35%. That sounds rare until you trade a few hundred times. In a simple simulation run for this guide (20,000 runs of 200 independent trades at a 35% win rate), about 91% of runs contained a streak of 8 or more straight losses.
What matters is what your risk per trade does to that streak:
| Risk per trade | Drawdown after 10 straight losses | Gain needed to get back to even |
|---|---|---|
| 1% | -9.56% | +10.57% |
| 2% | -18.29% | +22.39% |
| 3% | -26.26% | +35.61% |
At 1%, a bad run costs about a tenth of the account. At 3%, the same run costs more than a quarter, and you need a 35.61% gain just to get back to even. Recovery is not linear, and that asymmetry is the strongest argument for the smaller number. Write it next to your risk line so you read it on the day it matters.
Break-even win rate and the target
Your target and stop together set the win rate you need just to break even:
| Reward-to-risk | Break-even win rate, no costs | Break-even with $2.00 cost on a $250 risk trade |
|---|---|---|
| 1 to 1 | 50% | 50.4% |
| 1 to 1.5 | 40% | 40.32% |
| 1 to 2 | 33.33% | 33.6% |
This is why the target belongs in the plan next to the stop. A setup with a 1-to-2 target can lose most of its trades and still break even, while a 1-to-1 setup needs to win more than half. Costs push every break-even rate up, and the push grows when tight stops mean more contracts.
Related lesson: Daily and weekly loss limits
How a Trading Plan Controls Emotions and Impulses
A trading plan controls emotions by deciding, in advance, what you do at the exact moments emotion takes over. Telling yourself to stay calm does not work mid-session. A precommitted if-then rule usually does, because it replaces a judgement call with a check.
Most beginners meet the same handful of impulses. None of them mean you are bad at this. They are what happens to almost anyone when money moves on a screen.
| Impulse | What it looks like | Plan rule that answers it |
|---|---|---|
| Fear of missing out | Chasing a move after the planned entry has passed | If price is more than 1x my stop distance past my entry level, the trade is gone |
| Revenge trading | Re-entering immediately after a loss, often bigger | After two straight losses, a 15-minute break; size never increases during a session |
| Hesitation | Skipping a valid setup after a few losses | If the setup is valid and I am inside my daily stop, I take it at normal size; skipped setups get logged |
| Moving the stop | Widening the stop as price approaches it | Stops move toward profit or stay put, never further away |
| Overtrading | Inventing trades in a slow market | Maximum four trades per session |
| Protecting a green day | Cutting winners early to keep the day positive | Targets stay where the plan put them; early exits get logged with a reason |
The rules work best when they are physical, not just written. Put the daily stop in dollars on a sticky note by the screen. Use your platform's own daily loss lockout if it has one. Close the platform when the daily limit is hit, rather than "just watching", which is how many sessions turn into a second, unplanned one.
Expect discomfort anyway. A plan does not remove fear or frustration. It gives them nowhere to act. The clean loss still stings, but the next trade is the same size as the last one, and that is what keeps one bad decision from turning into five.
Related lesson: Trading psychology
Tracking Every Trade in a Journal
A trading journal is the record that turns a sequence of trades into evidence. Without it, review is just memory, and memory flatters. The journal is also the only way to tell whether a problem comes from the setup or from how you traded it.
Record these fields after every trade, the same day:
| Field | Why it matters |
|---|---|
| Date, time and instrument | Shows whether losses cluster in one part of the session |
| Setup name | Lets you judge each setup on its own results |
| Planned entry, stop and target | Shows whether execution matched the plan |
| Size and planned dollar risk | Catches size drift before it becomes a habit |
| Result in dollars and in R | Makes trades of different sizes comparable |
| Followed the plan: yes or no | Separates execution problems from strategy problems |
| One sentence on what you saw and felt | Gives the review something to work with |
Results in R are the most useful column. A trade that risked $250 and made $500 is +2R. A trade that risked $100 and made $200 is also +2R. Recording both as +2R lets you compare trades across account sizes and contract counts, and it keeps you focused on the quality of the decision rather than the dollar amount.
Design the journal for the tired version of yourself. If logging takes ten minutes, it will stop happening by week three. A spreadsheet row with these seven fields, filled in right after the trade, is enough. Many platforms also produce a performance report with win rate and P&L, which is useful as a cross-check but cannot tell you whether you followed your plan.
Related lesson: How to keep a trading journal
Reviewing and Updating Your Trading Plan
Reviewing a trading plan happens on two clocks: a short weekly review of execution and a longer review of the plan itself at a fixed trade count. Mixing the two is how beginners end up rebuilding their plan after every losing week.
Weekly execution review
Once a week, on a fixed day, check how well you followed the plan. Count the trades that followed every rule, count the breaks and group them by type: oversized, outside hours, no stop, traded past the daily limit. Do not change the setup or the targets in a weekly review. The only question is whether you traded the plan you wrote.
Sample review at 100 trades
The plan itself gets judged at a sample size you commit to in advance, such as 100 trades. Fewer trades cannot tell a working setup from a broken one. Suppose a setup's true win rate is 35%. Over 100 trades, normal noise has a standard error of about 4.77 percentage points, so the result could land anywhere from roughly 25.65% to 44.35% by chance alone. Over 30 trades, the standard error is about 8.71 points and the range runs from about 17.93% to 52.07%. Thirty trades can make a working setup look broken or a broken one look great.
At two trades a session, 100 trades takes about 50 sessions, roughly ten weeks. Write that date in the plan so a four-loss week cannot become a verdict.
The arithmetic of what a modest edge looks like helps too. At a 35% win rate with a 1-to-2 target, $250 risk per trade and $2.00 cost, 100 trades gross $1,250, pay $200 in costs and net $1,050. That is $10.50 per trade, or 4.2% of a $25,000 account. A plan that works can still look boring, and that is fine.
Telling a broken trading plan from a bad week
Work down this table before changing anything:
| What you see | What it usually is | The correction |
|---|---|---|
| Losses cluster in one part of the session | A time-of-day problem, not a strategy problem | Narrow the trading window before abandoning the setup |
| Results are fine on paper but the account is not | Cost or size drift | Recompute cost per trade as a share of dollars risked |
| You keep skipping valid setups | The plan's hours do not match your real week | Change the hours, not the setup |
| The plan calls for a size the account cannot take | The plan is impossible as written | Fix it on paper before the next session |
| One big loss wipes out several wins | Stop placement or a moved stop | Put the stop where the idea fails, then re-size |
| You cannot state your limits without looking | The limits were never converted into dollars | Do the conversion and post it by the screen |
Changing one variable at a time
When a change is justified, change one variable at a time and note the date and reason in the plan. Unrecorded changes make the journal unusable, because you can no longer tell which version of the plan produced which results.
A Beginner Learning Path From Paper Trading to Live Trading

A learning path turns a first trading plan into a sequence of stages, each with a gate you pass before moving on. The gates are about behaviour, not profit, because early profit and loss numbers say very little about skill.
| Stage | What you do | Gate to move on |
|---|---|---|
| Learn the instrument and platform | Learn tick value, contract months, and how to place a bracket, move a stop and flatten | You can do all of it without looking anything up |
| Study the setup on past charts | Mark examples of your setup on historical charts or a replay tool, with entry, stop and result in R | 50 marked examples with no rule changes along the way |
| Paper trade the full plan | Trade the whole plan on a demo, including daily stops and journaling | 20 trades in a row that follow every rule |
| Trade live at the smallest size | One micro contract or the smallest share size your risk rule allows | 100 trades logged, then a full sample review |
| Increase size slowly | Raise size one step only after the sample review supports it | Another full sample at the new size |
Paper trading limits and stepping back a stage
Paper trading has a known blind spot. Simulated fills can be kinder than live ones, and it is easier to follow rules when no real money is at stake. So a demo proves whether you can follow the plan, not whether the setup makes money. Treat the first live stage as a new test of the same plan, not as a reward for passing the demo.
If a stage goes badly, step back one stage rather than pushing forward. Breaking rules at small live size is a signal to return to paper trading for another 20-trade block, not to increase size and hope it feels different.
On our accounts, the plan's edges are partly written for you. Evaluations and funded accounts are simulated. On a 50K Growth evaluation, the daily loss limit is $1,250 and hitting it pauses trading until the next trading day, the contract limit is 4 minis or 40 micros, and every position must be closed by 4:45 PM ET with no overnight or swing holds. A first plan for our accounts should set its own daily stop below that limit and use an intraday style. Platform risk settings, such as Tradovate's personal daily loss limits, can enforce your own numbers, but they do not replace our rules.
Related lesson: Practice with paper trading
Sample Trading Plan and One-Page Rule Sheet
A sample trading plan shows what the nine decisions look like once they are filled in. This one is built for a hypothetical beginner with a $10,000 account and a morning window. Every number is illustrative and should be replaced with your own.
- Starting point: Weekdays 9:45 AM to 11:30 AM ET. Trading capital $10,000, separate from savings. Known habit: sizing up after losses.
- Goals: Follow the plan on 20 of 20 trades per block. Log every trade the same day. Full review at 100 trades.
- Market and instrument: MES only. $5 per point, 0.25 tick = $1.25.
- Style: Day trading. Last entry 11:15 AM ET, flat by 11:30 AM ET.
- Setup: Breakout and retest of the prior session high or low, entered on a 5-minute close back beyond the level.
- Entry and exit: Stop below the retest low (above the retest high for shorts). Target 2x the stop distance. Exit at market if 1x the stop distance is not reached within 30 minutes.
- Risk per trade: 1% = $100. With a 12-point stop, risk per contract is $60, so size is 1 contract ($60 actual risk). Target 24 points = $120.
- Daily stop: $300 (3R). When it is hit, the platform closes for the day.
- Weekly stop: $600 (6R). When it is hit, no trading until Monday.
- Impulse rules: Size never increases during a session. After two straight losses, a 15-minute break. Maximum four trades per session.
- Journal: Every trade, same day, with planned risk, result in R and whether the plan was followed.
- Review: Fridays after the session for execution. Full plan review at 100 trades.
Notice the sizing line. A 12-point stop on a $100 budget allows 1 contract, not 1.67. Rounding down means the actual risk is $60, below the cap, which is the rule working as intended. If the stop needed 21 points ($105 per contract), the plan would take no trade.
Blank one-page trading plan template
Copy this and replace every bracket:
- Starting point: [hours I can trade], [trading capital], [my worst habit]
- Goals: [process goal 1], [process goal 2], full review at [trade count] trades
- Market and instrument: [one instrument], [dollar value per point or per tick]
- Style: [holding period], [last entry time], [flat by time]
- Setup: I enter when [one checkable condition]
- Entry and exit: Stop at [price where the idea is wrong]. Target [multiple of stop]. Time exit after [minutes]
- Risk per trade: [percent] = $[amount]. Size = $[amount] divided by [dollar risk per contract], rounded down, minimum zero
- Daily stop: $[amount] ([number]R). When hit, I [action]
- Weekly stop: $[amount] ([number]R). When hit, I stop until [day]
- Impulse rules: [rule for my worst habit], [maximum trades per session]
- Journal: [fields], logged [when]
- Review: [weekly day] for execution, [trade count] trades for the plan
The two template lines that do the most work
Two phrases in the one-page template do the most work. "Rounded down, minimum zero" keeps the risk rule honest when a stop is wide. "Result in R" makes trades comparable, so the review measures decisions rather than dollar amounts.
Common Mistakes When Writing a First Trading Plan
Most first-plan mistakes come from writing the plan in the wrong order or leaving limits as intentions. These are the ones that show up most often.
Writing the risk rule before the stop rule. The stop comes from the setup, and sizing is downstream of it. Plans built the other way end up with stops chosen to fit a contract count.
Using percentages as the only limit. "3% daily" is hard to track mid-session. "$750, or three full losses" is not. Convert every limit before the first session.
Planning on an account you do not have. If your setup needs $40,000 to take one contract at its normal stop, that is a two-part project: practice the setup now, trade it at size later.
Too many markets and setups. A watchlist of twenty instruments and five setups produces too few repetitions of anything to learn from.
Treating the journal as optional. A plan without a record cannot be reviewed, only remembered.
Judging on too few trades. Fix the sample size in advance and change one variable at a time, only after that sample has closed.
Leaving out the no-trade rules. Knowing when not to trade, such as outside your hours, after the daily stop, or around releases you have chosen to avoid, is half the plan.
Related lesson: Maximum risk per trade
Trading Plan FAQs
How long should a trading plan be?
One page for the rules is enough for a first plan, plus a journal for the record. A long plan is usually a sign of unfinished decisions. If a line cannot be checked afterwards, cut it or turn it into a number.
Is $100 enough to start trading?
At a 1% risk rule, $100 gives a $1.00 risk budget, and one tick of MES is $1.25, so no futures position fits. Even at 5%, the $5.00 budget is far below the $50 risk on a 10-point MES stop. That does not make $100 useless, but it means the plan should be built around paper trading, a market with smaller units, or saving first, not around raising the risk percentage until a position fits.
What is the 3-5-7 rule in trading?
The 3-5-7 rule is an informal risk guideline: risk no more than 3% on one trade, keep total open risk under 5%, and aim for winners at least 7% larger than losers. It is not a regulation, and versions differ on what the 7 means. For a beginner, 3% per trade is on the high side, so convert the numbers into dollars on your own account and check that your daily stop still allows a normal losing run.
Can I make $1,000 a day trading?
Not reliably, and not as a beginner's goal: on a $25,000 account, $1,000 a day means making 4% of the account in one session, or 4R at 1% risk, before costs and losing days. That arithmetic shows what the number requires, not how likely it is. Plans built around a daily dollar target tend to raise risk to hit it, so set process goals instead and let a full sample show what the setup can do.
How many trades should a beginner take?
Take only the trades your plan allows, and set a session maximum such as four trades. Trade count is a measurement tool, not a goal, and past a point it mostly adds costs and impulse decisions. A plan that produces two qualified setups a week is still a working plan.
Do I need a trading plan for paper trading?
Yes, and paper trading is the cheapest place to test one. The sizing arithmetic is the same on a demo account, so a stop that cannot be sized cannot be sized either way. What a demo will not reproduce is live fills, live slippage and how you behave when the money is real, so the plan still needs a test at small live size.
What market should a beginner trade first?
A beginner should trade one liquid market whose normal stop fits a 1% risk rule during the hours the beginner can actually trade. For small futures accounts that often means a micro contract such as the Micro E-mini S&P 500 (MES), where one index point is worth $5. For others it means liquid stocks in a cash account, where share count can be sized finely.
Your First Week With a New Trading Plan
The first week with a new trading plan is about building the routine, not about results. Give it a simple schedule:
- Day one: fill in the one-page plan, including the dollar value per point of your instrument, your risk per trade in dollars, and your daily and weekly stops in dollars and R.
- Day two: practice on a demo the actions your plan depends on: entering with a bracket, moving a stop toward profit, and flattening a position.
- Days three to five: trade the plan on the demo, log every trade the same day, and stop at the daily limit even when it feels unnecessary.
- End of the week: count how many trades followed every rule. That number, not the profit, decides whether you keep practicing or start your first 20-trade block.
If any line of the plan is still a feeling rather than a number or a checkable condition, that line is the next task, not the next trade.
This guide is educational and is not financial advice or a recommendation to trade any instrument or strategy. Futures and other leveraged products carry substantial risk of loss, and losses can exceed the amount deposited. Stops and loss limits reduce risk but do not remove it, and a stop order may fill at a worse price in fast or illiquid markets. All prices, costs and stop distances in the examples are illustrative assumptions, not quotes. Simulated, evaluation and funded accounts are simulated and do not reproduce live execution, and past or simulated results do not predict future results.


