



TL;DR: The VWMA indicator averages closes weighted by volume, so the real decision is how to read its gap to a plain moving average. On 252 ES and NQ sessions, the 20-period VWMA sat under its SMA most days while both markets rose. Most ES crossovers with the SMA reversed within ten sessions, so treat a cross as a cue to watch the gap.
You add the VWMA indicator to a chart, it slips across your 20-period SMA, and now you have to decide whether that cross means anything. Answering that starts with what the line actually measures.
A plain moving average asks where price has been on average. The VWMA asks where price has been on the bars where the most contracts or shares changed hands. That sounds like a small change. It is not, because it changes what the line means, how it moves on busy days, and which signals are worth acting on. This guide works the formula on five real E-mini S&P 500 sessions, then measures the VWMA indicator on 252 completed daily sessions of E-mini S&P 500 (ES) and E-mini Nasdaq-100 (NQ) futures, so you can see how the line behaved instead of taking its reputation on trust.
What the VWMA Indicator Measures
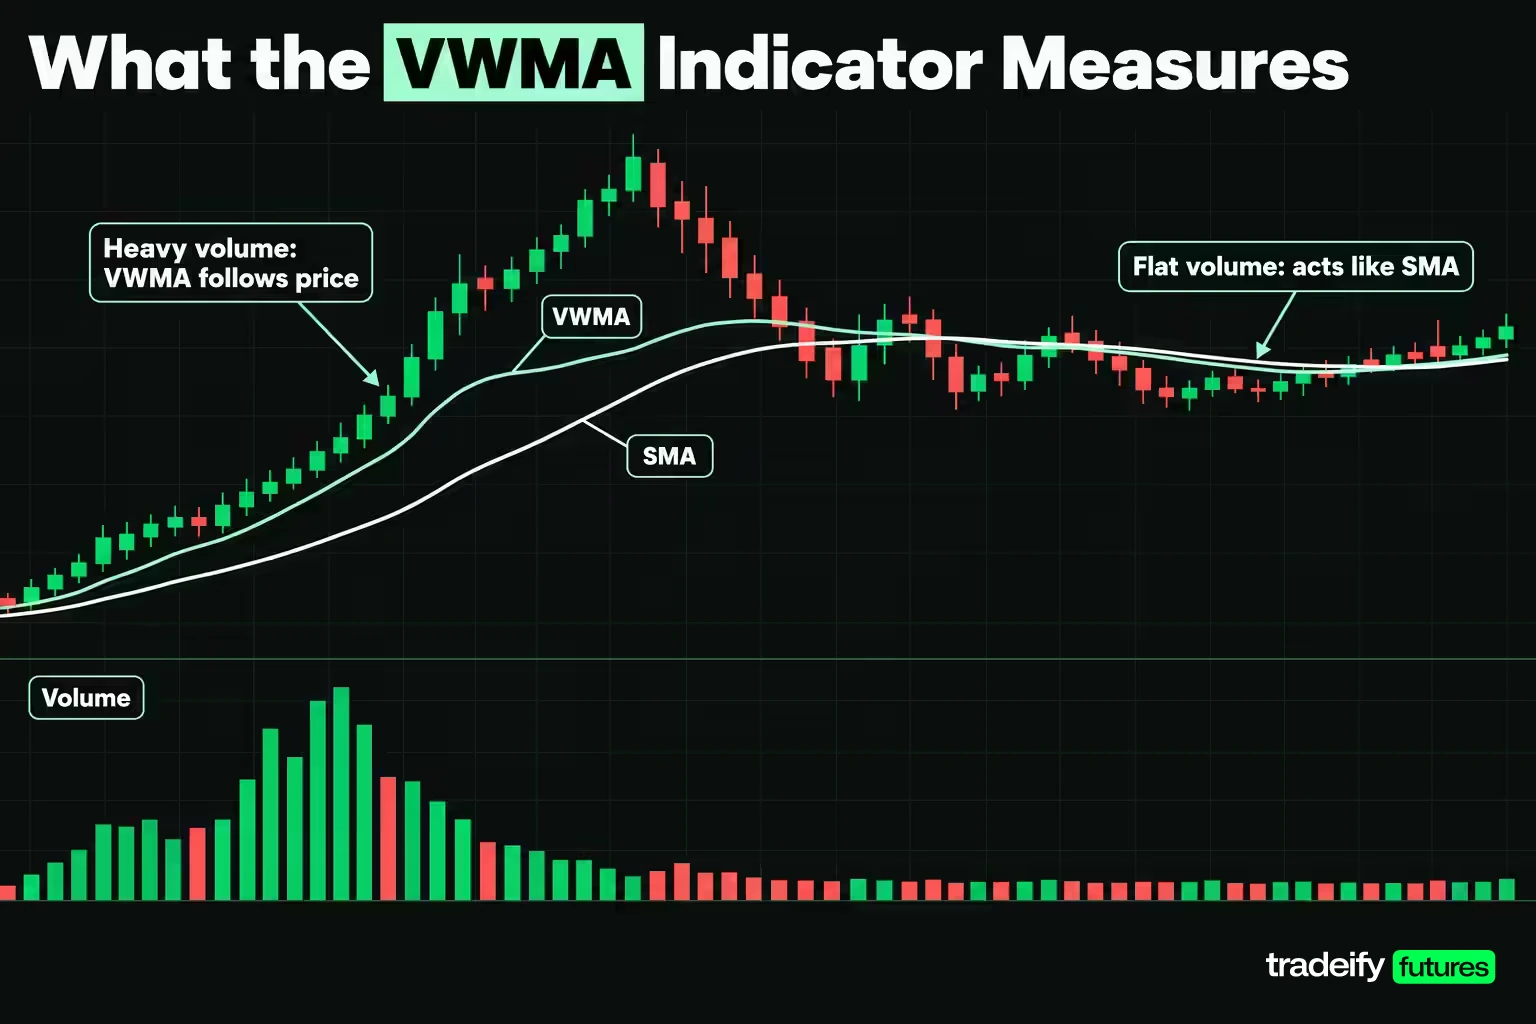
The volume weighted moving average (VWMA) is a rolling average of closing prices in which each bar counts in proportion to its volume. TradingView's reference gives the formula as the sum of close times volume divided by the sum of volume over the chosen number of bars. A simple moving average (SMA) gives every close the same weight. The VWMA gives a busy session more say than a quiet one.
The VWMA indicator plots as a price level on the chart, like any moving average. It is not an oscillator and has no fixed range. NinjaScript's documentation describes it as non-cumulative, meaning only the bars inside the chosen period count, and the oldest bar drops out as each new one arrives.
The practical behaviour follows from the weighting. NinjaTrader puts it simply: on heavy volume days the VWMA follows price more closely, and on lighter volume days it acts much like a simple moving average. So the VWMA indicator is most different from an SMA exactly when volume is uneven, and nearly identical when volume is flat.
What the line tells you, then, is the average price of the window tilted toward the sessions where most of the business was done. The more useful reading is usually the distance between the VWMA and an SMA of the same length, because that distance isolates what the volume added.
VWMA study data and method
Every measured figure in this guide comes from one stated sample. The data is daily continuous front-month ES and NQ futures bars from the Yahoo Finance chart service, not back-adjusted. The study window is the 252 completed sessions with usable volume from October 31, 2025 to November 3, 2026 on each contract.
Seven bars were removed from the two-year download before any calculation. Six carried a volume of zero, and one repeated the prior session's volume exactly. The still-trading November 4 and November 5, 2026 bars were also left out. The reasons for each removal are part of how the VWMA indicator should be fed, so the data checks get their own section later in the guide.
Related lesson: Moving averages SMA vs EMA
VWMA Formula and Calculation on Five ES Sessions
The VWMA formula has three steps for any period length n:
- Multiply each bar's close by that bar's volume.
- Add those products across the last n bars.
- Divide by the total volume of the same n bars.
The five ES sessions from October 28 to November 3, 2026 show the arithmetic. The close times volume column is in millions so the numbers stay readable.
| ES session | Close | Volume | Close x volume (millions) | Running sum (millions) | Running volume |
|---|---|---|---|---|---|
| October 28, 2026 | 7,783.25 | 1,576,563 | 12,270.78 | 12,270.78 | 1,576,563 |
| October 29, 2026 | 7,754.25 | 1,998,904 | 15,500.00 | 27,770.79 | 3,575,467 |
| October 30, 2026 | 7,614.00 | 2,539,896 | 19,338.77 | 47,109.55 | 6,115,363 |
| November 2, 2026 | 7,574.50 | 2,002,583 | 15,168.56 | 62,278.12 | 8,117,946 |
| November 3, 2026 | 7,596.75 | 1,645,013 | 12,496.75 | 74,774.87 | 9,762,959 |
The five-session VWMA is the final running sum divided by the final running volume. That is 74,774.87 million divided by 9,762,959 contracts, which gives 7,659.04. If you add the five rounded cells in the close times volume column yourself, you get 74,774.86, and the division still lands on 7,659.04.
The same five closes averaged without volume give an SMA of 7,664.55. The VWMA sits 5.51 points under it. The reason is visible in the table: the two heaviest sessions, October 30 and November 2, closed at the low end of the week, so they pulled the weighted average down.
What one heavy session does to the VWMA
A single session's volume can move the VWMA more than a trader might expect. Keep every close in the five-session ES table the same and change one volume figure.
- Triple the volume on November 2, the lowest close at 7,574.50, and the VWMA falls to 7,634.45. It now sits 30.10 points under the unchanged SMA.
- Triple the volume on October 28, the highest close at 7,783.25, and the VWMA rises to 7,689.36, which is 24.81 points above the SMA.
The SMA does not move in either case, because it never looks at volume. That is the whole point of the VWMA indicator and also its main risk. One outsized session, such as an expiry, a data release or a bad volume print, can drag the line further than a week of ordinary trade.
VWMA vs SMA and the Gap Between Them
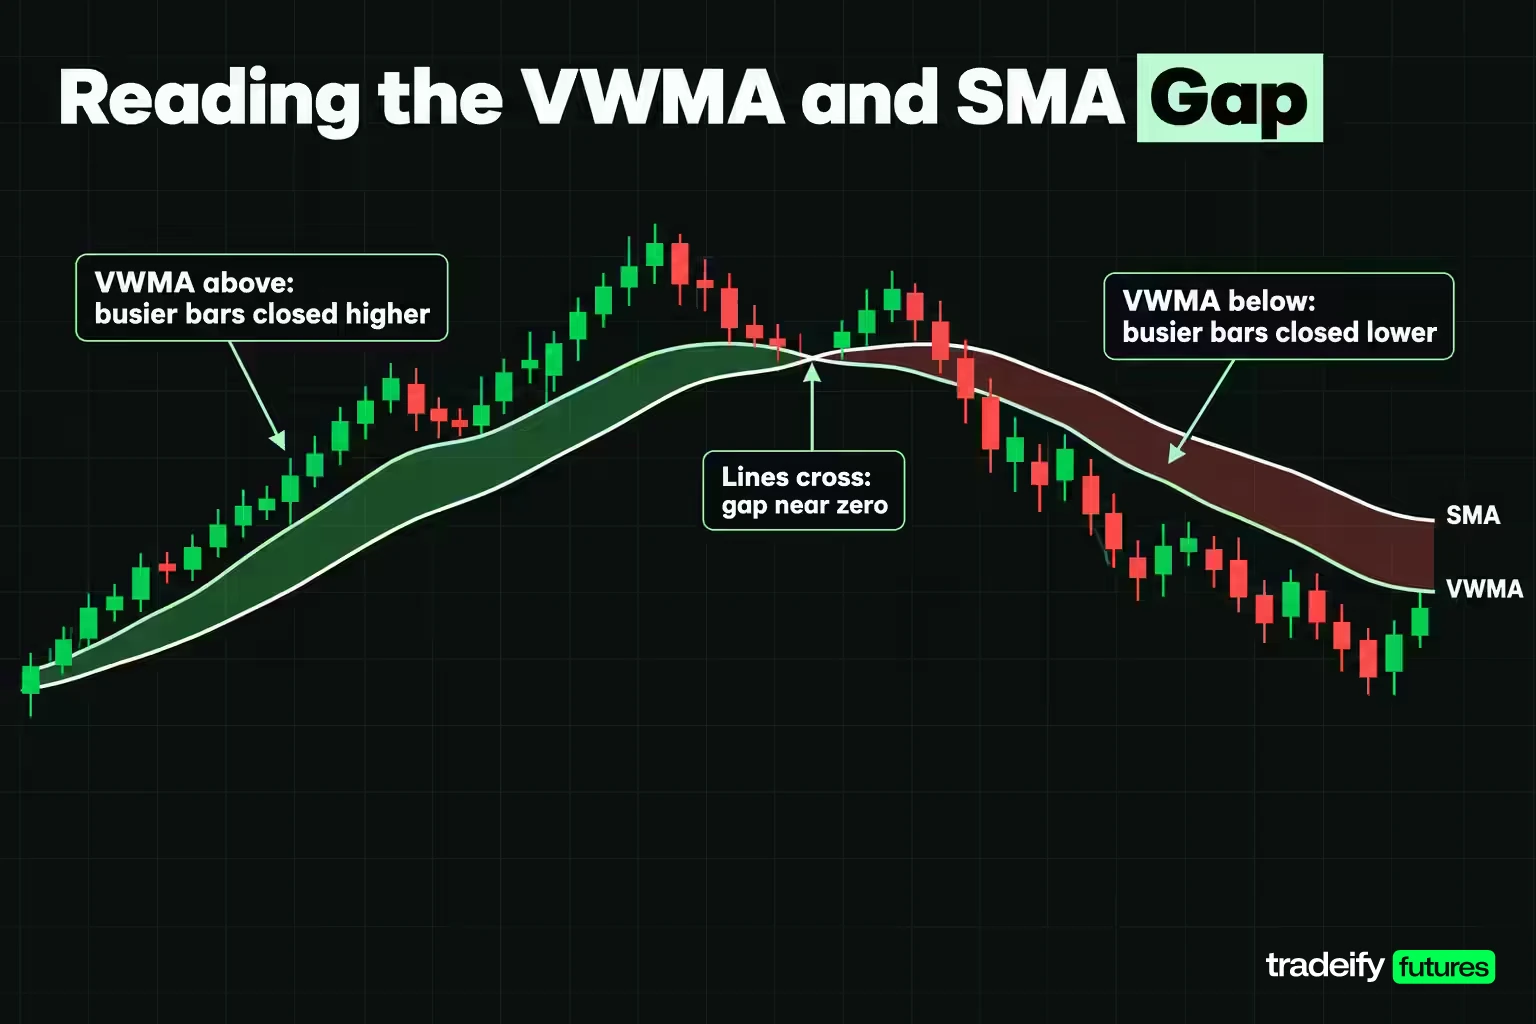
The VWMA and an SMA of the same length use the same closes. The only difference is the weights, so the gap between the two lines measures exactly what volume added to the average.
That gap has a precise meaning. VWMA minus SMA equals the covariance between close and volume inside the window, divided by the window's average volume. In plain terms:
- The gap is positive when the busier bars in the window closed above the window's average close.
- The gap is negative when the busier bars closed below it.
- The gap shrinks toward zero when volume is flat across the window, because then every bar carries roughly equal weight.
This identity is algebra, not an empirical finding, and the study confirmed it numerically. On all 252 sessions, at five period lengths, on both ES and NQ, the VWMA minus the SMA matched the covariance formula to floating-point precision.
How big the VWMA and SMA gap gets on ES and NQ
The size of the gap tells you how much weight to give it. Over the 252 sessions from October 31, 2025 to November 3, 2026, at a 20-period setting:
| 20-period gap | ES points | NQ points | ES share of price | NQ share of price |
|---|---|---|---|---|
| Median | 8.07 | 41.66 | 0.111% | 0.161% |
| 90th percentile | 21.84 | 115.54 | 0.307% | 0.437% |
| Largest | 29.71 | 167.45 | 0.438% | 0.549% |
On a typical day the two lines were about a tenth of a percent apart. That is small next to a normal session's range, which is why the VWMA and SMA often look like one line on a daily chart. A gap near the 90th percentile is the unusual case, and it is the one that deserves a closer look.
The VWMA gap grows with volume
Splitting the same 252 sessions into three equal groups by total 20-session volume shows the gap widening as windows get busier.
| Volume third (20-session window) | ES mean window volume | ES mean gap | ES median gap | NQ mean window volume | NQ mean gap | NQ median gap |
|---|---|---|---|---|---|---|
| Lowest | 26,132,205 | 7.94 | 5.98 | 9,657,643 | 45.91 | 31.02 |
| Middle | 30,911,449 | 8.51 | 7.93 | 11,359,587 | 52.81 | 36.08 |
| Highest | 34,061,794 | 12.95 | 11.27 | 12,690,359 | 74.06 | 81.22 |
As a share of price, the mean ES gap rose from 0.107% in the quietest third to 0.186% in the busiest. On NQ it rose from 0.164% to 0.267%. Read this as a fact about the VWMA indicator, not a forecast about the market. Busy windows give the weighting more to work with, so the lines separate more. A 12-point ES gap is ordinary in a heavy window and large in a quiet one, so a gap reading means little until you know which kind of window produced it.
VWMA vs WMA, EMA and VWAP
Four averages get confused with the VWMA, and they answer different questions. The weighted moving average (WMA) and exponential moving average (EMA) weight bars by time. VWAP weights by volume but resets every session.
| Average | What sets each bar's weight | Uses volume | Resets each session |
|---|---|---|---|
| SMA | Equal weight for every bar | No | No |
| WMA | Weights fall in an arithmetic step from newest to oldest bar | No | No |
| EMA | Weights fall exponentially, alpha = 2 / (length + 1) | No | No |
| VWMA | Each bar's share of the window's volume | Yes | No |
| VWAP | Each trade's share of the session's volume, from the session start | Yes | Yes |
VWMA vs WMA and EMA
Pine Script's reference describes the WMA as weights that decrease in arithmetical progression and the EMA as weights that decrease exponentially. Both lean toward the newest bars no matter how much traded on them. The VWMA leans toward the busiest bars no matter when they printed. So an EMA reacts faster to a sharp move on thin volume, and a VWMA reacts faster to a move that came with heavy volume. If your question is whether volume backed a move, only the VWMA can answer it.
VWMA vs VWAP
VWAP is the average price traded through a session, weighted by volume, and it starts fresh at each session open. StockCharts notes that VWAP is not defined for daily, weekly or monthly bars. The VWMA indicator rolls over a fixed number of bars on any timeframe, so a 20-period daily VWMA still carries the last 20 sessions forward tomorrow. A moving VWAP (MVWAP), which averages VWAP values over several days, sits closer to the VWMA in spirit, but it is still built from daily VWAPs rather than closes.
In practice, VWAP is the intraday execution benchmark, and the VWMA is a multi-bar trend and volume reading. Neither is better. They measure different things.
Related lesson: VWAP indicator
What the VWMA Says About Buying Pressure
The common reading of the VWMA indicator is about buying and selling pressure. TradingView's reference says that when the VWMA is above the SMA, volume has generally been higher on days the market closed higher. When it is below, volume may have been heavier on down days. That reading is worth testing before you rely on it.
The 252-session window from October 31, 2025 to November 3, 2026 was a rising market. ES climbed from 6,874.00 to 7,596.75, a 10.51% gain, and NQ from 26,004.00 to 28,305.75, an 8.85% gain. Yet the 20-period VWMA sat under the 20-period SMA on 209 of 252 ES sessions (82.94%) and 181 of 252 NQ sessions (71.83%).
The volume explains it. Down sessions in this window simply traded more than up sessions:
- ES had 129 up days averaging 1,469,025 contracts and 123 down days averaging 1,591,447, so down days were 8.3% heavier.
- NQ had 134 up days averaging 535,537 contracts and 118 down days averaging 604,350, so down days were 12.8% heavier.
Because selling days drew more volume in this window, the weighting tilted the VWMA toward lower closes even while the trend was up. A VWMA under the SMA in that setting is the normal state of the line. It is not a bearish signal.
How well the gap sign tracks up-day and down-day volume
The TradingView reading held most of the time but not reliably. This guide's own test on Yahoo Finance daily ES and NQ bars, October 31, 2025 to November 3, 2026, compared the sign of the 20-period gap with a direct count: was average up-day volume higher than average down-day volume in the same 20 sessions? The two agreed on 169 of 252 ES sessions (67.06%) and 154 of 252 NQ sessions (61.11%).
The gap misses about a third of the time because it measures something slightly different. The covariance behind the VWMA gap compares volume with the level of each close against the window average, not with whether that day closed up or down. A heavy up day that still closed below the window's average pulls the VWMA down.
So use the VWMA gap as a rough pressure gauge, and check it against the volume bars before you lean on it. If the decision depends on who was more aggressive, a direct up-volume and down-volume count, or a tool built for that job, answers it more cleanly.
Related lesson: On balance volume
VWMA Indicator Trading Signals Measured on 252 Sessions
The VWMA indicator produces two kinds of signal on most charts: the VWMA crossing an SMA, and price crossing the VWMA. Both were measured on the 252 ES and NQ sessions from October 31, 2025 to November 3, 2026.
VWMA and SMA crossovers
The crossover figures are this guide's own calculation on Yahoo Finance daily data. A crossover here means the 20-period VWMA moving from one side of the 20-period SMA to the other. Each cross was given a ten-session test. It counts as widened if the gap grew past 0.25% of price in the direction of the cross, as reversed if the lines crossed back first, and as neither if nothing decisive happened. The 0.25% bar sits between the median and the 90th percentile gap on both contracts, so reaching it means the lines separated by more than usual.
| 20-period VWMA and SMA crossovers | Crossovers | Widened past 0.25% | Reversed first | Neither in 10 sessions |
|---|---|---|---|---|
| ES | 14 | 1 | 8 | 5 |
| NQ | 8 | 3 | 1 | 4 |
On ES, one of 14 crossovers widened, eight reversed and five did neither. On NQ, three of eight widened. The lines were nearly touching when they crossed. On ES every cross happened with the gap at 0.117% or less, and 11 of 14 happened at 0.04% or closer. On NQ the largest gap at a cross was 0.144%.
Shorter settings make this worse in the same own-calculation sample. At five periods, ES produced 38 crossovers, of which 30 reversed within ten sessions and four widened. NQ produced 46, with 35 reversals and six widenings.
That is the uncomfortable part. The cross looks like an event on the chart, and it is the moment the two lines are closest to being the same line. In this sample they crossed because two nearly identical averages drifted across each other, not because something changed. Treat a crossover as the moment to start watching the gap. The gap growing past its usual range is the part that carries information.
Price crossing the VWMA vs price crossing the SMA
Many traders use the VWMA as dynamic support or resistance and act when price closes through it. This guide's own count, on Yahoo Finance daily ES and NQ futures bars from October 31, 2025 to November 3, 2026, measured how often a daily close crossed the 20-period line and then crossed back within five sessions.
| Daily close crossing the 20-period line | ES crosses | ES crossed back within 5 sessions | NQ crosses | NQ crossed back within 5 sessions |
|---|---|---|---|---|
| VWMA | 37 | 22 of 35 (62.86%) | 45 | 32 of 45 (71.11%) |
| SMA | 35 | 20 of 33 (60.61%) | 39 | 25 of 39 (64.10%) |
The counts for crosses with five sessions of follow-up are slightly lower on ES because the last crosses in the window had not yet run five sessions. In this sample the VWMA was not a cleaner line to trade against. Price crossed it more often than the SMA and crossed back more often too. That fits the definition, because the VWMA sits closer to price after heavy sessions, so a close through it takes less of a move.
None of this says the VWMA cannot help. It says a close through the line is not, on its own, a decision. Reading the direction correctly and having a valid entry are two different things. It becomes useful when you combine it with structure, such as a prior swing level, and with the gap and volume conditions that tell you whether the move had participation.
Related lesson: Moving average crossovers
VWMA Trading Strategies Tested on Daily Futures
The best-known published VWMA strategy comes from Ken Calhoun's article "Volume-Weighted Moving Average Breakouts" in the February 2017 issue of Technical Analysis of Stocks & Commodities. The thinkorswim strategy library carries it as VWMABreakouts. It plots an SMA as the trendline and a VWMA as the signal line. A buy to open fires when the VWMA crosses above the SMA, and a sell to close fires when it falls back under. The defaults are a 50-period VWMA and a 70-period SMA, which the author suggested for 15-minute charts covering 15 days. The April 2017 Traders' Tips column, which collected code for the method, reports the author's view that including volume can help avoid false breakouts.
The VWMA breakout rule on daily ES and NQ bars
Calhoun's rule, a 50-period VWMA crossing a 70-period SMA, was applied in this guide's own test to Yahoo Finance daily ES and NQ closes from February 14, 2025 to November 3, 2026, 426 sessions on each contract. This is a different timeframe from the one Calhoun suggested, so it tests the logic on daily bars rather than his exact setup. Entries and exits use the close of the crossing day, and there are no costs.
| VWMA 50 and SMA 70 rule, daily bars | ES | NQ |
|---|---|---|
| Closed trades | 3 | 3 |
| Closed trade results in points | +939.50, -366.50, +427.00 | +3,832.50, -243.50, +1,850.00 |
| Total closed points | +1,000.00 | +5,439.00 |
| Open trade at November 3, 2026 | Long from 7,662.50, down 65.75 | Long from 31,317.75, down 3,012.00 |
| Sessions spent long | 281 of 426 | 256 of 426 |
| Buy and hold over the same sessions | +1,464.75 | +6,109.50 |
Three closed trades in almost two years is far too few to judge the rule. One good or bad trade is one line in the sample, not a verdict. What the table does show is the character of the strategy on daily bars. It stayed long through most of the 2025 rally, gave back part of a gain in early 2026, and was holding an open loss after NQ fell from 31,483.25 on October 6, 2026. The continuous series also stitches quarterly contracts together without adjustment, so trade results that span a roll include the price seam between contracts. Treat the figures as a description of how the rule behaved, not a backtest you can trade.
The VWMA gap as a trend filter
A second approach uses the gap rather than the cross. The VWMA and SMA rule becomes a filter for another setup: take long setups only when price is above the SMA and the VWMA gap is positive and growing, which says busier bars are closing higher. Stand aside when the gap is inside its normal range, because that says volume is not favouring either side.
The condition that confirms the filter is a gap moving into the upper part of its own history, for example past 0.307% of price, the 90th percentile of the 20-period ES gap in this guide's 252-session sample ending November 3, 2026. The condition that cancels it is the gap shrinking back toward zero or flipping sign. On index futures, where the gap sat negative most of the year, a long-only filter like this would rarely switch on, which is itself useful information about the market you trade.
The VWMA as context for pullbacks
A third use is pullback context. In an uptrend, a pullback that holds near a rising VWMA on falling volume is a different event from one that slices through it on heavy volume. The VWMA does not decide the trade. It frames the question: did the busy sessions defend this area or abandon it? Pair that with a defined stop beyond the structure, not beyond the line, because the line moves every bar.
Where volume traded across price, rather than through time, is a separate question that the VWMA cannot answer.
Related lesson: Volume profile
VWMA Settings and Period Length
The VWMA indicator has one main setting, the period length, and some platforms also let you choose the source price. Published examples vary widely. Pine Script's reference uses a 15-bar example, NinjaScript's documentation shows a 14-period VWMA crossing a 40-period VWMA, NinjaTrader's blog pairs a 15-period VWMA with a 20-period SMA on a 5-minute chart, and Calhoun's strategy uses 50 and 70 on 15-minute bars. None of these is a universal default.
The same 252-session ES and NQ window was run at five lengths to show what the setting changes.
| VWMA period | ES below SMA | ES crossovers | ES median gap | ES 90th percentile gap | ES largest gap |
|---|---|---|---|---|---|
| 5 | 77.38% | 38 | 0.045% | 0.165% | 0.502% |
| 10 | 85.71% | 28 | 0.079% | 0.203% | 0.566% |
| 20 | 82.94% | 14 | 0.111% | 0.307% | 0.438% |
| 50 | 89.29% | 3 | 0.146% | 0.348% | 0.474% |
| 100 | 86.11% | 1 | 0.211% | 0.315% | 0.460% |
| VWMA length | NQ below SMA | NQ crossovers | NQ median gap | NQ 90th percentile gap | NQ largest gap |
|---|---|---|---|---|---|
| 5 | 75.79% | 46 | 0.075% | 0.223% | 1.106% |
| 10 | 76.59% | 28 | 0.105% | 0.394% | 0.999% |
| 20 | 71.83% | 8 | 0.161% | 0.437% | 0.549% |
| 50 | 63.10% | 9 | 0.177% | 0.313% | 0.725% |
| 100 | 60.32% | 3 | 0.146% | 0.333% | 0.506% |
Choosing a VWMA length on purpose
Two patterns hold on both contracts. Crossovers fall sharply as the period gets longer, from 38 to one on ES and from 46 to three on NQ. The typical gap grows with length on ES, from 0.045% at five periods to 0.211% at 100, because a longer window holds more uneven volume.
The practical choice follows from what you plan to read. If the crossover is your trigger, short settings give you many of them and most reverse. If the gap is your reading, a length around 20 to 50 gives a gap big enough to compare against its own history. One year on two index futures cannot name a best setting, so pick the length that matches your holding period, write it into your plan, and keep it. Changing the length after a losing week until the last loss disappears is curve-fitting the VWMA to a story.
How to Add the VWMA Indicator on Your Platform
Most charting platforms include the VWMA indicator as a built-in study, and it is easy to code where it is not. The steps that matter are choosing the length, confirming the source price, and checking the platform's number once against your own calculation.
VWMA in TradingView Pine Script
TradingView offers the VWMA as a built-in indicator. In Pine Script the function is ta.vwma(source, length), for example ta.vwma(close, 20). The Pine reference states that it is the same as the SMA of source times volume divided by the SMA of volume over the same length. Dividing two averages over the same length gives the same result as dividing two sums, so this matches the standard formula, the sum of close times volume divided by the sum of volume. The reference also notes that na values in the source are ignored.
VWMA in NinjaTrader and thinkorswim
NinjaScript exposes the VWMA as VWMA(int period), or VWMA(input, period) to run it on another series such as highs. Its documentation shows a crossover check of a 14-period VWMA against a 40-period VWMA. In thinkorswim, the VWMABreakouts strategy plots a VWMA against a moving-average trendline with adjustable lengths and average type, and it labels backtest results as hypothetical.
VWMA in a spreadsheet and how to verify a platform
In a spreadsheet with closes in column B and volume in column C, the 20-period VWMA on row 21 is =SUMPRODUCT(B2:B21,C2:C21)/SUM(C2:C21). Copy it down and the window rolls with it.
To verify a platform, export 20 to 30 bars, rebuild the last value in the spreadsheet, and compare. If the two disagree, check these in order:
- The source price. Some setups use typical price or another input instead of the close.
- The length, including whether the platform counts the current, unfinished bar.
- The volume field, especially on futures, where continuous series and data vendors can differ.
VWMA Volume Data Problems to Check First
The VWMA indicator is only as good as its volume column, and futures volume data has quirks a plain moving average never notices. The two-year ES and NQ download behind this guide showed four of them.
Zero-volume bars
Six bars in the download carried zero volume: June 5, June 18, July 3, July 4 and August 29, 2025, and November 3, 2025. A zero-volume bar adds nothing to the close times volume sum and nothing to the volume sum, so the VWMA gives it no weight at all. The SMA still counts that close at full weight. The two lines then cover different sessions, and the gap picks up an error that has nothing to do with the market. Drop zero-volume bars, or confirm the session really did not trade, before reading the gap.
Repeated volume prints
One bar, October 13, 2025, showed exactly the same volume as the session before it, which is a data artefact rather than a coincidence. The same thing appeared on the still-open November 4, 2026 bar, whose volume of 1,645,013 on ES and 653,606 on NQ matched November 3 exactly. A live or unfinished bar can carry a placeholder volume until the vendor updates it. Base any VWMA reading on completed bars.
Roll-week volume on continuous futures
Continuous front-month futures series switch contracts at expiry, and volume collapses in the days before the switch. CME's equity index roll date is the Monday before the third Friday of the expiry month, after which most traders move to the next contract. In September 2026 that was Monday, September 14. The ES continuous series then showed:
- September 14: 1,925,420 contracts
- September 15: 943,078
- September 16: 487,789
- September 17: 285,399, about 21% of the prior 20-session median of 1,330,219.5
- September 18: 1,470,203, back near its normal level
Those thin days were thin only for the expiring contract, not for the market. A VWMA built on that series gives the roll week almost no weight, which is arguably right, but it also means the line is weighting a contract most traders had already left. If you trade a specific contract month, chart that month or a properly rolled series.
What futures volume counts in a VWMA
CME reports volume as the number of contracts traded on the date across its venues. A VWMA on ES therefore weights by ES contracts only. It does not include S&P 500 ETF shares, the cash index stocks or the micro contract, so it measures one slice of participation in the S&P 500.
Related lesson: What is volume
VWMA Advantages and Disadvantages
The VWMA indicator earns its place on a chart for specific jobs and gets in the way for others. The trade-offs, tied where they apply to this guide's own 252-session measurement of Yahoo Finance daily ES and NQ bars:
| VWMA advantage | Why it holds |
|---|---|
| Shows whether volume backed the recent closes | The gap to an SMA of the same length is the close and volume covariance, so it isolates what volume added |
| Reacts faster after heavy sessions | Heavy bars pull the line toward their closes, as the tripled-volume example shows |
| Works on any timeframe | It rolls over a fixed number of bars and does not reset like VWAP |
| Easy to verify | One SUMPRODUCT and one SUM rebuild any platform value |
| VWMA disadvantage | Why it matters |
|---|---|
| Lags like any moving average | Every bar in the window must print before the value exists |
| Swings on volume spikes and bad prints | One tripled session moved the five-session ES VWMA by about 25 to 30 points |
| Adds little in quiet windows | With flat volume it behaves almost exactly like an SMA |
| Crossovers with the SMA are noisy | Eight of 14 ES crosses at 20 periods reversed within ten sessions |
| More price whipsaws than an SMA in this sample | Daily closes crossed back through the 20-period VWMA within five sessions 62.86% of the time on ES |
| Depends on clean volume data | Zero, repeated and roll-week volume all distort it |
Both tables point the same way. The VWMA indicator is a good diagnostic and a weak trigger. It tells you about participation. It does not tell you when to enter.
A VWMA Reading Routine for Futures Traders
A short routine keeps the VWMA indicator useful without turning it into a signal machine:
- Clean the volume column first. Drop zero-volume bars, repeated volume prints and the unfinished current bar, and know when your continuous series rolls.
- Pick one length and keep it. A gap at 20 periods and a gap at 50 periods are different measurements.
- Plot an SMA of the same length and record the gap in points and as a share of price, not just its sign.
- Place the gap against its own history. Note whether it sits near the median or near the 90th percentile for that market and length.
- Check which volume regime produced it. The same point gap means more in a quiet window than in a busy one.
- Treat a VWMA and SMA crossover as the start of a watch, and let structure, a defined stop and your plan decide the trade.
As a worked reading, ES closed at 7,596.75 on November 3, 2026. As of that close, the 20-period VWMA was 7,735.23 and the 20-period SMA was 7,747.89, a gap of 12.66 points, or 0.163% of price, with the VWMA under the SMA. That is above the 0.111% median for the 252-session window and well short of the 0.307% 90th percentile. Read plainly, the heavier sessions in that window closed lower, which fits a pullback after a rally. It is a description of the last 20 sessions, not a forecast of the next one.
None of this decides position size. Size comes from the distance to your stop and the loss you accept on the trade.
On our accounts, every position must be closed by 4:45 PM ET and nothing is held overnight, so a daily VWMA reading works as context for the next session, not as a reason to hold a swing. NinjaTrader and TradingView, both reachable with Tradovate credentials, include a VWMA study, and our funded accounts are simulated.
Related lesson: Position sizing
VWMA Indicator Questions
Which is better, VWMA or VWAP?
Neither is better, because they answer different questions. VWAP resets every session and shows where that session's business was done, which makes it an intraday execution benchmark. The VWMA rolls over a fixed number of bars on any timeframe and shows where the recent window's business was done.
What does the VWMA indicator tell you?
The VWMA indicator tells you the average closing price of the window, weighted toward the bars that traded the most. Its most useful output is the gap to an SMA of the same length. A positive gap means the busier bars closed above the window's average, and a negative gap means they closed below it.
Is the VWMA better than an EMA?
They weight different things. An EMA weights recent bars more heavily and ignores volume, so it reacts faster to any sharp move. The VWMA weights busy bars more heavily, so it reacts faster to moves that came with heavy volume.
What is the best VWMA setting?
There is no single best VWMA setting. Short lengths such as 5 produce many crossovers with the SMA, most of which reversed in the ES and NQ study, while 20 to 50 gives a steadier gap to read. Match the length to your holding period and keep it fixed.
Does a VWMA crossover mean the trend has changed?
Usually not. In this guide's own test of 252 daily ES sessions (Yahoo Finance data), eight of 14 crossovers between the 20-period VWMA and SMA crossed back within ten sessions, and only one widened past 0.25% of price. Treat the cross as a reason to watch the gap, not as a trend change.
Is price above the VWMA bullish?
Price above the VWMA means the latest close is above the volume-weighted average of the window, which is what a rising market looks like. It describes the past window and does not forecast the next bar. In this guide's own 2025 to 2026 count on Yahoo Finance data, ES closed above its 20-period VWMA on 154 of 252 sessions.
Does the VWMA work on futures?
Yes, as long as the volume data is clean. Futures volume counts contracts in that one contract, and continuous series show zero, repeated and roll-week volume quirks. Clean those first, and remember the line weights only the contract on your chart.
This article is for education only and is not investment advice. Futures trading uses leverage and can lose more than you expect, quickly. The measurements here are historical, based on continuous futures data and a stated method with no trading costs, and past indicator behaviour does not predict future results. Evaluation and funded trading accounts are simulated, and simulated results differ from live trading.


