



TL;DR: The VWAP indicator shows the average price paid since the session open, weighted by volume, and it resets every session. It describes where volume traded; it does not forecast where price goes. Across 49 ES and NQ sessions, a one-deviation band held under half of all 5-minute bars. Price touched or crossed the line on most days, so a touch alone is not a signal.
The VWAP indicator gets treated as a magic line far more often than it deserves. Price taps it and someone calls support. Price runs away from it and someone calls it stretched. Both calls skip the same question: how often does that happen anyway?
This guide covers what VWAP measures, how to calculate it by hand, which settings change the number, and what 49 sessions of E-mini S&P 500 (ES) and E-mini Nasdaq-100 (NQ) 5-minute data show about distance, bands and the line as a level. The study is this guide's own calculation on Yahoo Finance's 5-minute continuous futures data from August 27 to November 4, 2026, and every figure comes with its method.
What the VWAP Indicator Measures
The volume-weighted average price (VWAP) is the average price an instrument has traded at since the session opened, with each trade counted in proportion to its size. A 50-contract print moves the average fifty times as much as a 1-contract print. That single line answers a narrow question: what did the average participant pay today?
VWAP started as an execution benchmark. Institutions placing large orders compare their fills with it, and StockCharts describes a buy below VWAP or a sell above it as a good fill. A desk that bought below the line did not pay up for its size.
Three properties matter more than the definition.
- It resets. A standard VWAP starts fresh at the beginning of each trading session, so it says nothing about yesterday.
- It lags. Investopedia classifies VWAP as a lagging indicator, because every input is a trade that already happened. Its lag also grows through the day, since every new bar is averaged into a longer history.
- It is volume-dependent. The line is only as good as the volume behind it. In this guide's 49-session study, the ES regular session from 9:30 AM to 4:00 PM ET carried 78.6% of each trade date's volume across 48 complete trade dates in the sample; on NQ it carried 72.1%.
To identify the VWAP indicator on a chart, look for a single line on an intraday chart that starts at the session open, hugs price early in the day and flattens as the session goes on. If the line keeps going across several days without a jump at the open, you are looking at a moving average or an anchored VWAP, not a session VWAP.
Related lesson: What is volume
How the VWAP Indicator Is Calculated
The VWAP formula is a running sum divided by a running sum. TradingView's Help Center lays it out in five steps.
- Calculate the typical price for each bar: (High + Low + Close) / 3.
- Multiply the typical price by that bar's volume.
- Keep a cumulative total of typical price x volume since the session open.
- Keep a cumulative total of volume since the session open.
- Divide the first cumulative total by the second.
The first bar of the session has no history, so its VWAP equals its own typical price. That is why the line jumps around for the first few bars and settles later.
A Six Bar VWAP Worked Example on ES
Here is the VWAP calculation on the first six 5-minute bars of the ES regular session on November 4, 2026. Every row can be rebuilt with a calculator from the columns to its left.
| Bar start (ET) | High | Low | Close | Typical price | Volume | Cumulative volume | VWAP after bar |
|---|---|---|---|---|---|---|---|
| 9:30 AM | 7,697.00 | 7,679.75 | 7,682.25 | 7,686.33 | 56,720 | 56,720 | 7,686.33 |
| 9:35 AM | 7,713.00 | 7,682.00 | 7,713.00 | 7,702.67 | 43,938 | 100,658 | 7,693.46 |
| 9:40 AM | 7,731.50 | 7,708.75 | 7,730.75 | 7,723.67 | 40,886 | 141,544 | 7,702.19 |
| 9:45 AM | 7,734.75 | 7,722.25 | 7,725.25 | 7,727.42 | 44,620 | 186,164 | 7,708.24 |
| 9:50 AM | 7,727.75 | 7,717.00 | 7,718.75 | 7,721.17 | 34,095 | 220,259 | 7,710.24 |
| 9:55 AM | 7,727.50 | 7,712.75 | 7,726.00 | 7,722.08 | 28,209 | 248,468 | 7,711.58 |
Take the 9:35 AM row. The first bar contributed 435,968,637.60 (7,686.33 x 56,720). The second added 338,439,914.46. The running total is 774,408,552.06, and 774,408,552.06 / 100,658 = 7,693.46, the printed VWAP.
Notice what the weighting did. Price climbed hard through the first 25 minutes, but the opening bar's 56,720 contracts, the largest volume of the six, kept pulling the average back. After six bars, VWAP at 7,711.58 sat 14.42 points (57.7 ticks) under the 9:55 AM close of 7,726.00. The line was not lagging by mistake. It was reporting that much of the morning's volume traded lower, which is exactly what a trader chasing the 9:55 AM high would want to know.
Tick Data Versus Bar Data in VWAP
A true VWAP multiplies every individual trade's price by that trade's size. Investopedia notes that most charting packages approximate it with typical price x bar volume instead, because few traders have the full tick feed, and StockCharts calls tick data resource-intensive. The approximation is usually close, but it is one reason two platforms can print slightly different VWAP values for the same contract.
Related lesson: Moving averages SMA vs EMA
VWAP Settings and Session Resets
Most VWAP indicator settings questions come down to two different things that people blur together: the chart interval and the calculation window.
The chart interval decides how often the line updates. On a 1-minute chart it updates every minute; on a 5-minute chart every five minutes. The calculation window decides what the line measures, and for a standard VWAP it runs from the session start to now. StockCharts states that VWAP is not defined for daily, weekly or monthly periods, because the calculation resets each session. TradingView adds a practical note: each VWAP period should include several bars, so a session-anchored VWAP on a daily chart resets on every bar and tells you nothing.
The inputs you will see on most platforms, using TradingView's VWAP as the example:
- Anchor period. How often the calculation resets: Session, Week, Month, Quarter, Year and longer, plus event anchors such as Earnings, Dividends and Splits.
- Source. The price fed into the formula. The default is hlc3, the typical price; hl2 is a common alternative.
- Bands. Standard deviation or percentage bands with up to three multipliers. In Percentage mode, a multiplier of 1 means 1%.
- Timeframe. Lets you calculate VWAP from one timeframe and display it on another.
Three VWAP Reset Conventions on One Session
For equity index futures, the biggest setting is where the session starts. Three conventions are common: the regular session (9:30 AM to 4:00 PM ET), the full Globex session that opens at 6:00 PM ET the evening before, and the calendar day (midnight to midnight ET). Here is the same completed session, November 4, 2026, measured all three ways.
| Session convention | ES VWAP | ES ticks from regular session line | NQ VWAP | NQ ticks from regular session line |
|---|---|---|---|---|
| Regular session from 9:30 AM | 7,722.38 | 0.0 | 28,682.82 | 0.0 |
| Full Globex session from 6:00 PM | 7,689.77 | 130.5 | 28,501.49 | 725.3 |
| Calendar day from midnight | 7,706.41 | 63.9 | 28,580.13 | 410.8 |
On ES the regular session line sat 130.5 ticks from the full-session line, which is $1,631.25 on one contract. On NQ the same choice was worth 725.3 ticks, or $3,626.50. Nothing about the market changed between those numbers. Only the start time did.
Choosing a VWAP Session Reset
The gap between the full-session and calendar-day VWAP lines comes from the daily maintenance break. CME lists ES hours as Sunday 6:00 PM to Friday 5:00 PM ET with a 5:00 PM to 6:00 PM ET pause, and both data series show no prints between the 4:55 PM bar and the 6:05 PM bar on November 2, 3 and 4, 2026.
For most futures day traders the regular session line is the more useful default, because it starts when the bulk of the volume arrives. Whatever you choose, check it before comparing your chart with anyone else's. If you need a line that runs past one session, that is the anchored VWAP: the same formula started from a bar you choose, such as a swing high or low or a gap.
Related lesson: Futures trading sessions and the daily maintenance window
Reading Market Sentiment With the VWAP Indicator
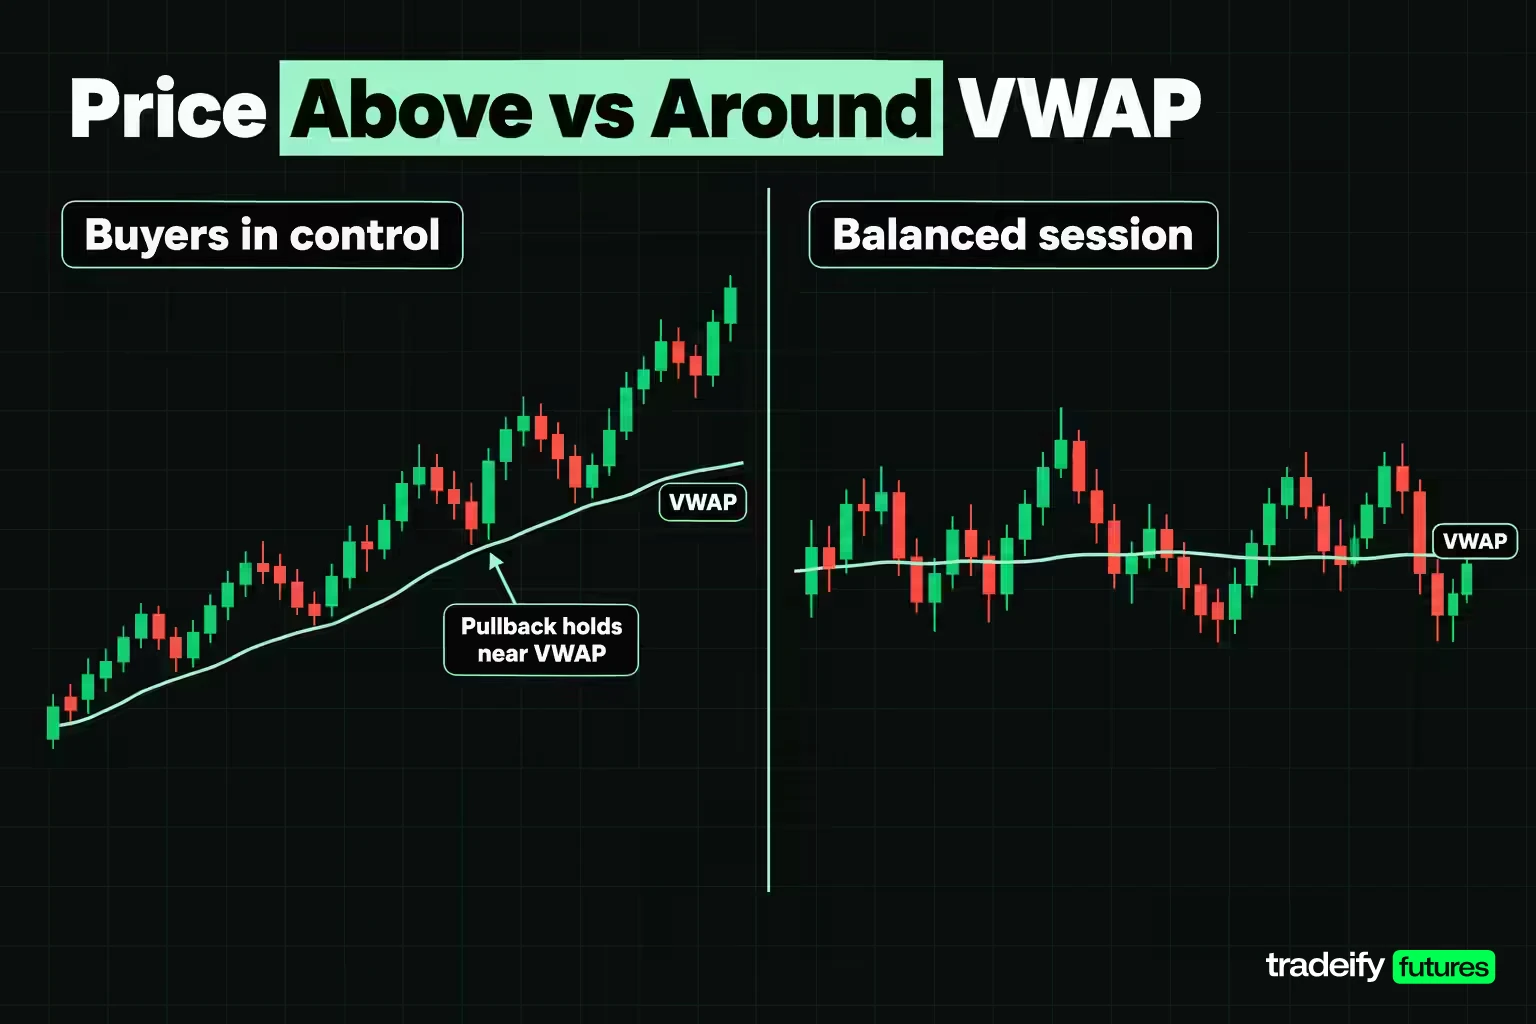
The usual sentiment read from the VWAP indicator is simple. When price trades above VWAP, the average trade since the open is in profit for buyers, and sellers who sold at the average are under water. When price trades below VWAP, the reverse is true. TradingView's description follows the same logic: prices above VWAP in a bullish trend, below it in a bearish trend, and on both sides in a sideways market.
That is an observation, not a forecast. It tells you who is comfortable right now, not whether they still will be at 3:00 PM.
The read gets useful when it is conditional. If price holds above VWAP after the open settles and pullbacks keep finding buyers near the line, buyers are in control for now. If price keeps slicing back and forth through it, the session is balanced and the line has nothing more to add. What would change your mind matters as much as the read itself.
How Far Price Closes From VWAP
The other common sentiment read is distance: "price is stretched from VWAP." Here is how far each session's regular-session close actually finished from that session's regular-session VWAP across 49 completed sessions.
| Close to VWAP distance, 49 sessions | ES | NQ |
|---|---|---|
| Closed above VWAP | 25 of 49 | 25 of 49 |
| Closed below VWAP | 24 of 49 | 24 of 49 |
| Median distance in ticks | 33.4 | 215.5 |
| Median distance per contract | $417.50 | $1,077.50 |
| Middle half of sessions, ticks | 15.6 to 58.2 | 138.2 to 461.4 |
| Mean distance in ticks | 45.3 | 331.5 |
| Largest distance in ticks | 221.3 | 1,538.9 |
| Closed within 10 ticks | 8 of 49 | 0 of 49 |
| Closed more than 100 ticks away | 5 of 49 | 39 of 49 |
| Median distance as share of median session range | 14.9% | 17.1% |
Three things stand out from that table. First, the closes split almost evenly above and below the line, so VWAP did not carry a directional lean over this sample. Second, a typical ES session closed 33.4 ticks from VWAP, so 30 or 40 ticks of separation is ordinary, not stretched. Third, ticks do not travel between contracts. NQ's median was 215.5 ticks, and 39 of 49 NQ sessions closed more than 100 ticks away.
The measure that does travel is distance as a share of the day's range: 14.9% for ES and 17.1% for NQ. If you want to call price "far from VWAP," compare the distance with the session's own range, not with a tick count you picked up from a different market.
Related lesson: Tick size and tick value
What VWAP Standard Deviation Bands Contain
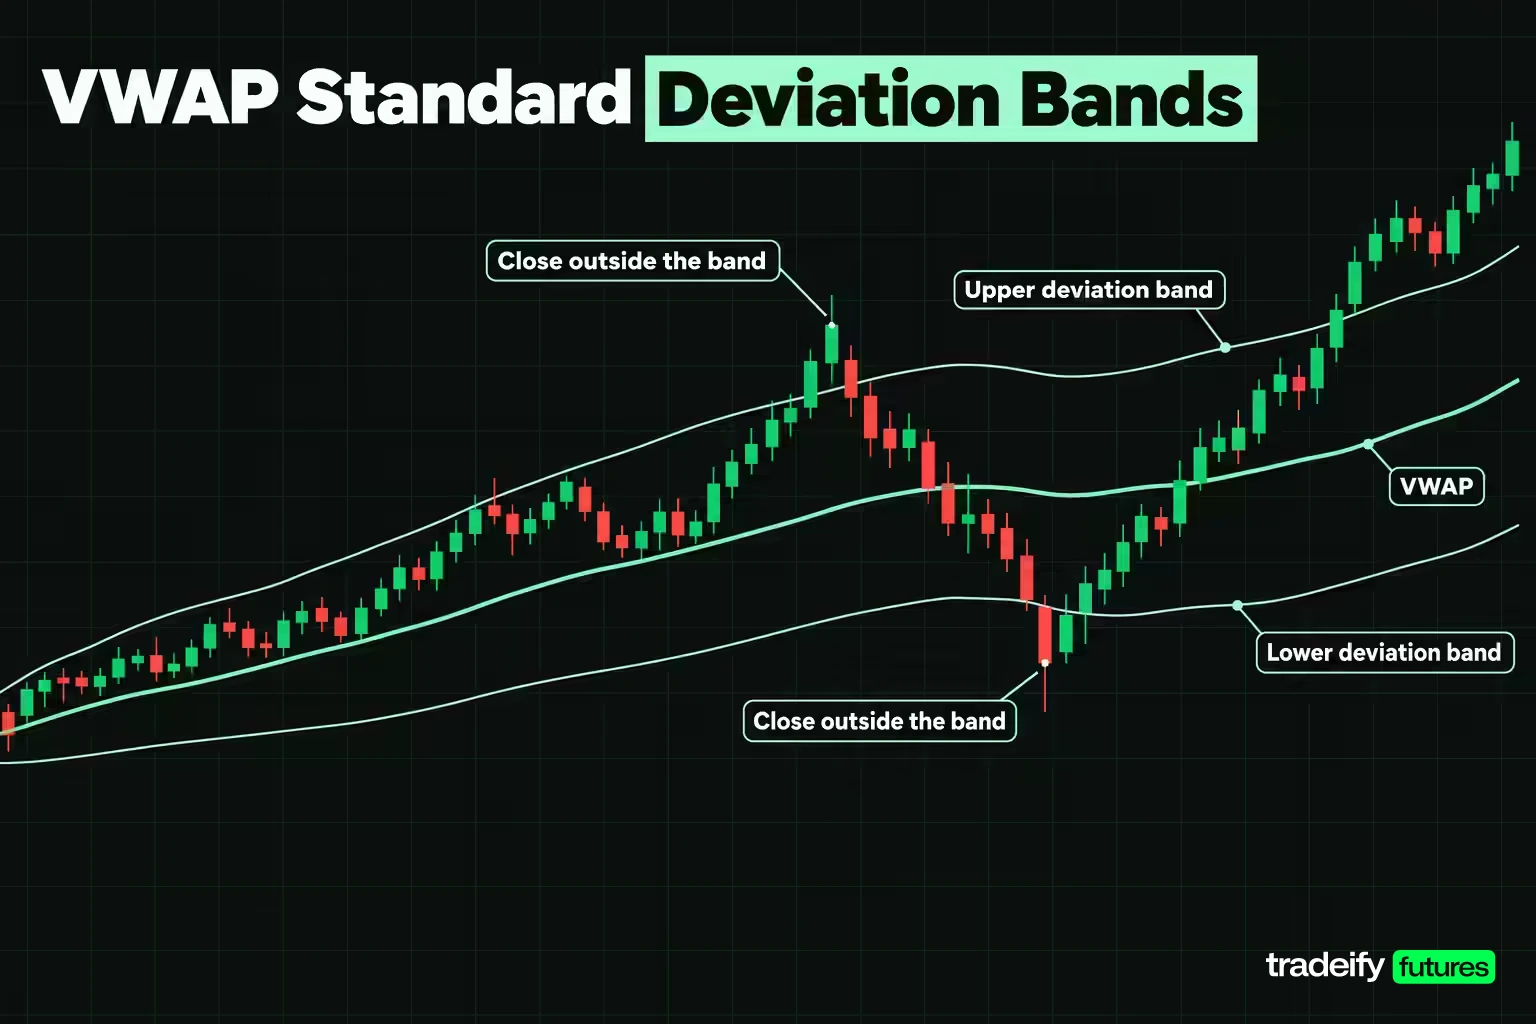
VWAP bands are lines plotted a chosen number of standard deviations above and below VWAP. The thinkorswim reference describes its study the same way, with separate inputs for the number of deviations up and down. The question the documentation does not answer is how often price sits inside them.
The study measured it on 3,772 regular-session 5-minute bars per instrument (49 sessions, first bar of each excluded because the deviation is zero there). Each bar's close was compared with that bar's running VWAP and running volume-weighted standard deviation.
Related lesson: Standard deviation indicator
| VWAP band multiple | ES bars inside | ES share | NQ bars inside | NQ share | Normal distribution |
|---|---|---|---|---|---|
| 0.5 deviation | 888 | 23.5% | 838 | 22.2% | about 38% |
| 1.0 deviation | 1,773 | 47.0% | 1,754 | 46.5% | about 68% |
| 1.5 deviations | 2,697 | 71.5% | 2,691 | 71.3% | about 87% |
| 2.0 deviations | 3,393 | 90.0% | 3,346 | 88.7% | about 95% |
| 3.0 deviations | 3,720 | 98.6% | 3,732 | 98.9% | about 99.7% |
In this 49-session study, a one-deviation band around the VWAP indicator held fewer than half of all bars: 47.0% on ES and 46.5% on NQ. So a close outside the first band happened on more than half of all bars. Treating that as a signal means treating the normal state of the market as news.
The two-deviation band held 90.0% of ES bars and 88.7% of NQ bars, which leaves about one bar in ten outside. That is wider than the roughly 95% a normal distribution would put inside two standard deviations. One reason: each bar is measured against a line it helped build, early bars are measured against a short and noisy history, and intraday moves trend rather than scatter randomly. Read the bands as a description of where price has been relative to the average price paid, and size your expectations from your own instrument's history.
VWAP as Support and Resistance
The claim that the VWAP indicator acts as support and resistance is testable. This guide's 49-session ES and NQ study looked at two parts of the day separately, because they behave very differently.
The Opening Breach of the VWAP Band
Every one of the 49 sessions, on both ES and NQ, closed a bar more than one standard deviation from VWAP by 9:45 AM. The median first breach came on the 9:35 AM bar, the second bar of the day. The latest first breach was the 9:45 AM bar on ES and the 9:40 AM bar on NQ.
That is the opening rotation doing what it always does. The deviation is computed from a handful of bars, so it is tiny, and any directional bar clears it. After that first breach, price later closed a bar on the other side of VWAP in 48 of 49 sessions on each contract. It came back to within a quarter deviation of the line in 45 of 49 ES sessions (median wait 45 minutes, longest 355 minutes) and 42 of 49 NQ sessions (median wait 50 minutes, longest 180 minutes). Four ES sessions and seven NQ sessions never came back that close.
The First VWAP Touch After the Open Settles
A cleaner test of "VWAP as support" starts once the open has settled. For each session, note which side of VWAP the 10:30 AM bar closed on, then find the first later bar whose range reached the line from that side.
| After 10:30 AM, 49 sessions | ES | NQ |
|---|---|---|
| A later bar touched VWAP | 44 of 49 | 42 of 49 |
| Touched, and the session still closed on the 10:30 AM side | 26 of 44 (59%) | 20 of 42 (48%) |
| Every later bar closed on the 10:30 AM side | 6 of 49 | 9 of 49 |
| Median bar closes switching sides of VWAP per session | 6 | 6 |
In the 49-session study, the touch itself was nearly universal. What came after was close to a coin flip: on ES the original side held into the close 59% of the time, on NQ 48%. So VWAP behaved more like a reference that price keeps revisiting than a floor or a ceiling. A touch tells you price is back at the day's average. It does not tell you which side wins.
That is why the confirmation matters more than the touch. A trader treating VWAP as support needs a reason beyond the line itself: a rejection bar, a higher low against structure, or volume drying up on the test.
Related lesson: Support and resistance
VWAP Trading Strategies and Where They Break
Most strategies built on the VWAP indicator fall into three families. Each has a condition, a confirmation and a clear invalidation, and each fails in a predictable kind of session. None of them is a signal on its own, and none was backtested for profitability in this study.
VWAP Trend Pullback
- Condition. Price has held on one side of VWAP after the open has settled, and the line itself is sloping in that direction.
- Confirmation. Price pulls back toward the line and prints a rejection, such as a higher low above VWAP in an uptrend.
- Invalidation. A bar closes through VWAP and the next bar fails to reclaim it.
- Where it breaks. Balanced, two-sided days. With a median of 6 side switches per session in the 49-session ES and NQ study, many days give no clean trend to pull back into.
VWAP Reclaim or Loss
- Condition. Price has traded on one side of VWAP for a while, then crosses it.
- Confirmation. Price holds the new side for more than a bar or two, and the move through the line comes with rising volume.
- Invalidation. Price falls straight back to the original side.
- Where it breaks. Choppy sessions, where crosses are frequent and cheap. The most active ES session in the sample switched sides 23 times.
Stretch Back to VWAP
- Condition. Price is unusually far from VWAP for that instrument, measured against its own history, not a fixed tick count.
- Confirmation. Momentum stalls: smaller bars, lower volume, a failed push to a new extreme.
- Invalidation. Price makes a new extreme after your entry.
- Where it breaks. Trend days. Investopedia notes that in a strong uptrend price may keep rising without dropping below VWAP, and waiting for a return means missing the move or fading it. In this guide's 49-session study, 6 of 49 ES sessions and 9 of 49 NQ sessions never closed a bar on the other side of VWAP after 10:30 AM.
Each approach works on the kind of day it was built for and gets punished on the other kind. The skill is reading the day type early and accepting that you will sometimes misread it. When you do, the invalidation is what keeps one wrong read from turning into a bad day.
VWAP vs Moving Averages
The VWAP indicator and moving averages both draw a smoothed line through price, but they answer different questions.
| Feature | VWAP | Simple moving average | Exponential moving average |
|---|---|---|---|
| Uses volume | Yes | No | No |
| Lookback | Everything since the session start | Fixed number of bars | Fixed length, recent bars weighted more |
| Resets | Every session (standard version) | Never | Never |
| Lag during the day | Grows as the session goes on | Constant | Constant, smaller than SMA |
| Works on daily charts | Not defined for session VWAP | Yes | Yes |
| Best question it answers | What did the average participant pay today? | Where is the average price over N bars? | Where is recent price heading? |
The lag difference is the one that catches traders out. StockCharts points out that at 12:00 PM, 150 minutes of trading have elapsed, so VWAP compares with a 150-minute moving average. Investopedia adds that late in the day a 1-minute VWAP often resembles a 390-minute moving average. A VWAP that hugged price at 10:00 AM can be sluggish at 3:00 PM.
Which is better, VWAP or EMA? Neither wins outright. VWAP is the better intraday reference for where volume traded. An EMA is the better tool if you want a constant, responsive read across sessions and on daily charts. Many intraday traders use both, VWAP as the session reference and a short EMA for momentum.
Related lesson: Volume weighted moving average
How Professional Traders Use VWAP
Professional traders do use VWAP, though mostly for execution rather than signals. A fund buying a large position wants to avoid pushing price up against itself, so the desk splits the order and measures the result against the day's VWAP. Investopedia gives the example of a fund avoiding buys above VWAP so it does not overpay. VWAP algorithms do the same thing automatically, pacing an order in line with expected volume through the day.
That use explains some of the activity retail traders see around the line. If large participants judge their own fills against VWAP, there is a reason for activity to cluster near it. It does not mean the line predicts direction. In this guide's 49-session ES and NQ study, a VWAP touch after 10:30 AM was followed by a close on the original side only about half the time.
Combining the VWAP Indicator With Other Tools
The VWAP indicator answers one question well: where the average participant's price sits. Other questions need other tools.
- How much room is left? A range measure such as average true range (ATR) turns a distance into context. The median ES regular session in the sample covered 225.0 ticks, so a 33.4-tick separation is a small slice of a normal day.
Related lesson: Average true range
- Is the move real? Volume itself. A push away from VWAP on falling volume is weaker evidence than one on rising volume.
- How unusual is the distance? Standard deviation bands, read with the containment rates from your own market's history.
- Where are the levels that matter? Market structure: the prior day's high, low and settlement, and the overnight high and low.
Which indicator should you use for volume? It depends on the question. VWAP shows the price where volume traded on average. On-balance volume tracks whether volume flows into up bars or down bars over time. Volume profile shows how much volume traded at each price, which is where the value area and the point of control come from. Pairing VWAP with a volume profile is common because they ask related questions in different ways.
No combination here is validated by the 49-session study. It describes where price went relative to VWAP. It does not prove that adding another indicator improves results.
VWAP Risk Management and Stop Placement
Every distance you read off the VWAP indicator turns into money once you trade it. ES and NQ both move in 0.25-point ticks, but an ES tick is worth $12.50 and an NQ tick $5.00. That is why the same tick count means very different things.
Illustrative stop math, using round numbers:
- A 20-tick ES stop risks $250 per contract, about 0.6 times the 33.4-tick median close-to-VWAP distance.
- A 20-tick NQ stop risks $100 per contract, about a tenth of the 215.5-tick NQ median.
The temptation is to park the stop just past VWAP because it looks clean on the chart. On NQ, that stop sits inside ordinary noise far more often than the same idea on ES.
A VWAP-based stop is easier to defend when it sits where your idea is proven wrong, not at a fixed distance from the line. If your trade is "VWAP holds as support," the invalidation is a close through VWAP plus a buffer sized from that instrument's normal bar range. If your trade is a stretch back to VWAP, the invalidation is a new extreme. Size the position from that stop distance, not the other way round.
Related lesson: Risk reward ratio
Targets follow the same logic. In a stretch-back trade, VWAP itself is the natural target, and the return data show that some sessions take hours to get there and some never do.
VWAP in Liquid and Thin Markets
The VWAP indicator is most representative where volume is deep and continuous. In a liquid contract during its main session, thousands of trades feed the average and no single print moves it much.
In thin conditions the line gets less reliable. Overnight hours carried 21.4% of ES trade-date volume and 27.9% of NQ volume in this guide's 49-session study, so a VWAP built mostly from overnight trading rests on a fraction of the day's participation. In a thinly traded contract, a few large prints can drag VWAP to a price few participants actually paid, and bands built on that line inherit the problem. If an instrument trades lightly, treat its VWAP as a rough guide at best.
Related lesson: Volume profile
VWAP Advantages and Limitations
| VWAP advantages | VWAP limitations |
|---|---|
| Objective: same inputs give the same line on any chart using the same convention | Lagging: every input is a past trade, and lag grows through the session |
| Includes volume, which price-only averages ignore | Resets each session, so it is not defined on daily charts |
| Clear benchmark for execution quality | Different reset conventions give very different values on the same day |
| Useful session reference for who is in profit since the open | Strong trend days may never return to the line |
| Bands describe typical distance on your own instrument | One-deviation bands are breached on more than half of 5-minute bars |
Is the VWAP a good indicator? The VWAP indicator is good at one job: reporting the volume-weighted average price since the session start, accurately and objectively. It does not predict direction. Whether it belongs on your chart depends on whether that one job fits your process.
Related lesson: Bollinger bands
Common VWAP Indicator Mistakes
Most VWAP indicator mistakes come from asking the line a question it cannot answer.
- Treating a band touch as a signal. In this guide's 49-session ES and NQ study, the one-deviation band held only 47.0% of ES bars and 46.5% of NQ bars, so touches are routine.
- Calling price "stretched" by a fixed tick count. In the same study, a typical ES close sat 33.4 ticks from VWAP and a typical NQ close 215.5 ticks. Use a share of the session range instead.
- Not knowing the reset convention. On November 4, 2026 the choice between regular session and full Globex VWAP was worth 130.5 ES ticks.
- Fading every trend day back to VWAP. Some sessions never come back.
- Using session VWAP on a daily chart. It resets on every bar there and carries no information.
- Trusting VWAP built on thin volume. A few prints can define the line.
A Five Question VWAP Check
Before acting on the VWAP indicator, answer these five questions. The evidence column comes from this guide's 49-session ES and NQ study.
| Question | What to check | Why it matters |
|---|---|---|
| Which session is my VWAP using? | Regular, full Globex or calendar day | The choice moved ES VWAP by 130.5 ticks on one session |
| How far is price in ticks and dollars? | Distance x tick value | 33.4 ES ticks is $417.50 per contract; 215.5 NQ ticks is $1,077.50 |
| Is that distance unusual? | Distance as a share of the session range | The median close sat 14.9% of the range away on ES and 17.1% on NQ |
| Is a band touch meaningful? | How often bars sit outside that band | Over half of bars closed outside one deviation |
| What proves me wrong? | Stop, size and structure | A touch after 10:30 AM held its side only 59% of the time on ES |
On our accounts every position is intraday and must be closed by 4:45 PM ET, which fits a session VWAP well because the line resets each session anyway. Our trading day runs 6:00 PM to 5:00 PM ET, the same window a full Globex session VWAP uses, so it is worth knowing which convention your chart shows. Funded accounts are simulated, and WealthCharts' Chart Replay is one way to practice reading VWAP on historical sessions before trading it.
VWAP Indicator FAQ
How do you use the VWAP indicator?
Use it as a session reference. Price above VWAP means buyers since the open are in profit on average; price below means sellers are. Combine it with structure and a defined invalidation, because in this guide's 49-session ES and NQ study a touch of the line alone split close to evenly.
Is the VWAP a good indicator?
Yes, for one job: showing the volume-weighted average price since the session start. It is a lagging indicator and does not forecast direction. It suits intraday traders who want an objective reference, not traders looking for entry signals.
Which time frame is best for VWAP?
There is no single best chart interval. The interval only controls how often the line updates, and many day traders use 1-minute or 5-minute charts. The setting that changes the value is the session reset, which was worth 725.3 NQ ticks on November 4, 2026.
Which VWAP indicator is best?
The best version is one whose settings you know. Check the anchor period, the price source (typical price is standard) and how the bands are calculated. A clearly configured standard VWAP beats a complex variant you cannot explain.
What is anchored VWAP?
Anchored VWAP uses the same formula but starts from a bar you choose, such as a swing high or low, a gap or an earnings date. StockCharts notes that, unlike a session VWAP, it is not limited to intraday charts. It shows the average price paid since that event.
What is the 80% rule in volume profile?
The 80% rule says that when price opens outside the prior session's value area, then re-enters and holds for two consecutive 30-minute periods, it has roughly an 80% chance of reaching the other side. The value area is the range holding about 70% of that session's volume, a Market Profile concept. The 80% figure is a traders' rule of thumb, not a measured guarantee.
How do you check VWAP on a chart?
Add the VWAP indicator from your platform's study list, then open its settings to confirm the anchor period and source. Check that the line starts fresh at the session open you expect. For a full check, rebuild the first few bars by hand with typical price x volume.
Which is better, VWAP or EMA?
Neither is better overall, because they answer different questions. VWAP shows where volume traded on average today and resets each session. An EMA gives a constant, responsive read across sessions and on daily charts. Many intraday traders use VWAP as the session reference and an EMA for momentum.
This article is for education only and is not investment advice. Futures trading uses leverage, and losses can exceed what you expect, quickly. The measurements here are historical, based on continuous futures data over 49 sessions with a stated method, and exclude commissions and slippage; past behavior of an indicator does not predict future results. Evaluation and funded trading accounts are simulated, and simulated results differ from live trading.


