


TL;DR: Combine technical and fundamental analysis by giving each a specific job. Fundamental analysis explains why a market could move; technical analysis shows what price is doing and where the idea fails. Use economic releases, supply-and-demand information, and policy expectations to frame scenarios; use price, volume, and market structure to define execution. Write the catalyst, confirmation, invalidation, and risk limit before entering. When the data and price disagree, investigate the mismatch or stand aside instead of forcing one to confirm the other.
The economic release looks bullish, but futures are falling. You can spend the next hour arguing with the chart, or you can recognize that your explanation is incomplete.
Technical and fundamental analysis work better together when neither becomes an excuse to ignore new information. Fundamentals help explain what could matter. Technical conditions help specify what the market is actually doing and where your trade idea would fail.
The goal is a decision process you can follow under pressure, including a clear reason to take no trade.
How technical and fundamental analysis differ
Fundamental analysis asks why a market could move. It studies the forces behind value or supply and demand, such as economic data, policy expectations, earnings, and inventories.
Technical analysis asks what the market is doing right now. It studies price, volume, and structure to time entries and define where a trade idea stops working.
| Aspect | Fundamental analysis | Technical analysis |
|---|---|---|
| Core question | Why could this market move? | What is price doing, and where does the idea fail? |
| Main inputs | Economic releases, policy expectations, earnings, supply and demand data | Price, volume, ranges, trend structure, chart levels |
| Futures examples | Inflation and jobs data for index futures; inventories and production for energy | Prior-session highs and lows, pre-release ranges, volume participation |
| Natural horizon | Days to months; changes slowly | Minutes to days; updates with every bar |
| Main strength | Explains which events matter and why a move could last | Gives specific entry, stop, and invalidation levels |
| Main limitation | Rarely says when to enter; news may already be priced in | Signals can fail, and patterns often look clearer in hindsight |
Traders often frame this as a debate between two competing schools of thought. Fundamental analysts argue that price eventually reflects intrinsic value, dismissing short-term chart patterns as noise. Technical analysts counter that fundamentals are often priced in ahead of time, and that price patterns reveal shifts in supply-demand dynamics before they appear in earnings or economic data.
Each side makes valid points: fundamental analysis excels at identifying what could move a market over weeks or months, while technical analysis specifies when to act and where the idea fails. The most effective approach uses fundamentals to frame scenarios and technicals to time execution - neither needs to "win" the debate.
Traders often argue for one camp over the other. Long-term investors tend to lean on fundamentals because they can hold through short-term noise, while short-term traders lean on charts because they need precise timing.
For intraday futures, each method covers a blind spot in the other. That is why the sections below give them separate jobs instead of picking a winner.
Give technical and fundamental analysis separate jobs
Fundamental analysis examines the forces affecting an asset's value or a contract's supply and demand. Technical analysis studies market-generated information such as price and volume. CME Group's comparison frames these approaches specifically for futures traders.
For an equity-index future, your fundamental context may include inflation, employment, interest-rate expectations, and corporate earnings. For an energy contract, inventories, production, weather, and consumption can matter more directly.
Your technical process might examine prior-session levels, a defined range, trend structure, or volume participation. Choose the tools because they answer an execution question, not because adding another indicator makes the thesis feel stronger. Common technical tools include chart patterns (like triangles and flags), indicators (such as moving averages and RSI), trend lines, and volume analysis. Each serves a specific purpose: moving averages smooth price to show direction, RSI measures momentum strength, and volume confirms the conviction behind price moves.
A useful division is context, trigger, and failure condition. You should be able to write all three separately.
Match the analysis to the time you intend to hold
An intraday futures trade and a position held across several sessions need different evidence. For the intraday plan, identify today's scheduled catalyst, the release-time risk, and the price condition that must occur inside your trading window. A longer-term economic view does not justify keeping a failed intraday trade open.
For a multiday research plan, consider the sequence of upcoming reports and whether the thesis can survive changing policy expectations. Define the higher-timeframe invalidation first, then assess the capital and overnight permissions needed to hold it. If your account requires positions to close each session, the longer thesis remains context for separate intraday setups.
Keep a short record with four fields: fundamental observation, market interpretation, technical trigger, and expiration of the idea. For example, a release-based setup may expire at your morning cutoff even if the broader economic argument remains plausible. That prevents a missed short-term trade from quietly becoming an unplanned long-term position.
Build fundamental scenarios before the release

Start with the event calendar. The Bureau of Labor Statistics release schedule lists official release times for its data. Other releases require their own issuing agency or exchange source.
Record the consensus expectation from your chosen data provider, the prior reading, and the specific components you intend to watch. A headline surprise can be offset by revisions or details beneath it.
Then outline a small set of scenarios:
- Data materially stronger than expected.
- Data close to expectations.
- Data materially weaker than expected.
Do not assign a guaranteed price direction to each scenario. Stronger growth can support earnings expectations while also increasing concern about tighter policy. Which interpretation dominates depends on the market's current focus.
Write what additional evidence would help distinguish those interpretations. That might include the initial response in related futures, the persistence of the move, or whether price holds a previously defined level.
Turn technical analysis into testable conditions
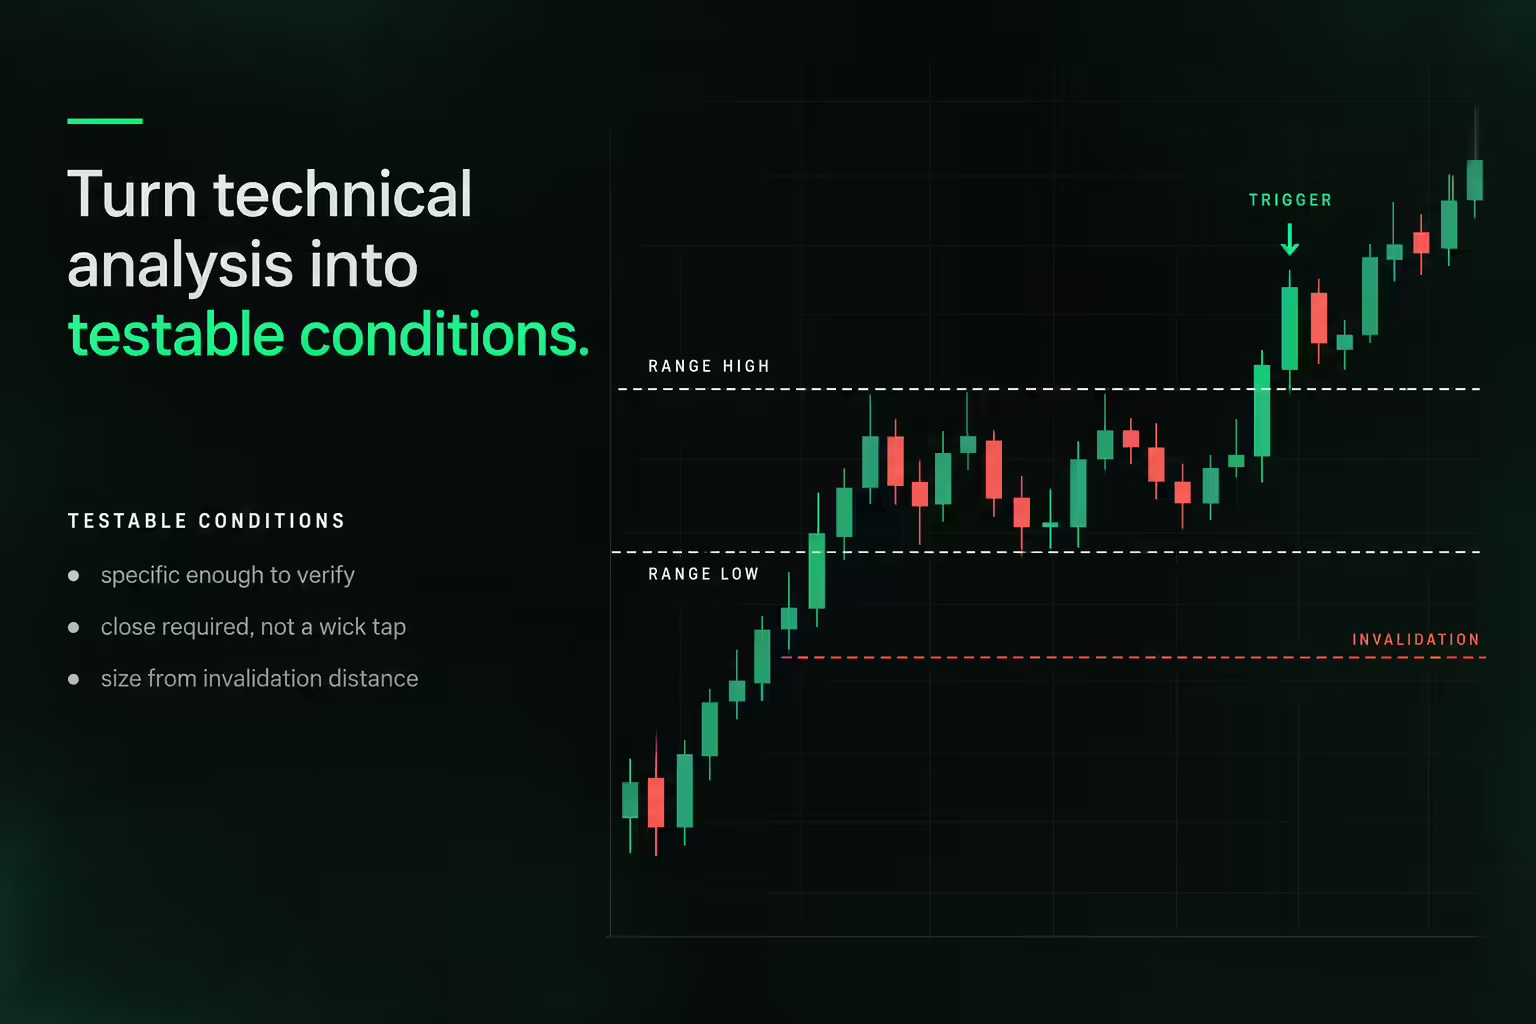
A technical condition should be specific enough that two people using the same data could reach the same conclusion about whether it occurred.
"Price looks strong" is difficult to test. "Price closes above the pre-release range, pulls back without closing below its lower boundary, and then breaks the pullback high" is much more precise.
That example is a hypothetical rule to test, not a proven profitable setup. You still need to define the chart interval, allowable spread, entry order, stop, target, and maximum acceptable risk.
Avoid changing those definitions while the candle is forming. If your original condition required a close, a brief trade through the level does not satisfy it.
The invalidation should describe why the setup no longer holds. Place size around the distance to that invalidation, rather than moving the invalidation to accommodate the size you wanted.
Combine both analyses in a hypothetical futures session

Imagine a scheduled report comes in weaker than expected. Your initial scenario is that lower policy-rate expectations could support equity-index futures. That is a hypothesis, not permission to buy immediately.
You mark the pre-release range before the announcement. After the report, price spikes higher, returns into the range, and fails to hold the breakout.
Your bullish technical confirmation never arrives. There is no long entry under the planned rules, even if your macro explanation still sounds reasonable.
Now consider the alternative path. Price breaks above the range, holds the pullback, and forms your defined trigger. You check the stop distance, event restrictions, costs, and remaining loss budget. Only then is there a trade to consider.
If the required stop is too wide for your risk allowance, the decision is still to pass. Agreement between two forms of analysis does not make position size irrelevant.
Handle conflicting technical and fundamental evidence
Disagreement can be useful because it exposes an assumption. Ask whether the information was already priced in, whether another component mattered more, or whether the move is too early to interpret confidently.
Do not respond by adding more indicators until one agrees. That changes the process into a search for permission.
Instead, define what would resolve the conflict. For example, you might require a sustained reclaim of the event range before reconsidering a bullish view. Until that happens, your view stays unconfirmed.
Sometimes the right conclusion is that you cannot explain the move well enough to trade it. Missing a session costs less than inventing certainty in a leveraged position.
Review technical and fundamental decisions separately
Your journal should distinguish the quality of the scenario from the quality of execution. A reasonable macro thesis can lose money because the entry was late. A poorly reasoned trade can make money by chance.
Record the information available before entry, the condition that triggered the trade, the planned invalidation, and any rule you changed. Include costs and slippage when evaluating the result.
Over time, compare similar events rather than mixing every trade into one story. You may find that a particular type of release changes volatility more reliably than direction, or that waiting for confirmation improves execution while reducing the number of trades.
Those are hypotheses to test across a meaningful sample. One memorable winner is not enough.
Use one combined analysis checklist
Before your next practice session, write five short answers: what matters today, what outcomes are plausible, what price behavior confirms the setup, what invalidates it, and what you can afford to risk.
If one answer is missing, finish the plan before entering. Technical and fundamental analysis should make the decision clearer, including when to wait. Neither removes the risk of loss in futures trading.
Frequently Asked Questions
What is technical and fundamental analysis?
Fundamental analysis studies the forces that affect an asset's value or a contract's supply and demand, such as economic data, policy, earnings, and inventories. Technical analysis studies market-generated information such as price, volume, and chart structure. Used together, fundamentals frame what could matter and technical conditions define when to act and where the idea fails.
Is technical or fundamental analysis better for day trading?
Day traders usually rely more on technical analysis because entries, stops, and exits happen within minutes or hours. Fundamentals still matter on days with scheduled releases, because the data can change volatility and direction. A practical approach uses fundamentals for context and technical rules for execution.
Does Warren Buffett use technical or fundamental analysis?
Warren Buffett is widely known as a fundamental, value-focused investor who studies businesses rather than price charts. His holding periods are measured in years, which suits fundamental analysis. Short-term futures traders work on a very different timeframe, so they usually need technical rules for timing as well.
What are the top 5 technical analysis indicators?
Commonly cited indicators include moving averages, the relative strength index (RSI), MACD, volume, and Bollinger Bands. No indicator works on its own, and adding more rarely improves a plan. Pick tools because they answer a specific execution question, then test the rule before trading it.