


TL;DR: An expected move calculator estimates the size of a possible price move over a defined period. A common approximation is price × annualized implied volatility × √time in years. At a hypothetical price of 6,000, 20% IV, and seven calendar days, that gives roughly 166 points in either direction, versus about 63 points over one day and 344 over 30 days. The result is a model-based range, not a price target, a stop-loss level, or a promise that price will remain inside it.
You have a profit target in mind. The question is whether it fits the time available and the movement the options market is pricing.
An expected move calculator gives that question a numerical starting point. It does not tell you which direction to trade, and two calculators can produce different answers without either being broken. They may use different volatility inputs, expirations, or methods.
Before relying on the output, make sure you understand what went into it.
Expected move calculator
Enter a reference price, annualized implied volatility as a percentage, the number of days to your horizon, and the day-count basis. The calculator returns the one-standard-deviation move, the implied low and high levels, the move as a percentage of price, a two-standard-deviation range, and, if you add a point value, the dollar size of the move per contract.
What an expected move calculator measures

Expected move usually refers to an estimate of price dispersion over a selected horizon. In a common simplified model, it approximates a one-standard-deviation move using implied volatility.
That phrase is easy to overread. A one-standard-deviation range has a familiar interpretation under a normal-distribution model, but actual market returns can be skewed, have heavy tails, and jump around events. The model’s statistical convention is not a guaranteed containment rate for tomorrow’s session.
The estimate also concerns the selected horizon. A range associated with an options expiration is not automatically the same thing as the highest and lowest prices that will trade before expiration.
Price could leave the range during the period and finish inside it. That distinction matters when you are managing a stop intraday.
Inputs for an expected move calculation
For the basic IV method, gather three inputs:
- The current reference price.
- Annualized implied volatility expressed as a decimal.
- Time to the selected endpoint, expressed in years.
Use volatility that corresponds to the relevant underlying and horizon. A volatility measure for one index is not a direct substitute for another contract’s options IV.
Time conventions also need to match. Calendar-day and trading-day calculations are both encountered in practice. If you divide by 365, use calendar days. If your source annualizes using trading days, keep the matching convention instead of mixing inputs.
Write the method beside the result in your own worksheet. A range without its assumptions is difficult to compare or reproduce.
Calculate an expected move step by step
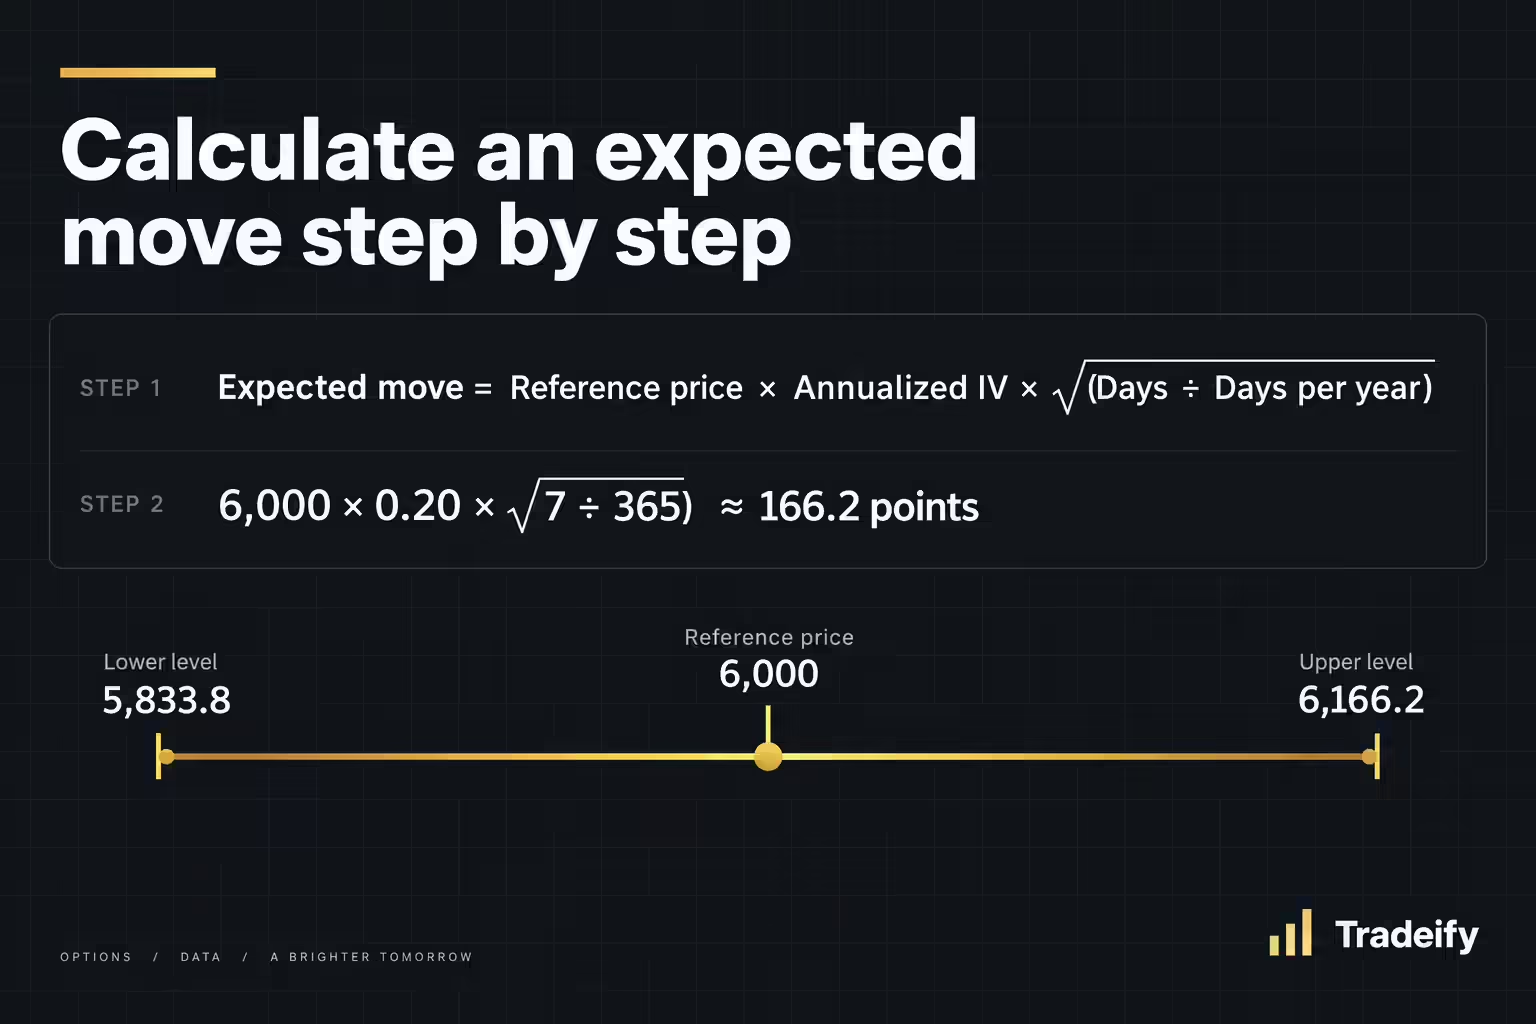
The simplified formula is:
Expected move = Reference price × Annualized IV × √(Days ÷ Days per year)
Here is a hypothetical calendar-day example:
- Reference price is 6,000.
- Annualized IV is 20%, entered as 0.20.
- The horizon is seven calendar days.
- Time is 7 ÷ 365, or approximately 0.01918 years.
- The square root of time is approximately 0.13848.
- The estimate is 6,000 × 0.20 × 0.13848, or approximately 166.2 points.
The illustrative lower and upper levels are therefore about 5,833.8 and 6,166.2. The percentage move is approximately 2.77%.
The calculator above uses the same inputs by default. You can also reproduce the arithmetic in a spreadsheet with =6000*0.20*SQRT(7/365). Replace the constants with your own cells, while keeping percentages and time units consistent.
This approximation ignores several features of full option-pricing models. It is a practical estimate, not a complete distribution of future prices.
Set up reusable expected-move inputs
In a spreadsheet, put reference price in B2, annualized IV in B3 as a percentage, calendar days in B4, and 365 in B5. Calculate the move in B6 with =B2*B3*SQRT(B4/B5). Use =B2-B6 for the lower level, =B2+B6 for the upper level, and =B6/B2 for the percentage move.
With price fixed at 6,000 and IV fixed at 20%, the illustrative move is about 62.8 points over one calendar day, 166.2 over seven days, and 344.0 over thirty days. Seven times the horizon does not produce seven times the range because the approximation scales with the square root of time: holding price and IV constant, a seven-day move is about √7, or 2.65 times, the one-day move. Real expirations can have different IVs, so this comparison holds IV constant only to demonstrate that relationship.
Expected move also differs from average true range. ATR summarizes historical trading ranges under its selected lookback; an options-based expected move uses current options pricing or implied volatility. Neither value is automatically an appropriate stop distance. Use the one that answers your question and label the horizon.
Expected move by implied volatility and time
The table below applies the same formula to a hypothetical reference price of 6,000 on a 365-day basis. Each cell shows the one-standard-deviation move in points and as a percentage of price.
| Annualized IV | 1 calendar day | 7 calendar days | 30 calendar days |
|---|---|---|---|
| 15% | ±47.1 (0.79%) | ±124.6 (2.08%) | ±258.0 (4.30%) |
| 20% | ±62.8 (1.05%) | ±166.2 (2.77%) | ±344.0 (5.73%) |
| 30% | ±94.2 (1.57%) | ±249.3 (4.15%) | ±516.0 (8.60%) |
| 40% | ±125.6 (2.09%) | ±332.4 (5.54%) | ±688.1 (11.47%) |
Doubling IV doubles the range, but doubling time does not. Because the move scales with the square root of time, the estimated range narrows as an expiration approaches even when IV stays flat.
IV itself rarely stays flat around scheduled releases. It can rise into an event and drop after it, so an expected move taken the day before a release may not match the one taken the day after, even for the same expiration.
Why expected move calculators disagree
Some tools infer a range from options premiums rather than applying the simple IV formula. tastylive’s expected-move explanation describes an event-focused approximation based on 85% of an at-the-money straddle’s value. It explicitly discusses that approach near a binary event or expiration.
For a hypothetical at-the-money call priced at 12 and put priced at 10, the straddle costs 22. Multiplying by 0.85 gives 18.7 price units. That does not mean every calculator should use 18.7, or that the method is interchangeable with an IV estimate over several weeks.
Other differences can come from stale quotes, wide bid-ask spreads, the selected strike, and the exact expiration time. Even the choice between midpoint and executable prices can matter.
Compare methods using identical inputs before deciding one is more accurate. Then evaluate how each estimate behaved out of sample for the purpose you actually need.
Use expected move with a futures trade plan
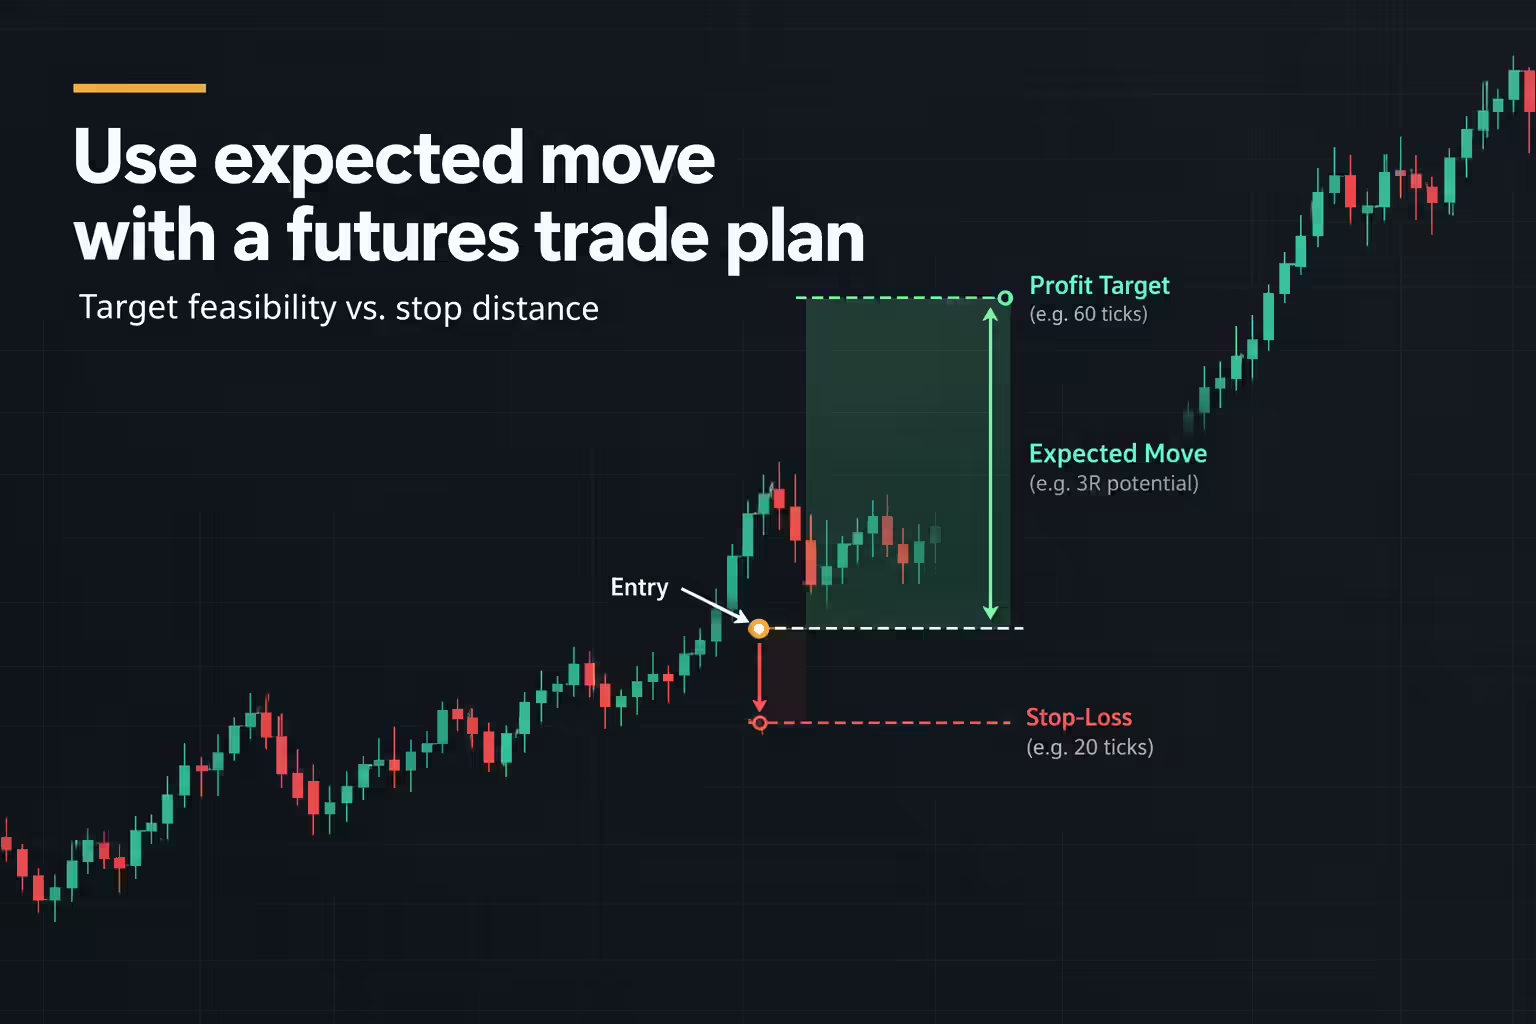
For a futures trader, an options-derived range can help frame whether a proposed target is modest or ambitious relative to the selected horizon. It should sit beside market structure, liquidity, and scheduled events.
If your target lies well beyond the estimated daily range, ask what would support an unusually large session. If your setup has only a small amount of room before a major level, a broad weekly range does not solve that execution problem.
Be careful transferring levels between an index, an ETF, and a futures contract. They have different prices, contract specifications, and potentially different settlement conventions. Similar exposure is not identical arithmetic.
The dollar risk of a futures position comes from the distance to its stop, the contract’s point value, and the number of contracts, with costs and slippage added. The expected-move range does not replace that calculation.
Expected move errors to avoid
Do not enter 20 where the formula expects 0.20. Do not use seven days in one input and one day in another. Do not apply an equity-options range to a futures price without checking the mapping.
Avoid the assumption that reaching an expected-move boundary creates a reversal signal. A boundary is a model output. Price can continue past it, particularly after new information changes volatility expectations.
Also avoid moving a stop farther away simply because the expected range is wide. If the setup requires more risk than your account can support, reduce size or skip it.
Check an expected move before using it
Save the underlying, timestamp, expiration, IV source, day-count convention, and formula. Record the estimated range before the outcome is known.
Later, distinguish whether you are testing expiration containment, intraperiod excursions, or target feasibility. Those are different questions and require different comparisons.
Start with one market and one horizon. A reproducible estimate with clear limits is more useful than an impressive-looking range whose assumptions you cannot explain.
Frequently asked questions
How do you calculate the expected move?
Multiply the reference price by annualized implied volatility and by the square root of time in years. At a price of 6,000, 20% IV, and seven calendar days, that is 6,000 × 0.20 × √(7 ÷ 365), or about 166.2 points in either direction. Some tools instead approximate the move from the price of an at-the-money straddle.
How accurate is the expected move?
It is a model estimate, not a forecast. Under a normal-distribution model, a one-standard-deviation range would contain the ending price about 68% of the time, but real returns can be skewed, jump around events, and have heavier tails. The only reliable way to judge accuracy for your use is to record estimates before the outcome and compare them later.
How much IV is considered high?
There is no single threshold that applies to every market. A reading that is normal for one contract can be elevated for another, so compare current IV with the same market’s own recent history and with the specific horizon you are trading.
Is expected move the same as average true range?
No. Average true range summarizes historical trading ranges over a chosen lookback, while an options-based expected move uses current implied volatility or option prices. Neither value is automatically a suitable stop distance, so label the horizon and use the one that answers your question.