


TL;DR: VWAP standard deviation bands place upper and lower levels around volume-weighted average price using a selected dispersion calculation and multiplier. They can help describe how far price has moved from the session’s average, but a touch of the second band is not an automatic reversal or a guaranteed 95% boundary. Check the anchor, session, price source, and platform formula. Test trend-continuation and mean-reversion rules separately, with defined invalidation and realistic costs.
Price reaches the second upper VWAP band. It looks stretched, so you short it. Then the market keeps walking higher while the band moves with it.
The mistake is treating distance from an average as proof that price must reverse. VWAP standard deviation bands describe a relationship in the data. Whether that relationship supports a trade depends on the market condition and the rules you have tested.
Start by understanding the calculation. Then decide what evidence would make a band touch useful.
What VWAP standard deviation bands measure
VWAP weights price by traded volume over a defined anchor period. A common bar-based calculation multiplies each bar’s source price by its volume, sums those values, and divides by cumulative volume.
Bands add and subtract a multiple of a dispersion measure from VWAP. The general form is VWAP plus or minus k times the selected standard deviation.
TradingView’s VWAP documentation describes its source, anchor, band modes, and multipliers. Other platforms can implement the dispersion calculation differently. Do not assume matching labels guarantee identical values.
In particular, a volume-weighted deviation of source prices around VWAP is not necessarily identical to a standard deviation calculated from a sequence of VWAP values. Review the actual implementation when precise matching matters.
Work through a volume-weighted band calculation
One possible implementation calculates weighted variance as the sum of volume × (source price − VWAP)² divided by total volume, then takes its square root. This is an illustrative population-style calculation; confirm your platform’s method before expecting identical bands.
Suppose three observations have prices of 100, 101, and 102, with volumes of 100, 200, and 100. VWAP is (100×100 + 101×200 + 102×100) ÷ 400 = 101. The weighted variance is (100×1 + 200×0 + 100×1) ÷ 400 = 0.5. Its square root is approximately 0.7071.
The one-deviation bands are therefore about 100.2929 and 101.7071; the two-deviation bands are 99.5858 and 102.4142. This demonstrates the arithmetic only. A tiny sample does not establish the probability of a future price staying inside either band.
During the first observations after an anchor reset, the estimate has little history and can change quickly. Define a minimum observation period for testing instead of treating the first narrow bands as reliable support and resistance.
Set the VWAP anchor and session deliberately
A session anchor resets at the selected session boundary. A weekly or manually anchored calculation includes a different set of observations.
For futures, confirm whether the calculation includes the overnight session, the regular trading session, or a custom window. Two traders can look at the same contract and see different VWAP levels because their sessions differ.
Also check the source price. Typical price, close, and other inputs can produce different results. Chart interval and data quality can affect a bar-based approximation as well.
Save these settings with your strategy. If a setup depends on a precise band level, changing the session or source changes the strategy’s inputs.
Read first and second VWAP bands
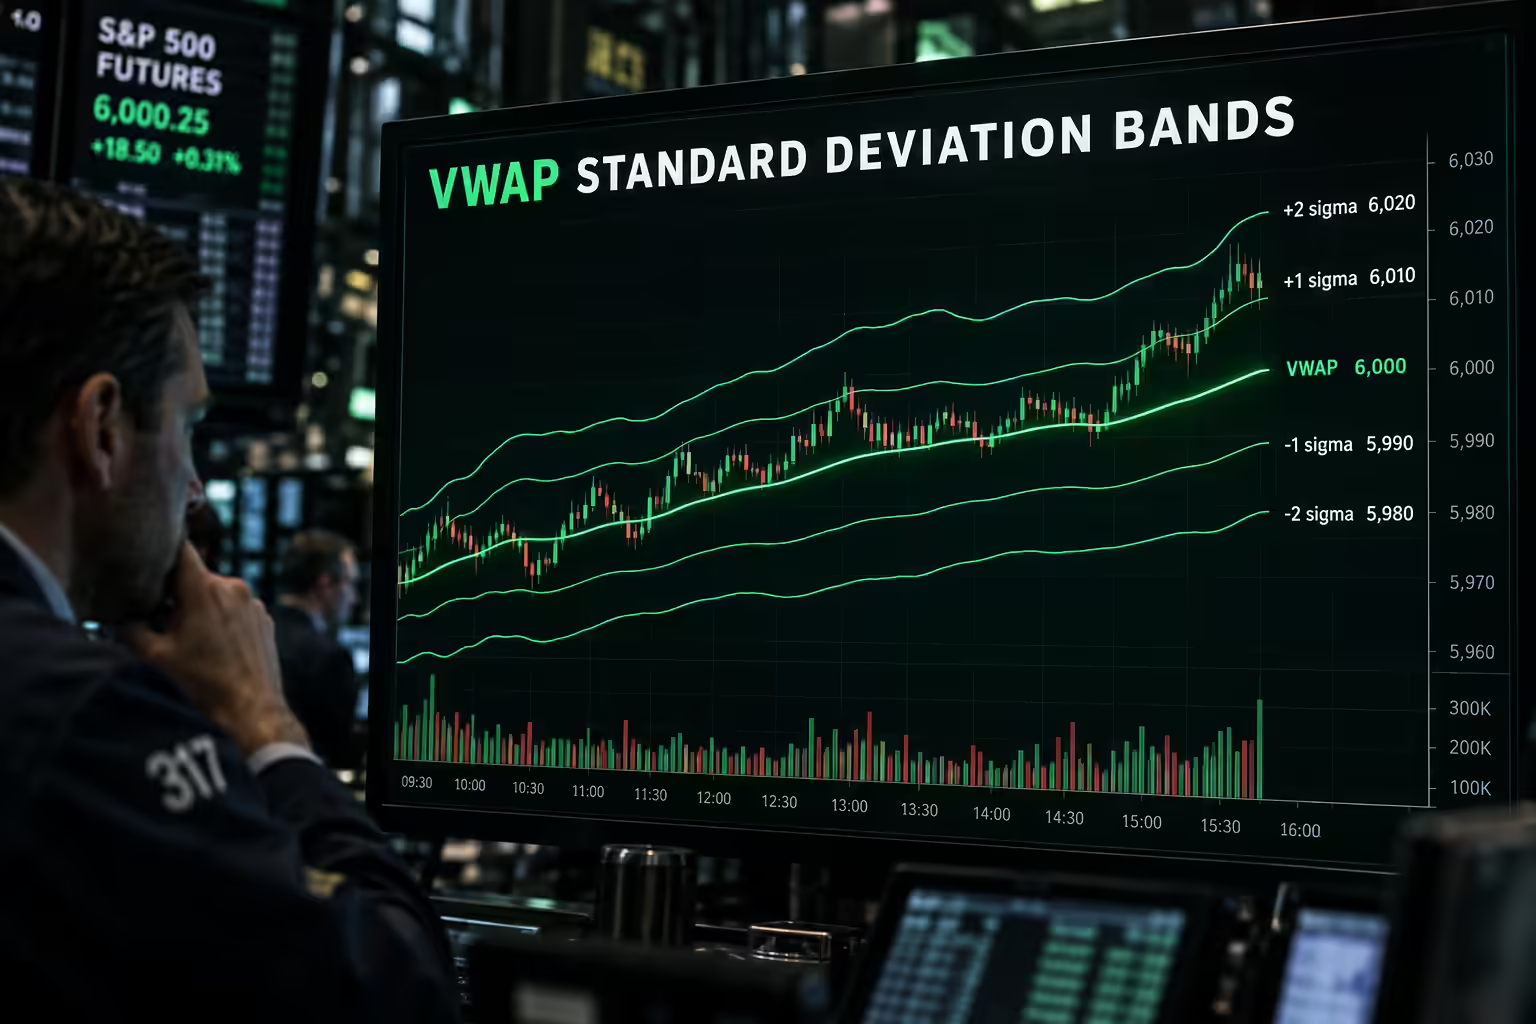
Suppose a hypothetical chart reports VWAP at 6,000 and the selected deviation measure at 10 points. A one-deviation band is at 6,010 and 5,990. A two-deviation band is at 6,020 and 5,980.
Those numbers describe distance under the chosen calculation. They do not tell you that 6,020 is expensive in an absolute sense, or that selling there has positive expectancy.
The familiar 68% and 95% normal-distribution percentages should not be treated as guaranteed containment rates for an evolving intraday price path. Prices are dependent, the calculation updates, and the distribution need not be normal.
Measure the behavior you care about directly. If your rule expects a return to VWAP after a band touch, test that event, its timing, and its adverse movement rather than borrowing an unrelated statistical percentage.
Separate trending and balanced VWAP conditions
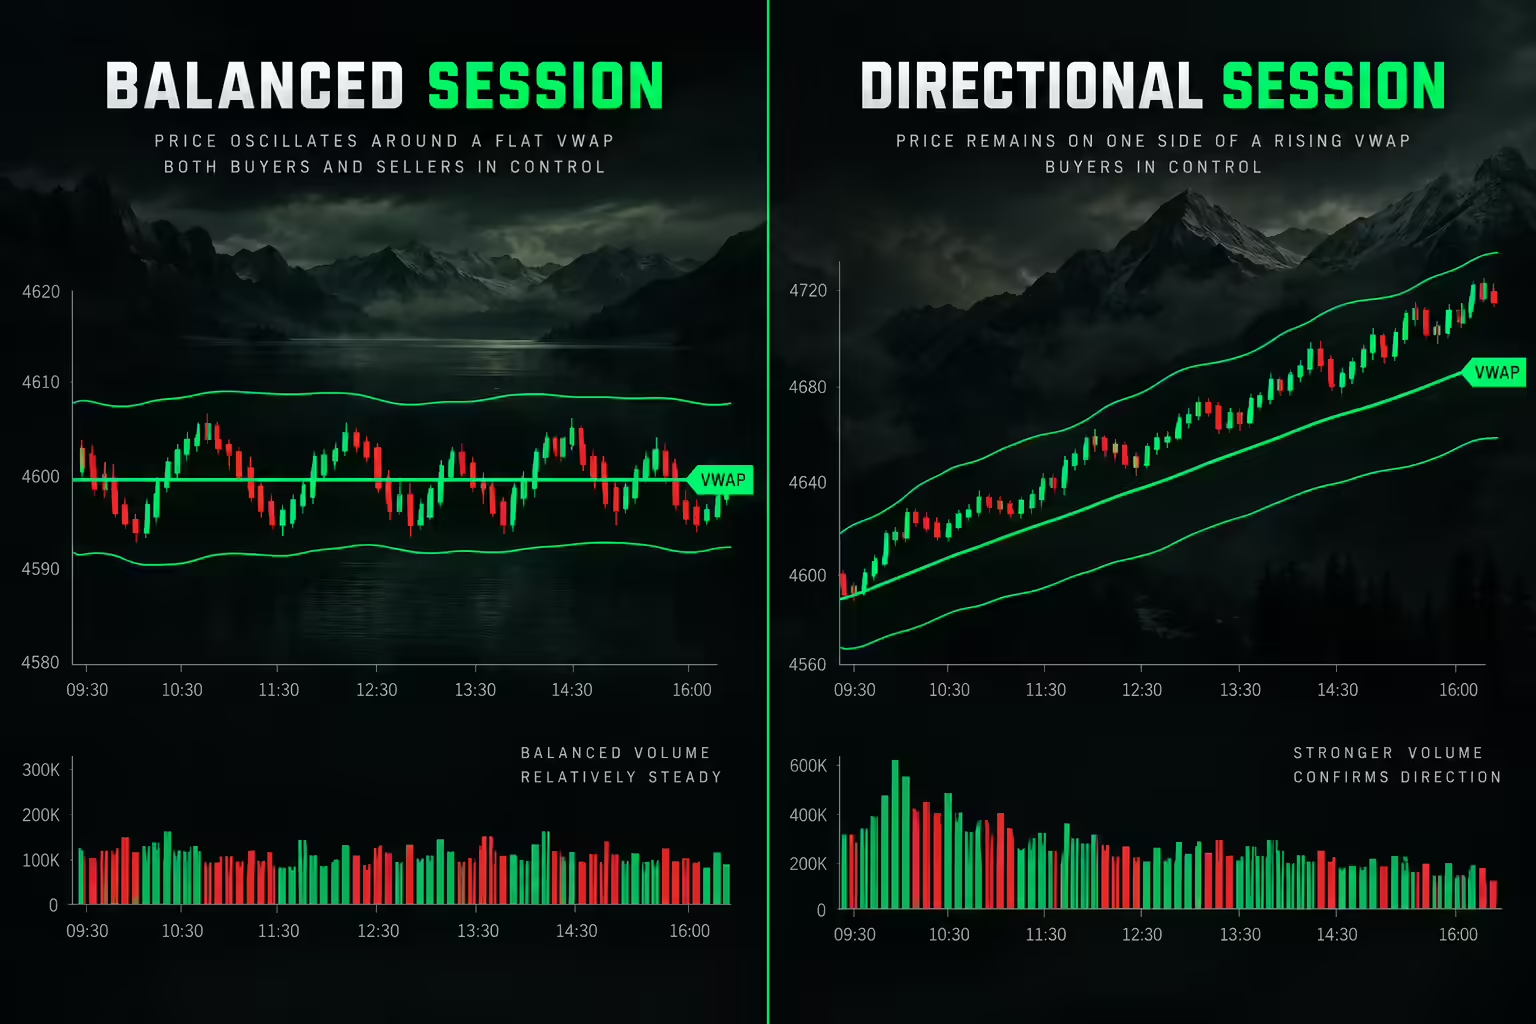
In a balanced session, repeated crossings around a relatively flat VWAP may suggest two-sided trade. In a directional session, price may remain on one side while VWAP and its bands slope.
These are descriptions, not proven entry signals. Define them quantitatively enough to test if you intend to use them as filters.
A mean-reversion idea might require rejection outside a band followed by a close back inside a defined range. A continuation idea might require a pullback that holds above VWAP in an already established trend.
Do not combine the two casually. Fading a trend and buying a pullback are different hypotheses with different failure conditions.
Fade or follow VWAP bands by market condition
The same band touch can call for opposite trades depending on the session. The table below turns the two readings above into hypotheses to test, not rules that are known to work.
| Read | Balanced session | Trending session |
|---|---|---|
| VWAP slope | Relatively flat | Rising or falling |
| Price versus VWAP | Repeated crossings | Holds mostly on one side |
| Outer band behavior | Excursions may fail back inside the bands | Price can walk along the first or second band |
| Hypothesis to test | Fade an outer-band rejection back toward VWAP | Enter a pullback toward VWAP or the first band |
| Invalidation idea | Beyond the excursion extreme | A sustained close through VWAP against the trend |
| Common failure | Fading the first bars of a new trend | Buying a pullback after price has already reversed through VWAP |
Traders often describe VWAP as a magnet because price in a balanced session may keep returning to it. That pull describes past crossings; it is not a force. In a trending session, price can stay away from VWAP for hours, and a fade that waits for the return can keep losing ticks.
If you cannot classify the session with a rule written in advance, treat that as a reason to stand aside rather than a reason to pick whichever setup fits the last few bars.
Write a VWAP band setup before testing
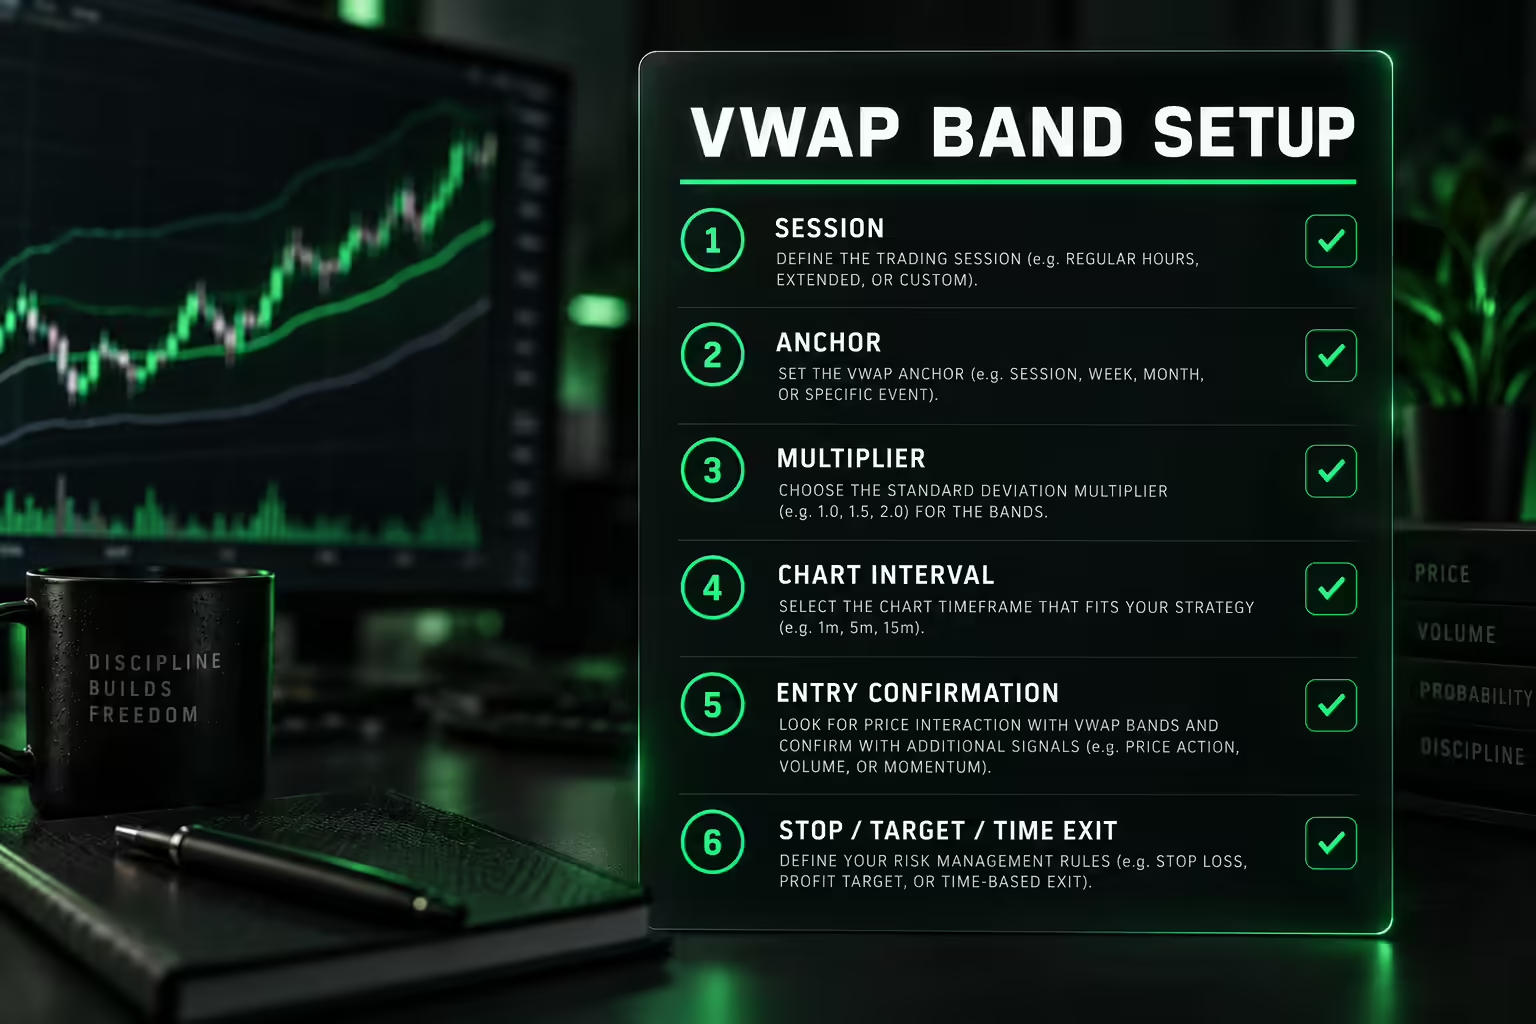
A testable rule needs more than “buy the lower band.” Specify the session, anchor, multiplier, chart interval, entry confirmation, stop, target, and time exit.
For a hypothetical rejection setup, you might require a completed bar to return inside the outer band after an excursion, then use a separately defined trigger. Invalidation could be tied to the excursion extreme, with position size based on the resulting risk.
That example is a format for research, not a recommended profitable strategy. Test whether the confirmation improves outcomes after costs and whether it causes entries to arrive too late.
If the required stop consumes too much account risk, reduce size or skip the setup. A band’s location does not override the account’s available loss buffer.
Compare VWAP bands with Bollinger Bands
Both tools display bands around an average, but their inputs and lookbacks differ. A conventional Bollinger calculation uses a moving average and a rolling standard deviation of price. VWAP incorporates volume and typically follows an anchor or session definition.
That difference changes how older observations leave the calculation. A rolling window drops them as it advances, while an anchored calculation can continue accumulating observations until the next reset.
Neither design is automatically better. Choose the tool that matches the question, then test it without switching methods after seeing which one fits the latest chart.
TrendSpider’s VWAP band documentation provides another platform-specific reference for checking settings and implementation.
Avoid VWAP band testing errors
Use indicator values available at the moment of entry. Do not read the completed session’s levels backward into earlier trades.
Account for how the bands move while a trade is open. A target defined as the current VWAP may move, while a target fixed at entry does not. Those rules produce different trades.
Include spread, commissions, and slippage. A small mean-reversion edge can disappear when fills are less favorable than the chart suggests.
Review news sessions separately if the strategy is sensitive to sudden changes in price or volume. An ordinary-day pattern may behave differently during a major release.
Treat thin-volume periods the same way. When few contracts trade, price can stretch far from VWAP on little participation, so a band touch overnight or during a quiet midday stretch may not behave like the same touch in the regular session. Test those hours as their own sample.
Make VWAP bands part of a repeatable review
Save one chart template with fixed settings. Label each observed setup by market condition, trigger, invalidation, and outcome after costs.
Then ask whether the bands add information beyond the price structure you already use. Keep them only if they improve a decision you can explain.
A clean chart is useful. A tested reason for acting on it is more useful still.
Frequently asked questions
What is a VWAP deviation?
A VWAP deviation is the distance between price and VWAP measured in units of the selected dispersion calculation. If VWAP is 6,000 and one deviation is 10 points, price at 6,020 sits two deviations above VWAP. The exact value depends on the platform’s formula, anchor, and source price.
Is VWAP like Bollinger Bands?
They look similar because both plot bands around an average, but the inputs differ. Bollinger Bands use a moving average and a rolling standard deviation of price. VWAP bands weight price by volume and usually accumulate from an anchor or session start until the next reset.
Which VWAP setting is best?
No single setting is best for every market. Choose the anchor, session, source price, and multipliers that match the question you are testing, then keep them fixed while you collect results. Changing settings after seeing the chart makes past results hard to trust.
What do the upper and lower bands represent on a VWAP plot?
The upper and lower bands mark VWAP plus and minus a multiple of the selected deviation measure, often one and two deviations. They describe how far price has moved from the volume-weighted average. They are not guaranteed support, resistance, or containment levels.
Should you fade the second VWAP band?
A second-band touch can be a mean-reversion candidate in a balanced session, but in a trending session price can keep moving along the band. Test any fade with a defined confirmation, invalidation beyond the excursion extreme, and realistic costs before trading it.