



TL;DR: Algorithmic trading means a written rule decides entry, size, stop and exit, so the rule can be tested before money is at risk. One breakout algorithm run on 20 years of ES and NQ daily bars was positive on NQ after costs and indistinguishable from zero on ES. Costs, a handful of outsized winners and position sizing decided the result more than the signal did.
Algorithmic trading sounds like the fix for every human weakness in trading. No hesitation on the entry, no revenge trade after a stop, no doubling size after two losers. That part is real.
What gets left out is the arithmetic. An algorithm executes a rule perfectly, including a rule with no edge, and it will do it for years without complaining. This guide covers what algorithmic trading is, the main strategy families, the advantages and disadvantages, and how to start. It also runs one fully written rule on 20 years of E-mini S&P 500 (ES) and E-mini Nasdaq-100 (NQ) futures data, so you can see what a test looks like when it reports the bad news as well as the good.
What Is Algorithmic Trading
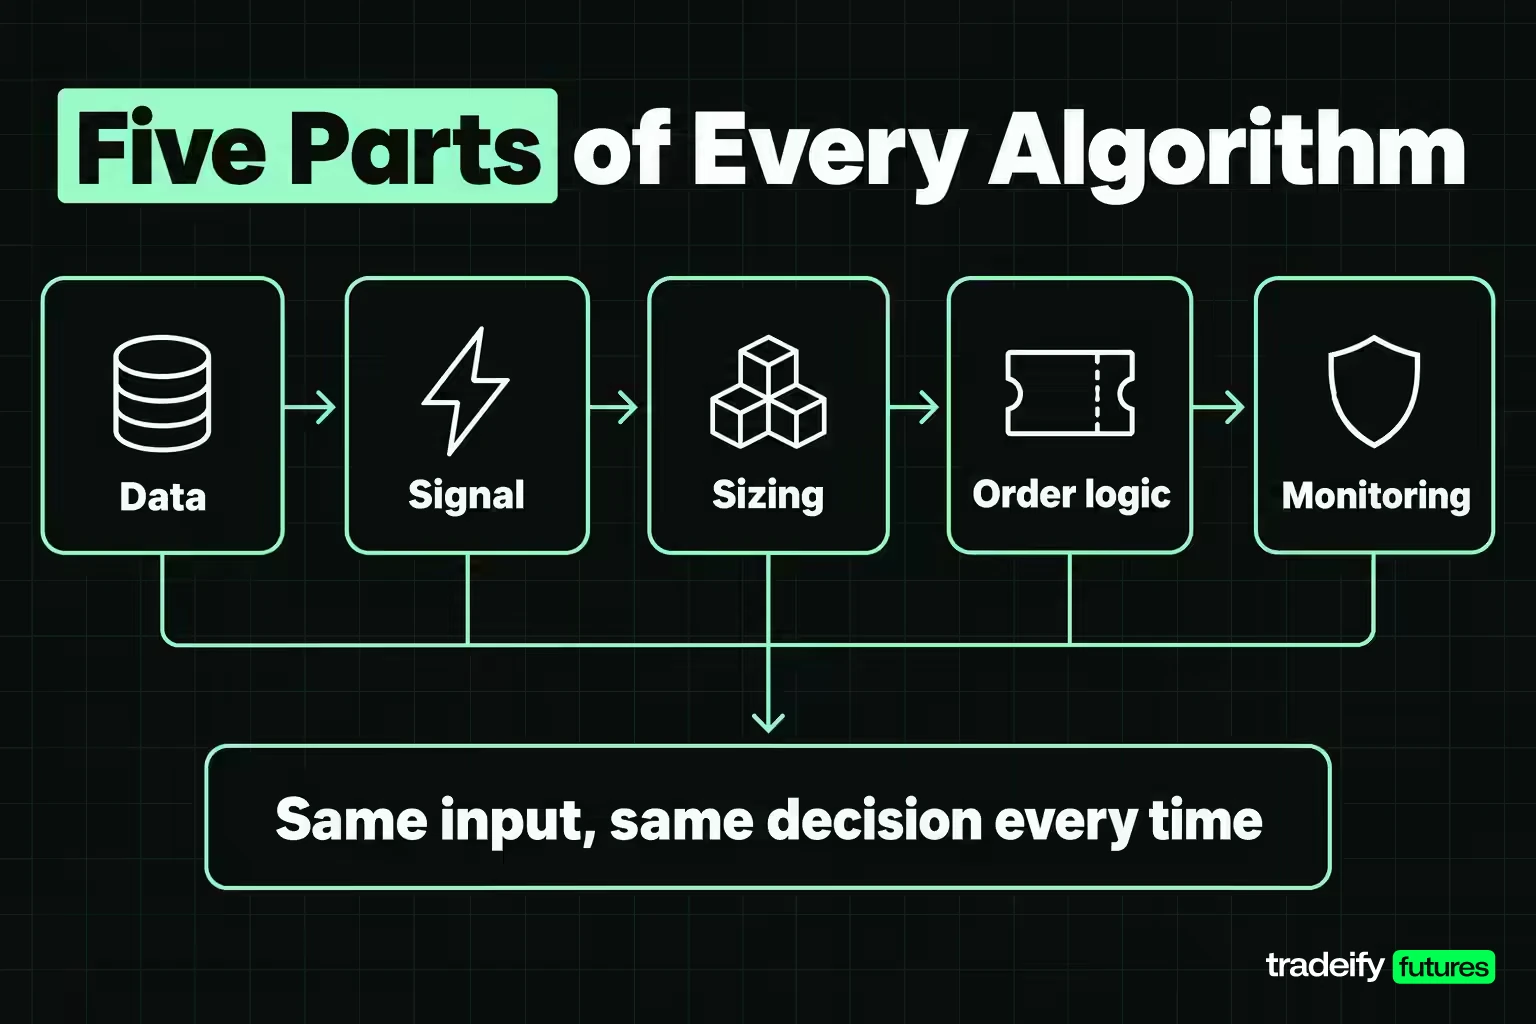
Algorithmic trading is trading where a predefined set of instructions, rather than a judgment call in the moment, decides when to enter, how much to trade, where the stop sits and when to exit. Given the same input, the algorithm makes the same decision every time.
Most algorithms, from a hobbyist's spreadsheet rule to an institutional execution desk, have the same five parts.
- Data. Prices, volume, order book or news, at a defined frequency such as ticks, minutes or daily bars.
- Signal. The condition that says trade now, such as a close above a recent high.
- Sizing. How many contracts or shares, often derived from the distance to the stop.
- Order logic. Which order type is sent, where, and how a partial fill or a gap is handled.
- Monitoring. Loss limits, order-count limits and a kill switch that sit outside the signal code.
In the stock market, algorithmic trading usually means one of two jobs. Institutions use execution algorithms to split a large order into small pieces so it moves the price less. Traders use signal algorithms to decide what to buy or sell. Futures, forex and crypto markets use both in the same way.
Automation moves the difficulty rather than removing it. It deletes the hesitation and the impulsive size increase. It adds a failure that discretionary traders rarely face, which is a broken rule running at machine speed with nobody watching.
The market-level evidence is mixed in the same way. A U.S. Securities and Exchange Commission staff report on algorithmic trading, dated August 5, 2020, found that algorithmic trading has improved many measures of market quality and liquidity in normal conditions, while some types of it may make periods of unusual stress or volatility worse.
Related lesson: Quantitative trading
Types of Algorithmic Trading Strategies
Algorithmic trading strategies fall into a few families. Each one looks for a different kind of opportunity, and each one fails in a recognisable way.
| Strategy family | What the algorithm looks for | How it usually fails |
|---|---|---|
| Trend following and breakout | Price moving beyond a recent range or average | Long runs of small losses in sideways markets |
| Mean reversion | Price stretched far from an average, expected to snap back | A trend that keeps going and turns small losses into large ones |
| Arbitrage and statistical arbitrage | A price gap between related instruments | The gap closes before you get filled, or widens further |
| Market making | Earning the spread by quoting both bid and ask | Being run over by one-way order flow |
| Execution algorithms such as VWAP and TWAP | Filling a large order close to an average price | Slippage when volume dries up |
| Event and news driven | A scheduled release or headline | Spreads widening and fills slipping at the release |
| Machine learning | Patterns learned from historical features | Fitting noise that does not repeat out of sample |
VWAP (volume-weighted average price) algorithms spread an order in proportion to traded volume through the session. TWAP (time-weighted average price) algorithms spread it evenly through time. Both are about getting filled well, not about predicting direction.
There is no best algorithm for trading. The useful question is which family fits the market and holding period you can actually test and execute. A trend rule needs room for long losing streaks. A mean-reversion rule needs a hard stop for the trend that never reverts.
Machine learning sits on top of these families rather than replacing them. A model that ranks signals still needs a rule for sizing, stops and execution, and it is easier to overfit because it can test thousands of feature combinations.
Related lesson: Trend following
High-Frequency Trading Versus Algorithmic Trading
High-frequency trading (HFT) is a subset of algorithmic trading defined by speed, very short holding periods and high order-to-trade ratios. Its main strategies are market making, very short-term statistical arbitrage and reacting to events faster than any human can.
HFT is a separate business from retail algorithmic trading. It depends on servers co-located next to the exchange's matching engine, direct exchange data feeds, fast order routing and constant investment in hardware. HFT market makers earn small amounts per trade on very large volume, so their edge is measured in fractions of a tick and in how quickly they can cancel stale quotes.
A rule that trades daily or intraday bars has no speed component at all. Its edge, if it has one, comes from the signal and from controlling costs, not from being first. Many prop firms also prohibit HFT bots outright, so retail algorithmic trading almost always means slower, signal-based rules.
Algorithmic Trading Advantages and Disadvantages
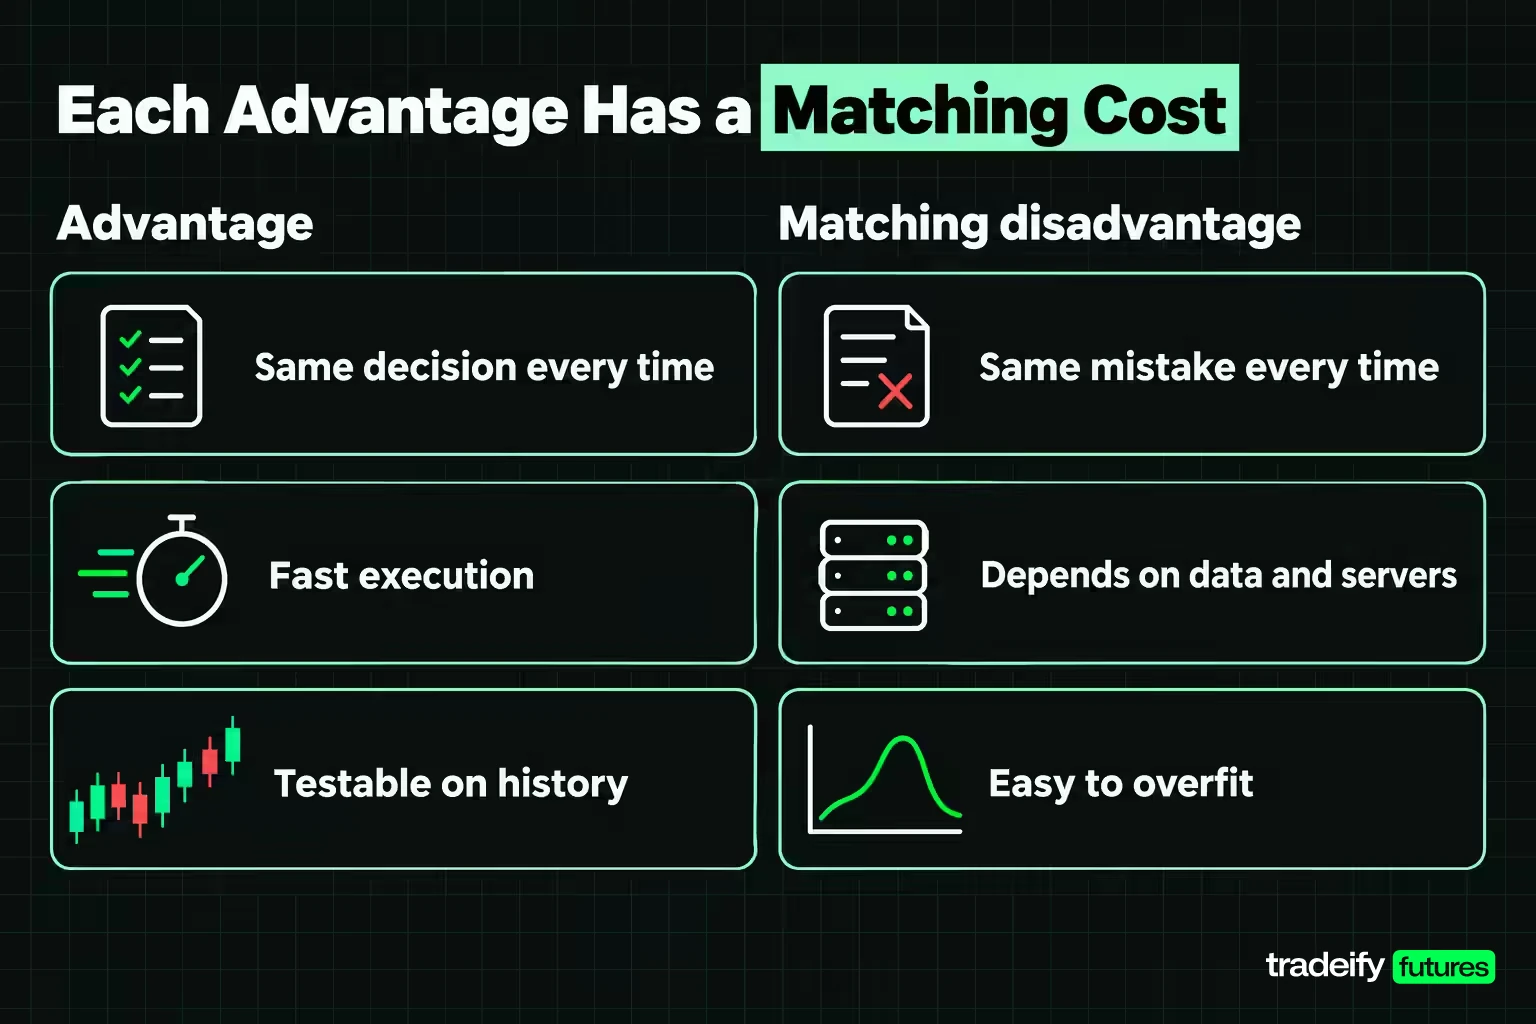
The advantages of algorithmic trading are real, and so are the costs. Most guides list both. The useful part is seeing which advantage creates which disadvantage.
| Advantage of algorithmic trading | Matching disadvantage |
|---|---|
| Same decision every time, no hesitation or tilt | Same mistake every time, at full speed |
| Fast execution, no manual order entry | Technical dependence on data feeds, servers and connections |
| Testable on historical data before risking money | Easy to overfit a test until it looks perfect |
| Can watch many markets at once | Small errors multiply across every market it trades |
| Removes emotion from the trade | Moves the emotion to the decision to switch it off in a drawdown |
| Precise records of every decision | Costs of data, software and slippage that eat a thin edge |
Read the table across, not down. Algorithmic trading does not remove risk. It swaps judgment risk for specification risk, technology risk and measurement risk.
The emotion row deserves a second look. You still have to sit through ten losers in a row without touching the switch. Turning a system off after a drawdown and back on after a rally is discretionary trading with extra steps.
An Algorithmic Breakout Rule Written Out in Full
An algorithmic rule has to be written so completely that a second person could rebuild it and get the same trades. Here is one breakout rule, specified in full. It is a teaching example, not a recommended system.
- Data. Continuous front-month daily bars for ES and NQ futures from Yahoo Finance, 5,041 sessions each from November 6, 2006 through November 4, 2026. Nine bars with a missing field are dropped, leaving 5,032 usable sessions per market.
- Warm-up. No signal until 20 sessions of highs and 14 sessions of true range exist.
- Signal. The close of a session is above the highest high of the previous 20 sessions.
- Entry. Buy at the next session's open. One position at a time, so new signals are ignored while a trade is open.
- Stop. Entry price minus half the 14-session average true range (ATR) measured on the signal bar.
- Exit. If a session opens below the stop, exit at that open. Otherwise, if the low touches the stop, exit at the stop. Otherwise exit at the close of the fifth session in the trade, counting the entry session.
- Costs. Two ticks of round-turn slippage plus $4 of round-turn commission. ES is worth $50 per index point and NQ $20, with a 0.25-point tick, so the cost is $29 (0.58 points) per ES trade and $14 (0.70 points) per NQ trade. Both are stated assumptions, not quotes.
Every result is reported in index points, in dollars and in R. R is the result divided by the risk taken, so a trade that loses exactly its planned risk is -1R and a trade that makes twice its risk is +2R.
At least five of those lines are choices: the 20-session channel, the half-ATR stop, the five-session hold, the cost and the gap rule. Each choice moves the result, which is why each one has to be written down before the test runs.
Related lesson: Backtesting a trading strategy
What 20 Years of ES and NQ Data Say About the Algorithm
The breakout algorithm produced 302 trades on ES and 296 on NQ over 20 years, about 15 a year on each market. Here is the headline, with every figure after the stated cost unless marked gross.
| Breakout algorithm result | ES | NQ |
|---|---|---|
| Trades | 302 | 296 |
| Gross points | 312.92 | 4,529.72 |
| Net points after cost | 137.76 | 4,322.52 |
| Expectancy per trade | -0.009R | +0.252R |
| 95% interval on expectancy | -0.198R to +0.180R | +0.040R to +0.465R |
| t statistic | -0.09 | 2.32 |
| Winning trades | 34% | 37% |
| One contract, net dollars | +$6,888 | +$86,450 |
In this study, the NQ version of the breakout rule shows a modest positive expectancy. The interval stays above zero and the result was positive in 14 of the 20 calendar years in which it traded. Roughly six in ten trades were stopped out, so the profit comes from a minority of trades that ran.
On ES, the same algorithm cannot be told apart from zero. The interval runs from about -0.2R to +0.2R, and the t statistic is -0.09.
Outlier Dependence in the Algorithm's Results
Concentration explains a lot of the ES result. The single best ES trade, entered on June 24, 2025, made 175.75 points, which is 56.2% of the entire 20-year gross total. Remove the ten best ES trades and the gross result is -809.83 points.
NQ leans on its outliers too. Its best trade, entered on April 13, 2026, made 1,845.50 points, 40.7% of the gross total, and removing the ten best NQ trades leaves -2,943.53 points. Both markets lose money without their biggest winners. That is normal for a trend rule, but it means a few missed signals can erase two decades of results.
Results by Decade
The ES breakout algorithm's results also changed sharply with time. From 2006 through 2016, the ES rule lost 1.95 points per trade across 139 trades (-0.268R). From 2017 through 2026 it made 2.51 points per trade across 163 trades (+0.212R). On one contract that is -$13,536 and then +$20,424. ES was positive in 11 of 21 calendar years.
Ask yourself whether you would have kept running a rule that lost money across the first decade of its history. Most traders would have switched it off long before the recovery, which is exactly the decision the backtest hides.
So does algorithmic trading really work? This one appears to work on NQ, by a modest margin, and shows no measurable edge on ES. Same code, different market.
Related lesson: Trading expectancy
Trading Costs Decide Whether an Algorithm Has an Edge
Trading costs are where most algorithms die quietly. The table below keeps the ES and NQ trade lists fixed and changes only the round-turn slippage, always adding the same $4 commission.
| Round-turn slippage | ES cost per trade | ES expectancy | ES one contract | NQ cost per trade | NQ expectancy |
|---|---|---|---|---|---|
| 0 ticks | $4 | +0.033R | +$14,438 | $4 | +0.269R |
| 1 tick | $16.50 | +0.012R | +$10,663 | $9 | +0.261R |
| 2 ticks | $29 | -0.009R | +$6,888 | $14 | +0.252R |
| 3 ticks | $41.50 | -0.030R | +$3,113 | $19 | +0.244R |
| 4 ticks | $54 | -0.051R | -$662 | $24 | +0.235R |
| 8 ticks | $104 | -0.135R | -$15,762 | $44 | +0.201R |
On ES, the whole 20-year result is a bet on execution. The gross edge is about 1.04 points per trade, so the break-even sits at roughly 3.8 ticks of round-turn slippage once commission is paid. At 4 ticks the system loses money in dollars as well as in R.
NQ barely notices. Its average winner is far larger in points, so even 8 ticks of slippage leaves +0.201R. That is the difference between an edge that is thin relative to costs and one that is not.
The practical test for any algorithm is simple. Find the cost at which the result changes sign, then compare it with what you actually pay, including slippage on stops and at the open. If the two numbers are close, you do not have a strategy. You have a bet on fills.
Related lesson: Slippage explained
Algorithm Results in R Versus Dollars
An algorithm's result can change sign depending on how you size it. In the 20-year ES breakout study (a 20-session high breakout with a half-ATR stop and a five-session exit), trading one ES contract per trade finishes +$6,888 after cost. Size the same trades at a fixed $1,000 of risk each, by dividing $1,000 by the stop distance, and the same trade list finishes -$2,698. Same signals, same fills, same costs, opposite sign.
The cause is that the stop distance moves with volatility. On ES the median dollar risk per contract was $598, but the 5th percentile was $293 and the 95th was $2,334, a spread of about 8 times. On NQ the median was $647, with a 5th percentile of $250 and a 95th of $4,289.
| Risk per contract at the stop | ES | NQ |
|---|---|---|
| 5th percentile | $293 | $250 |
| Median | $598 | $647 |
| Mean | $921 | $1,344 |
| 95th percentile | $2,334 | $4,289 |
One contract quietly puts more money on the high-volatility trades, where ES happened to make its biggest gains. Fixed-risk sizing gives every trade the same weight, and on that basis ES has no edge. The correlation between a trade's R result and its dollar risk was +0.03 on ES and -0.02 on NQ, so you cannot convert R into dollars by multiplying by an average stop.
If you size by risk, as most loss-limit rule sets push you to do, the fixed-risk figure is the relevant one. The one-contract figure is the flattering one.
Related lesson: Volatility-based position sizing
How Many Trades an Algorithm Needs Before It Proves Anything
An algorithm with 302 trades feels well tested. For ES it is nowhere close. Each ES trade's result has a standard deviation of about 1.68R against an average of -0.009R, so the noise is enormous relative to the signal.
For the result to reach a t statistic of 2, a rough bar for saying an average is probably not zero, the ES rule would need around 141,000 trades. At about 15 trades a year, that is more than 9,000 years. The problem is not too few trades. The edge is close to zero relative to the spread of outcomes.
NQ needs about 219 trades to reach the same bar and has 296. Its t statistic of 2.32 clears it, but only after roughly 15 years of data. A modest edge took most of two decades to separate from luck.
The Parameter Search Trap in Algorithm Testing
Running 36 versions of the 20-session ES and NQ breakout rule, with channels of 10, 20 and 55 sessions, stops of 0.5 to 2 ATR and holds of 5, 10 and 20 sessions, produced 36 positive results gross on ES and 32 after cost. The median was +0.081R and the range ran from -0.062R to +0.236R. On NQ all 36 were positive after cost, from +0.060R to +0.724R.
The temptation is obvious: report the best of the 36 and call it the system. That is how a curve-fit is born. The honest figure is the spread across settings, plus the setting you chose before you looked.
The Random-Entry Control
A long-only index rule inherits the upward drift of the index, so it needs a control. Replacing the breakout signal with a fixed-seed coin flip that fires on about one session in four, while keeping the same stop and exit, produced +0.094R and +0.142R on ES in two runs, and +0.185R and +0.147R on NQ.
The real ES breakout signal, at -0.009R, did worse than random entries. The real NQ signal, at +0.252R, beat both random runs, but not by a wide margin. Compare any algorithm against its own random control before believing the signal is doing the work.
Related lesson: Overfitting and look-ahead bias
Algorithmic Trading Risk Management and Where Rules Break
Risk management in algorithmic trading covers two kinds of risk: the market risk inside each trade and the operational risk of the machine itself. Market risk shows up in how a single trade can win far more, or lose far more, than planned. Operational risk shows up when the code, data or connection fails while the algorithm keeps sending orders.
Two itemised ES trades from a 20-session breakout rule with a half-ATR stop and a five-session exit show the market side. A real enforcement case and a list of outside controls cover the operational side.
A Winning Algorithmic Trade, Itemised
This trade comes from a breakout algorithm that buys ES at the next open after a close above the previous 20-session high, with a stop at half the 14-session ATR and an exit at the fifth session's close. On June 23, 2025, ES closed at 6077.00, above the previous 20-session high of 6074.75, so the rule fired. The 14-session ATR was 78.00 points, so the risk was 39.00 points, or $1,950 on one contract, with the stop at 6039.00.
The entry filled at the June 24 open at 6078.00. Price never touched the stop, so the time exit filled at the June 30 close at 6253.75. That is 175.75 points, about 4.49R, or $8,758.50 on one contract after the $29 cost.
A Gap Through the Stop, Itemised
On April 9, 2026, ES closed at 6863.25, above the previous 20-session high of 6847.25. The ATR was 135.41 points, so the risk was 67.71 points, about $3,385, with the stop at 6790.29. The entry filled at the April 10 open at 6858.00.
The next session, Monday April 13, opened at 6780.00, 10.29 points below the stop. A resting stop becomes a market order once triggered, so the fill is the open, not the stop. The loss was 78.00 points, about -1.16R, or $3,929 on one contract including cost. ES closed that same day at 6922.75, which is the frustrating part: the algorithm was right on direction and still took a larger-than-planned loss.
Seven ES trades and three NQ trades exited through a gap, the worst at -2.68R. Three of the seven ES gaps and two of the three NQ gaps fall within four days of a quarterly contract roll, so some may be splicing artefacts of the continuous price series rather than gaps a trader would have faced. Any backtest on continuous futures data should flag gaps near a roll for that reason.
Runaway Code and Other Operational Failures
The most expensive algorithmic trading failures are usually plumbing, not strategy. On August 1, 2012, Knight Capital's automated equity router sent more than 4 million orders in the first 45 minutes after the open while trying to fill 212 customer orders. The firm traded more than 397 million shares and lost more than $460 million. The SEC later fined it $12 million in its first enforcement action under the market access rule.
The controls that stop runaway algorithmic orders sit outside the strategy code.
- A daily loss limit that flattens positions and stops new orders.
- A maximum order count and maximum position size per instrument.
- A kill switch that has been tested, not just written.
- Alerts that a person actually reads before the open.
- Data checks for missing bars, bad prints and stale feeds.
- A rule for what the algorithm does after a disconnect.
Regime change is the slow version of the same risk. A rule can stop working for years without any code failing, so the market itself becomes the bug. Decide in advance what result would make you switch an algorithm off, and write that down too.
Related lesson: Trading bots and automation
How to Start Algorithmic Trading
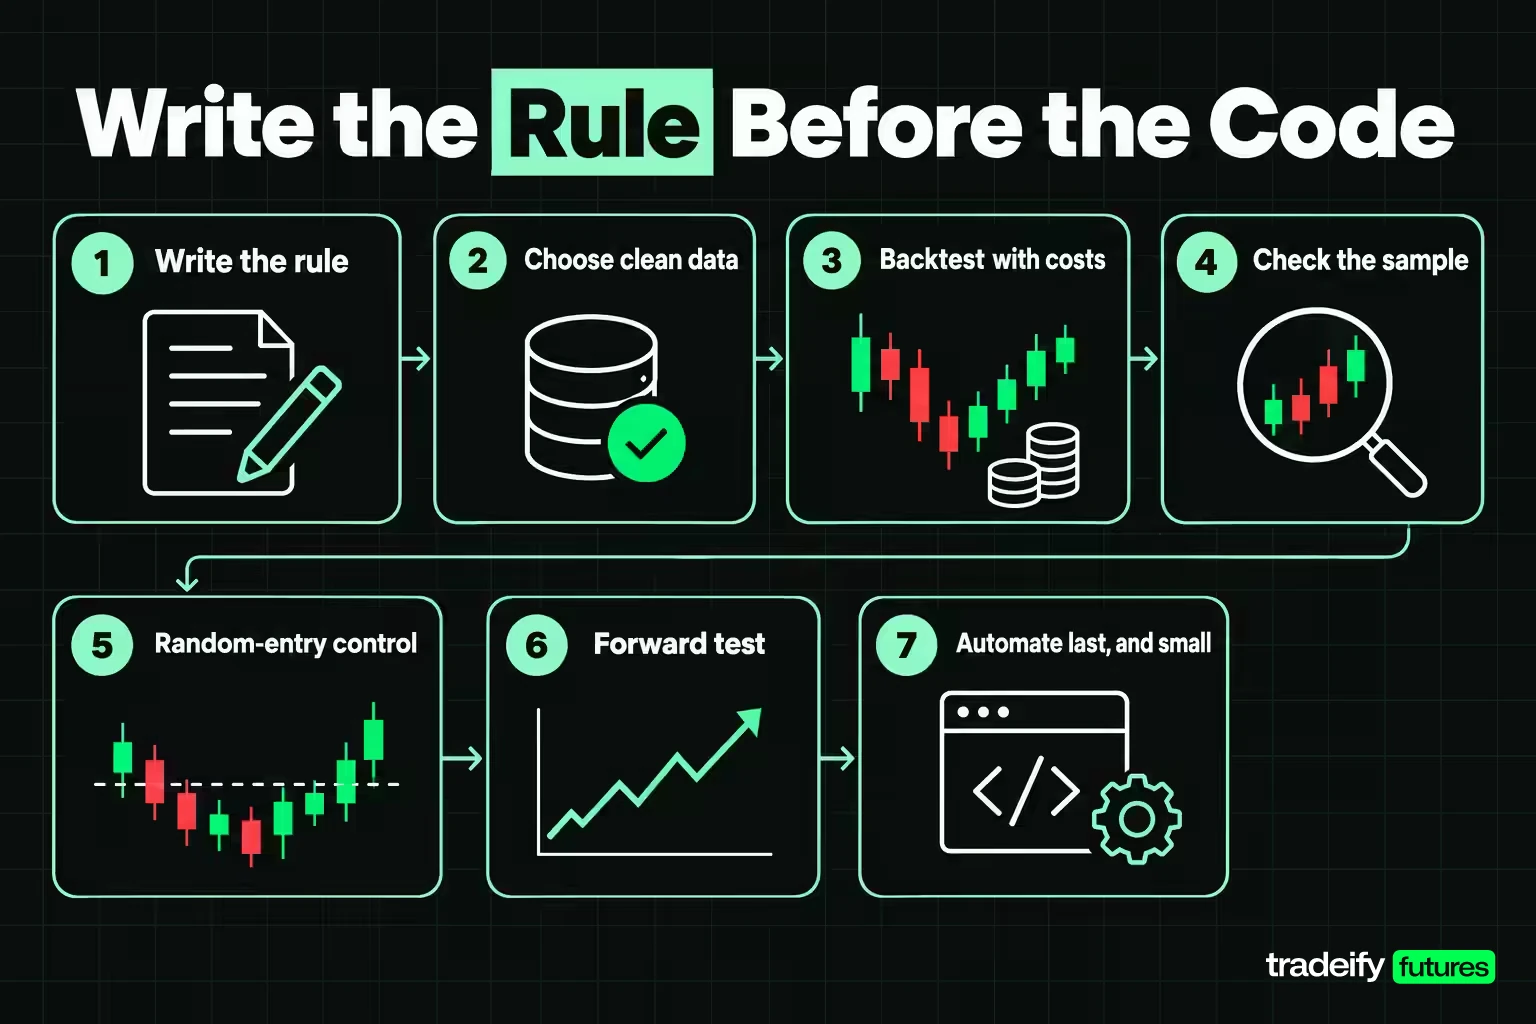
The best way to start algorithmic trading is to write your current rule down before you write any code. Many beginners do it the other way round and end up automating a feeling they never defined.
- Write the rule in plain language. Universe, data, signal, entry, stop, exit, size, costs and the fill assumption for a gap.
- Choose clean data. Know whether your futures series is continuous, how it handles rolls and which bars are missing.
- Backtest with costs. Include commission and realistic slippage, and report results in R as well as dollars.
- Check the sample. Work out how many trades you would need for the result to be distinguishable from zero.
- Run a random-entry control. Keep your stop and exit, randomise the entry, and see whether your signal beats it.
- Forward test. Run the rule on new data, on a simulator or in very small size, before trusting it.
- Automate last, and small. Add the loss limits and kill switch before the first live order.
Do You Need to Code for Algorithmic Trading
You do not need to code to start algorithmic trading, but you do need to remove ambiguity, which is the same discipline. Spreadsheets, platform strategy builders and bracket-order templates can express a simple rule such as buying a close above the 20-session high with a fixed stop and a time exit. Coding becomes necessary when the logic branches, when you test many markets at once, or when you want to search many settings. Python is a common starting language for testing, and many futures platforms have their own scripting languages for execution.
Technical Requirements for Algorithmic Trading
A retail algorithm needs five pieces of technology.
- Data. Historical bars for testing and a live feed for trading, from the same source if possible so the test matches what the algorithm sees.
- A testing tool. A spreadsheet, a platform's strategy tester or a Python script that replays bars in order.
- An execution route. A platform or API that accepts automated orders, and server-side stops so a protective order survives if your connection drops.
- A host. A computer or virtual server that stays on and connected while the rule trades.
- Monitoring. Logs, alerts and a kill switch you can reach from your phone.
Low-latency servers and co-location only matter for HFT. For a daily or intraday signal rule, reliability matters far more than speed: a dropped connection with an open position is a bigger risk than a few milliseconds of delay.
Algorithmic Trading in Stocks, Futures, Forex and Crypto
Algorithmic trading is used in every liquid market, but each one behaves differently for an automated rule.
- Stocks. Thousands of symbols suit screening and ranking algorithms, and execution algorithms such as VWAP dominate institutional order flow. Rules must handle the opening and closing auctions, overnight gaps and corporate actions such as splits.
- Futures. Liquid index futures such as ES and NQ trade nearly around the clock with standard contract specifications on one exchange order book, which makes them clean to test. Rules must handle contract rolls and the gaps that continuous price series create.
- Forex. Spot currency trades over the counter across many venues, so prices and spreads differ by provider, while currency futures give a central exchange price.
- Crypto. Markets trade every day of the year, so an algorithm has no natural pause for maintenance, and liquidity and fees vary widely between exchanges.
In every market, the thinner the liquidity, the more slippage eats a small edge. A rule that survives on a liquid index future can fail on a thin contract with the same signal.
How Much Money You Need for Algorithmic Trading
There is no honest population-level answer to how much algorithmic traders make. The field spans institutional desks, market makers and individuals running one rule on one market. What you can answer is how much risk one rule needs. In a 20-year ES breakout study with a half-ATR stop, a single one-contract trade risked anywhere from about $293 to $2,334 at the 5th and 95th percentiles, and one gap cost $3,929, so account size has to cover the worst trade and the losing streak, not the average.
Is Algorithmic Trading Legal
Algorithmic trading is legal in U.S. markets. What is illegal is using an algorithm, or any other method, to manipulate prices. The clearest example is spoofing. The Commodity Futures Trading Commission describes spoofing as bidding or offering with the intent to cancel the bid or offer before execution, including orders placed to create a false appearance of market depth. Quote stuffing and layering raise the same concern.
For broker-dealers that give clients access to the market, the SEC's market access rule, Rule 15c3-5, adopted in 2010, requires risk controls reasonably designed to manage that access. It is addressed to firms rather than individual traders, but its logic applies to anyone running an algorithm: pre-trade limits, order checks and supervision.
Prop firms and brokers add their own automation rules on top of the law, so read them before you connect a bot to any account.
On our accounts at Tradeify, bots and algorithms are allowed when you are the sole owner of the strategy, it is not shared with other traders or firms, and it is not high-frequency trading, and we may ask you to prove ownership. The Tradovate API is only available on live funded accounts, not on evaluation or Sim Funded accounts. All positions are closed by 4:45 PM ET, so a rule that holds for several sessions, like the five-session breakout in this guide, could not run as written on our accounts; it would need an intraday version.
Algorithmic Trading Checklist Before You Automate
Use this algorithmic trading checklist on any rule, your own or one you bought. Stop at the first item you cannot answer.
- The rule is written so someone else could rebuild it from the text alone, with every parameter stated.
- The entry price is one you could actually have received, and gaps fill at the open, not at the stop.
- Results are reported in R and in dollars, and both sizing methods agree on the sign.
- The cost assumption is stated in ticks and in currency, and the result survives double that cost.
- An interval sits beside the expectancy, with the trade count needed to exclude zero.
- The signal beats a random-entry control that uses the same stop and exit.
- The result does not depend on the ten largest winners.
- A loss limit, an order-count limit and a tested kill switch sit outside the strategy code.
Related lesson: Forward testing and walk-forward analysis
Algorithmic Trading FAQ
Does algorithmic trading really work?
It can, but only a tested rule can tell you. A 20-session breakout rule tested on 20 years of daily data showed a modest edge on NQ after costs and no measurable edge on ES. The useful checks are whether the interval excludes zero, whether it survives double the cost, and whether it beats random entries.
Is algorithmic trading the same as high-frequency trading?
No. High-frequency trading is a subset defined by speed, very short holds and heavy order traffic. A rule on daily or intraday bars is algorithmic trading with no speed component, and many prop firms ban HFT bots outright.
Can AI or ChatGPT build a trading bot?
An AI tool can write code that implements a rule you specify, which is the easiest part of the work. Deciding the rule, sourcing clean data, handling gaps and costs honestly, and testing the result are still your job. Code that runs is not the same as a rule with an edge.
Can you make $100 a day with algorithmic trading?
No algorithm produces a fixed daily income. Even a 20-session NQ breakout rule that was positive over 20 years of daily data won only 37% of its trades and leaned on a few large winners, so its results came in lumps with long flat or losing stretches. Judge an algorithm on expectancy and drawdown, not a daily target.
Is algorithmic trading the same as copy trading?
No. Algorithmic trading runs your own rule automatically. Copy trading mirrors another trader's or your own master account's orders, and the copied trades are only as good as the source.
Writing Your First Algorithmic Trading Rule
The first step in algorithmic trading is to take the rule you trade now and write it out in full: data, warm-up, signal, entry, stop, exit, costs and the gap rule. Then answer one question before automating anything: at what round-turn cost does your result change sign, and how close is that to what you actually pay?
If the answer is comfortable, forward test the rule with a random-entry control beside it, using the same stop and exit. If it is not, automation was never the problem.
This article is educational and is not investment advice. Trading futures involves substantial risk of loss, leverage can make losses larger than expected, and the results above are a historical study of a stated rule on continuous futures price data, not a live trading record. Past and backtested results do not indicate future results. Evaluation and funded accounts at prop firms are simulated, and their fills and rules differ from live brokerage trading.


