




TL;DR: Three methods and three outside patterns are six candlestick shapes, and the first decision is which family you are looking at. Rising and falling three methods are rare five-candle continuation pauses. The two gap three methods patterns tested as reversals despite their continuation label. Three outside up and down are common three-candle reversals built on an engulfing candle. Trade any of them with a stop beyond the whole pattern and a written entry rule.
Three methods and three outside patterns get taught together, but they answer opposite questions, and that is where the expensive confusion starts. A three methods pattern says a trend paused and is still alive. A three outside pattern says a trend just lost control. Mix them up and you end up buying the pause in a move that already turned, or fading a move that was only catching its breath.
This guide names all six, gives each one a measurable identification test, works an illustrative Micro E-mini S&P 500 example through three entry routes with one stop and one target, and reports what the published testing actually supports.
Three Methods and Three Outside Patterns at a Glance
The six patterns behind the names three methods and three outside split into three families by structure. Two are five-candle "staircases", two are three-candle gap fills, and two are three-candle reversals built on an engulfing candle. The mat hold is a close relative of rising three methods and gets confused with it often enough to belong in the same table.
The tested behaviour column comes from Thomas Bulkowski's candlestick research, which ranks 103 candle patterns across more than 4.7 million candle lines of daily stock data. Frequency rank 1 means the most common pattern and 103 the rarest.
| Pattern | Candles | Family | Textbook claim | Bulkowski tested behaviour | Frequency rank |
|---|---|---|---|---|---|
| Rising three methods | 5 | Staircase | Bullish continuation | Bullish continuation 74% of the time (102 samples) | 88 |
| Falling three methods | 5 | Staircase | Bearish continuation | Bearish continuation 71% of the time (64 samples) | 91 |
| Mat hold | 5 | Staircase | Bullish continuation | Bullish continuation 78% of the time (52 samples) | 93 |
| Upside gap three methods | 3 | Gap fill | Bullish continuation | Bearish reversal 59% of the time, which he calls near random | 85 |
| Downside gap three methods | 3 | Gap fill | Bearish continuation | Bullish reversal 62% of the time | 84 |
| Three outside up | 3 | Outside | Bullish reversal | Bullish reversal 75% of the time | 24 |
| Three outside down | 3 | Outside | Bearish reversal | Bearish reversal 69% of the time | 21 |
How rare the patterns are and what the rates mean
Two things jump out of Bulkowski's numbers for these six patterns. The staircase patterns are genuinely rare: 102 rising three methods in more than 4.7 million candle lines is roughly one per 46,000 daily candles, so on a single market's daily chart you can go years without a textbook example. The outside patterns are common, which makes them far easier to test on your own data.
The tested percentages describe how often price left the pattern in the expected direction. They are not win rates for a trade with a stop and a target, and the table should never be read that way.
Rising and Falling Three Methods Patterns Candle by Candle
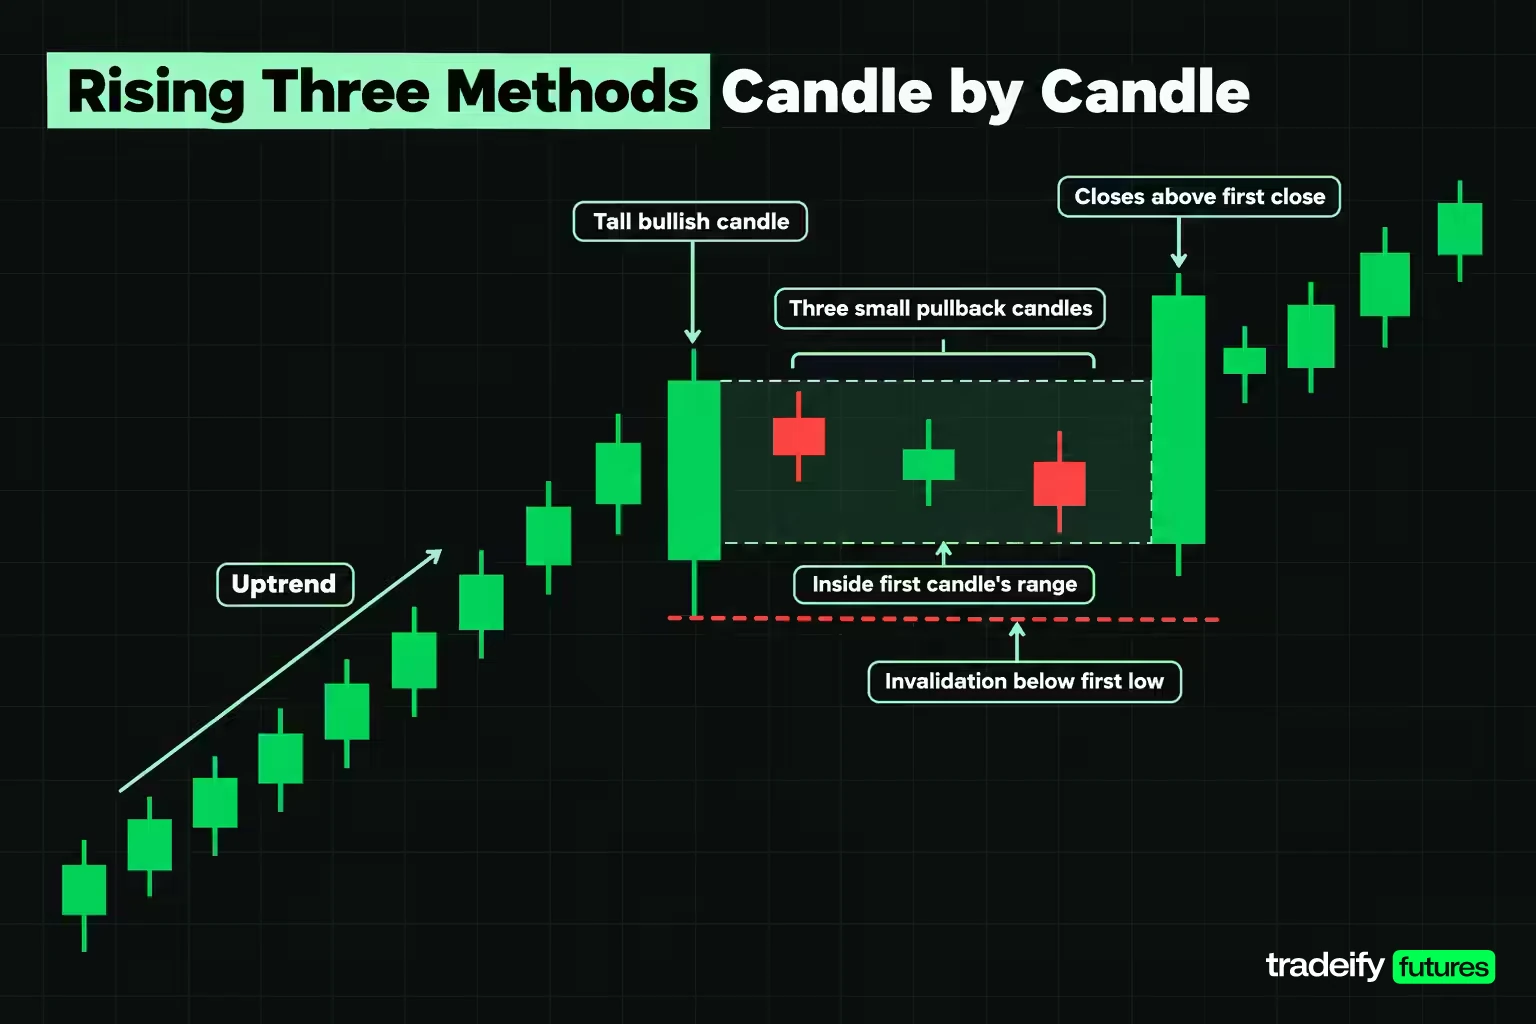
Rising three methods and falling three methods are the same five-candle pattern pointed in opposite directions. A tall candle runs with the trend, three small candles drift against it while staying inside the first candle's range, and a fifth tall candle resumes the move and closes beyond the first candle's close.
| Test | Rising three methods | Falling three methods |
|---|---|---|
| Trend into the pattern | Upward | Downward |
| Candle 1 | Tall white (bullish) body | Tall black (bearish) body |
| Candles 2 to 4 | Small, drifting lower; candles 2 and 4 black, candle 3 any colour | Small, drifting higher; candles 2 and 4 white, candle 3 any colour |
| Where the middle candles sit | Inside candle 1's high to low range | Inside candle 1's high to low range |
| Candle 5 | Tall white, closing above candle 1's close | Tall black, closing below candle 1's close |
| Common invalidation level | Beyond candle 1's low | Beyond candle 1's high |
Bulkowski's own falling three methods example shows why the containment rule needs a definition. The middle shadows poked outside the first candle's range and he still counted the pattern. TradingView's description is stricter in spirit: a small candle that breaks above the first candle's high weakens a falling three methods. Pick one rule (bodies inside, or bodies and shadows inside) and keep it, or your sample measures two different patterns.
What the pattern represents is a short rest inside a move. In a falling three methods, sellers drive one large down candle, a weak bounce fails to recover that candle's range, and sellers return with a candle as large as the first. TradingView's write-up adds the practical catch: by the time the fifth candle closes, price has already travelled a long way, which pushes the logical stop far from the entry.
Mat hold versus rising three methods
The mat hold is a bullish five-candle continuation pattern that looks almost identical to rising three methods. In Bulkowski's definition the second candle is a small black candle that closes higher than the first candle's close, the middle three bodies stay above the first candle's low, and the last candle closes above the high of the prior four.
That difference matters because the two patterns are tested separately. Bulkowski found 52 mat holds, a bullish continuation 78% of the time, with a frequency rank of 93. One of his trading notes is to expect a price reversal after the mat hold completes. If you log both under one name, you cannot tell which one your results describe.
Upside and Downside Gap Three Methods Patterns
Upside gap three methods and downside gap three methods are three-candle patterns that replace the staircase's middle section with a gap. They carry the three methods name and a continuation label, but Bulkowski's testing found the opposite behaviour more often.
- Upside gap three methods. Two tall white candles in an uptrend with a gap between them, including between the shadows. The third candle is black and fills the gap. Bulkowski found it acting as a bearish reversal 59% of the time, which he calls near random, with a frequency rank of 85.
- Downside gap three methods. Two tall black candles in a downtrend with a gap between them, shadows not overlapping. The third candle is white, opens within the second candle's body and closes within the first candle's body, closing the gap. Bulkowski found it acting as a bullish reversal 62% of the time, with a frequency rank of 84.
The practical reading is that the gap three methods patterns are a warning to stay flexible, not a continuation signal to act on. A near-random direction split means the breakout after the pattern, not the pattern itself, tells you which way price chose.
There is also a market problem. These patterns need a real gap between the shadows of two candles. Markets that trade nearly around the clock, such as index futures, rarely leave gaps between consecutive intraday bars, so on those charts the gap versions barely exist. Gaps show up mainly at session opens.
Related lesson: Gaps and gap analysis
Three Outside Up and Three Outside Down Patterns
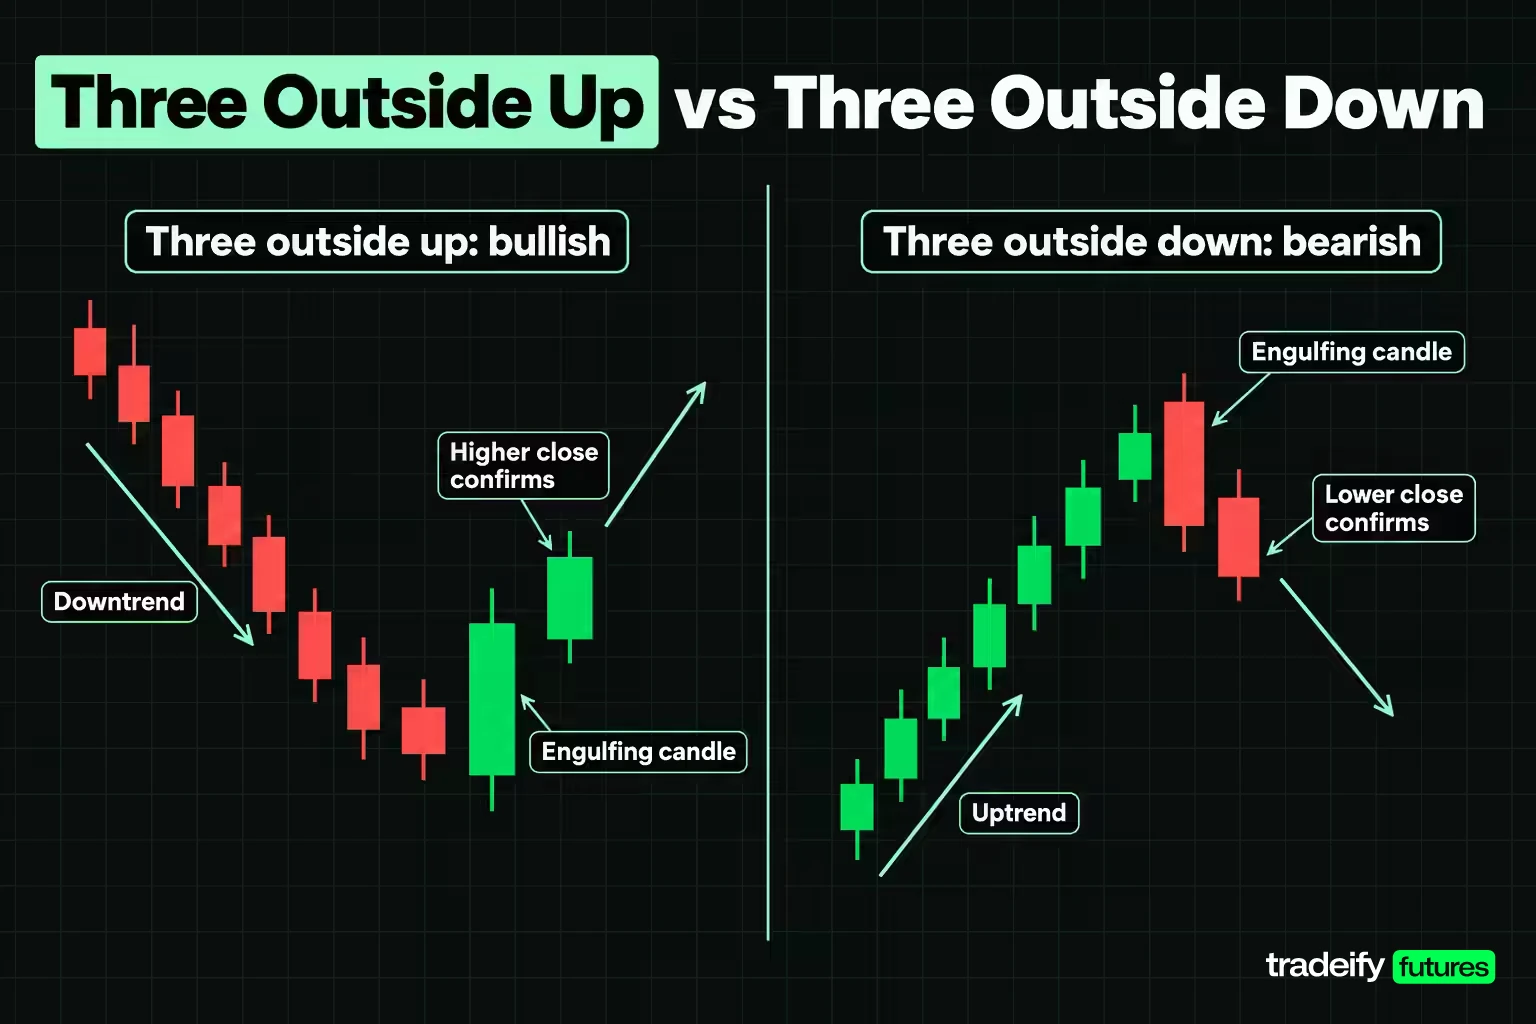
Three outside up and three outside down are three-candle reversal patterns built on an engulfing candle. The first two candles form a bullish or bearish engulfing pattern, and the third candle confirms the new direction with a further close.
- Three outside up. In a downtrend, a black candle is followed by a white candle that opens below the prior body and closes above it. The third candle closes higher. Bulkowski reports a bullish reversal 75% of the time and a frequency rank of 24.
- Three outside down. In an uptrend, a white candle is followed by a black candle that opens above the prior body and closes below it. The third candle closes lower. Bulkowski reports a bearish reversal 69% of the time and a frequency rank of 21.
Definitions differ on the third candle, and that changes what you count. Bulkowski only asks for a higher close (or a lower one for three outside down). The formal three outside up definition used in academic tests, based on the Caginalp and Laurent work and restated in a 2017 SET50 study, also requires a white third candle that closes above the second candle's close, and an engulfing body larger than the first body. That stricter version throws out third candles that close higher but print a small black body.
A detection tool may also skip the trend. The TA-Lib CDL3OUTSIDE function, used inside many charting scripts, does not verify the prior trend, so it flags the shape anywhere. A three outside up in the middle of a range is just three candles.
Bulkowski's best-performing setups for both patterns are counter-intuitive. He notes that three outside up does best as a downward retracement of a larger uptrend, and three outside down as an upward retracement of a larger downtrend. In other words, the "reversal" works best when it reverses a pullback and rejoins the bigger trend.
Related lesson: Engulfing candlestick patterns
How to Identify These Candlestick Patterns With Four Measurable Tests
Identifying any of these six candlestick patterns comes down to four tests you can measure from open, high, low and close prices. Recognition by eye is where most false patterns come from, because a chart full of small candles always seems to contain one.
- The prior move. A continuation pattern needs a trend to continue and a reversal pattern needs a trend to reverse. Define the trend mechanically before you look at the shape.
- The size relationship. In a staircase, candles 1 and 5 are tall and candles 2 to 4 are small. In a gap pattern, the first two candles are tall. In an outside pattern, the engulfing body is larger than the first body. Measure "tall" and "small" as a multiple of the average candle range over a fixed lookback, such as the last 20 bars, instead of judging by eye.
- Containment or engulfment. Staircase middle candles stay inside candle 1's range. The gap pattern's third candle fills the gap. The outside pattern's second body covers the first body. This test decides which family you are in.
- The closing candle. No pattern is complete until its final candle closes. Rising three methods needs a close above candle 1's close, falling three methods a close below it, and the outside patterns a further close in the engulfing direction.
Run the tests in that order. If the prior move fails, stop there, because the remaining tests describe a shape with nothing to continue or reverse. Writing the thresholds down before you scan a chart is what keeps a near miss from turning into a trade, and doing nothing is the correct result more often than not.
Trend Context Each Pattern Needs
Trend context is the condition every one of these patterns depends on, and it is the condition traders define most loosely. "It was going up" is not a test. A trend rule is something you can apply to any chart and get the same answer twice.
Academic studies use a few simple definitions. Marshall, Young and Rose used a 10-period exponential moving average: a close above it counts as an uptrend and a close below it as a downtrend. Caginalp and Laurent required a 3-day simple moving average to rise (or fall) for at least 5 of 6 successive days. TradingView's built-in pattern indicators offer SMA50 (price above or below the 50-period average) or SMA50 and SMA200 together, which only detects stronger trends.
Each pattern then needs a matching trend:
- Rising three methods and the mat hold need an uptrend into the pattern. Bulkowski's note on rising three methods is to trade it only when the primary trend is up.
- Falling three methods needs a downtrend.
- Three outside up needs a decline to reverse, and three outside down a rise.
The larger trend matters too. A rising three methods on a 5-minute chart inside a falling daily chart is a pullback inside a bigger decline, not a fresh continuation signal. Bulkowski's findings for the outside patterns point the same way: they did best when the small reversal sent price back in the direction of the larger trend.
Related lesson: Multiple timeframe analysis
The Market Psychology Behind Staircase, Gap and Outside Candle Patterns
The market psychology behind staircase, gap-fill and outside candlestick patterns is a story about who controls each candle, and it helps to know where the story ends and the evidence begins.
In a falling three methods, the first candle shows strong selling. The three small candles are a pause: some sellers take profits and a few buyers step in, but the bounce cannot reclaim the first candle's range. When the fifth candle closes below the first candle's close, sellers have returned with the same force. Rising three methods tells the same story with buyers in control.
In a three outside up, sellers are in charge on the first candle. On the second, price opens below that candle's body, so sellers start strong, then buyers take the session and close above where the first candle opened. The third candle answers the obvious question: was that one buying session a fluke? A further higher close says buyers kept control for a second session.
The gap patterns are where the story breaks down. On paper, the filled gap is a pause before continuation. In Bulkowski's testing, the gap fill more often marked the move running out of steam. That is a useful reminder that a clean narrative is not evidence. The candle story explains what happened over a few sessions; it does not say what the next session will do.
The trader-side psychology matters as much. If you have been waiting weeks for a rising three methods, a sequence that nearly qualifies starts to look like the real thing. That is not a character flaw; it is what waiting does to anyone. Writing the four tests down before the session is what protects you from it.
Confirming the Patterns With Volume and Indicators
Confirmation means extra evidence that you require before acting on the pattern, and every confirmation tool is a filter you should test rather than a rule you inherit.
- Volume. TradingView's guidance for falling three methods is that lower volume on the three small candles and higher volume on the two long candles supports the continuation reading. The same logic applies to rising three methods. For outside patterns, heavier volume on the engulfing candle is the common filter.
- Moving averages. A 10-period EMA or a 50-period SMA confirms the trend condition, and a pattern that forms near a rising average in an uptrend has a clearer story than one in a range.
- RSI and stochastics. For reversal patterns, an oversold reading under a three outside up (RSI below 30, or stochastics %D below 20) or an overbought reading over a three outside down (RSI above 70, %D above 80) is a common filter.
- MACD. A MACD line crossing its signal line in the pattern's direction is another momentum check.
- Fibonacci retracements. A three outside up that forms near a retracement level of a prior advance fits the "reverse the pullback" setup that tested best.
The evidence on filters is a caution. The 2017 SET50 study by Tharavanij, Siraprapasiri and Rajchamaha tested candlestick reversal patterns, including three outside up and down, with Stochastics %D, RSI and Money Flow Index filters. Filtering generally did not increase profitability or prediction accuracy. A filter earns its place by removing failures in your own data, not by making a chart look more thorough.
Related lesson: What is volume
Trading the Patterns With a Worked Falling Three Methods Example
Trading any of these patterns comes down to one decision the textbooks skip: where you enter, given one stop and one target. This illustrative falling three methods uses the Micro E-mini S&P 500 (MES), where one index point is worth $5 and the minimum tick of 0.25 points is worth $1.25. All prices are round illustrative levels, not a real market record.
| Candle | Open | High | Low | Close | Body in points |
|---|---|---|---|---|---|
| 1 | 7,600.00 | 7,601.00 | 7,586.00 | 7,587.00 | 13.00 (bearish) |
| 2 | 7,588.00 | 7,591.00 | 7,587.00 | 7,590.00 | 2.00 (bullish) |
| 3 | 7,590.00 | 7,592.50 | 7,589.00 | 7,591.50 | 1.50 (bullish) |
| 4 | 7,591.50 | 7,594.50 | 7,590.50 | 7,593.50 | 2.00 (bullish) |
| 5 | 7,593.00 | 7,594.00 | 7,576.00 | 7,577.00 | 16.00 (bearish) |
The pattern qualifies on all four tests. Assume a downtrend into candle 1. The middle bodies are no more than about 15% of candle 1's body, and every middle candle stays inside the 7,586.00 to 7,601.00 range. Candle 5 closes at 7,577.00, below candle 1's close of 7,587.00.
The pattern high is 7,601.00 and the pattern low is 7,576.00, so the pattern is 25.00 points tall. If sellers really are back in control, price should not trade above the pattern high, so the stop goes one tick above it at 7,601.25. Bulkowski's measure rule subtracts the pattern height from the pattern low for a target of 7,551.00. The stop to target distance is 50.25 points, or $251.25 per contract, no matter where you enter.
Three entry routes against one stop and target
In the illustrative MES falling three methods, the stop at 7,601.25 and the measure rule target at 7,551.00 sit 50.25 points apart, and the entry choice decides how much of that distance you put at risk.
| Entry route | Entry price | Risk in points | Risk per contract | Reward to risk | Break-even win rate | Break-even with $1.50 costs |
|---|---|---|---|---|---|---|
| Fifth candle close | 7,577.00 | 24.25 | $121.25 | 1.07 | 48.26% | 48.86% |
| Sell stop one tick under candle 5 low | 7,575.75 | 25.50 | $127.50 | 0.97 | 50.75% | 51.34% |
| Limit at candle 5 body midpoint | 7,585.00 | 16.25 | $81.25 | 2.09 | 32.34% | 32.94% |
The confirmation route looks safer and costs the most. Waiting for a break of candle 5's low adds 1.25 points of risk and drops reward to risk below 1, so the trade needs to win more than half the time just to break even. The midpoint limit has the best numbers, but it only fills if price bounces 8.00 points back up before falling, and the strongest continuations are often the ones that never offer that bounce. A route that fills on only the weak follow-throughs can look cheap on paper and still lose.
There is no correct route by default. Pick one, write it down, and keep it for the whole sample, so your results describe one rule instead of whichever route felt right that day.
Position sizing the three entries
Position size follows from risk per contract. With an illustrative $50,000 account risking 0.5% per trade, the budget is $250.
- Close entry: $250 / $121.25 rounds down to 2 contracts, risking $242.50, or 0.48% of the account.
- Confirmation entry: $250 / $127.50 rounds down to 1 contract, risking $127.50, or 0.26%.
- Midpoint entry: $250 / $81.25 rounds down to 3 contracts, risking $243.75, or 0.49%.
The confirmation route is the only one where rounding leaves half the budget unused. That is not a flaw in the maths; it is the cost of waiting, shown in contracts.
Related lesson: Position sizing
Stop Placement and Risk Management for Candlestick Pattern Trades
Stop placement for three methods and three outside trades starts from one rule: put the invalidation level beyond the extreme of the whole pattern, not beyond the last candle. A stop at the fifth candle's high in a falling three methods sits inside the pattern's own noise and gets hit by an ordinary retest.
The three outside up shows the same trade-off from the reversal side. Take an illustrative MES three outside up:
| Candle | Open | High | Low | Close |
|---|---|---|---|---|
| 1 (bearish) | 7,520.00 | 7,521.00 | 7,511.00 | 7,512.00 |
| 2 (bullish engulfing) | 7,510.00 | 7,524.00 | 7,508.00 | 7,523.00 |
| 3 (higher close) | 7,523.00 | 7,529.00 | 7,522.00 | 7,528.00 |
The pattern runs from 7,508.00 to 7,529.00, a height of 21.00 points. The stop goes one tick under the low at 7,507.75 and the measure rule target is 7,550.00, so the stop to target distance is 42.25 points.
- Entering at the third candle's close (7,528.00) risks 20.25 points, or $101.25 per contract, for a 1.09 reward to risk and a 47.93% break-even win rate.
- Entering at the engulfing candle's close (7,523.00) risks 15.25 points, or $76.25, for a 1.77 reward to risk and a 36.09% break-even rate.
The third candle is what makes it a three outside up, and in this example it costs 5.00 points of entry, $25 per contract. The early entry is cheaper because it is a plain engulfing trade without the confirmation. Neither is wrong, but they are different setups and belong in different logs.
Targets, costs and the measure rule
The measure rule target for a candlestick pattern (its height projected from the breakout side) is a reference point rather than a promise. Bulkowski reports that only 40% of falling three methods reached it in the best configuration, and 47% of three outside up. A partial exit at a nearer level, or a trailing stop once price moves a full pattern height, are common alternatives; whichever you choose, test it the same way you test the entry.
Include costs. A round-turn cost per contract (commission plus fees) adds to every loss and subtracts from every win, which is why, in the illustrative MES falling three methods and three outside up examples, break-even rates rise by about half a percentage point after a $1.50 cost. On small patterns traded with micros, costs take a bigger share. A stop order also does not guarantee its price, and a fast market can fill it several ticks away.
Related lesson: Stop-loss orders and placement
What Candlestick Pattern Statistics and Studies Show
Candlestick pattern statistics for the three methods and three outside families come from two kinds of sources: Bulkowski's large descriptive testing on daily stock charts, and a smaller set of academic studies that test candlestick rules as trading systems.
Bulkowski's rates and their caveats
Bulkowski's numbers for these candlestick patterns carry two caveats he states himself. The staircase samples are small (102 rising three methods, 64 falling three methods and 52 mat holds out of more than 4.7 million candle lines), and he says the statistics are likely to change. And a high continuation or reversal rate does not mean good follow-through. Rising three methods ranks 94 out of 103 for overall performance, falling three methods 89 and the mat hold 86. The outside patterns rank better at 34 (up) and 39 (down).
Peer-reviewed tests of candlestick rules
The academic record on candlestick pattern rules is mixed:
- Caginalp and Laurent (1998) tested standard three-day candlestick patterns on daily prices of all S&P 500 stocks from 1992 to 1996. Out-of-sample tests showed significance at 36 standard deviations and a profit of almost 1% over a two-day holding period.
- Marshall, Young and Rose (2006) used a bootstrap method on Dow Jones Industrial Average stocks from 1992 to 2002 and found candlestick patterns had no value.
- Duvinage, Mazza and Petitjean (2013) tested 5-minute data on the 30 Dow stocks. After trading costs and a data-snooping correction, no single candlestick rule beat buy and hold.
- Tharavanij, Siraprapasiri and Rajchamaha (2017) tested reversal patterns, including three outside up and down, on SET50 stocks from July 3, 2006 to June 30, 2016. Mean returns of most patterns were not statistically different from zero.
Three conclusions follow. The studies mostly test stocks on daily bars with fixed holding periods, not futures with stops and targets. Results change with the market, the period, the exit rule and the costs. And a pattern that shows up a few dozen times in decades of data cannot be validated by one trader, so your own log on your own market is the test that counts.
Related lesson: How to keep a trading journal
Advantages and Limitations of Continuation and Reversal Candle Patterns
Continuation and reversal candle patterns like the three methods and three outside families are worth knowing because they turn a vague chart read into a defined decision, but the limits are real.
Advantages:
- A built-in invalidation level. Every one of the six has an obvious extreme beyond which the pattern is wrong, so the stop is not a guess.
- A clear structure. The candle rules are specific enough to code, test and log.
- Frequent outside patterns. Three outside up and down rank 24 and 21 for frequency, so you can build a meaningful sample on one market.
- Useful as context. A completed staircase tells you sellers or buyers defended a range, even if you never trade the pattern.
Limitations:
- Rare staircases. With frequency ranks of 88, 91 and 93, the staircase patterns are too rare to build a routine around.
- Late signals. A five-candle pattern completes after the move has resumed, which places the stop far from the entry.
- Near-random gap versions. The gap three methods patterns tested opposite to their names.
- Definitions vary. Shadow containment, third-candle colour and gap rules differ between sources, and tools may skip the trend check.
- Weak academic support. Most systematic tests find little edge after costs.
Similar Patterns Often Confused With Three Methods and Three Outside Patterns
Several similar patterns get mistaken for three methods and three outside patterns, and each is a different test with different results.
| Similar pattern | How it differs | Bulkowski tested behaviour |
|---|---|---|
| Mat hold | Second candle closes above candle 1's close; last candle closes above the high of the prior four | Bullish continuation 78% of the time |
| Three inside up | A small white body inside a tall black body (a harami), then a higher close | Bullish reversal 65% of the time |
| Three inside down | A small black body inside a tall white body, then a lower close | Bearish reversal 60% of the time |
| Bullish or bearish engulfing | The first two candles of an outside pattern without the third | Tested as its own pattern |
| Morning star and evening star | A small middle candle that gaps away from the first, then a strong third candle | Tested as its own pattern |
| Three black crows | Three tall black candles in an uptrend, each opening within the prior body and closing near its low, making new lows | Bearish reversal 78% of the time |
| Upside and downside Tasuki gap | A gap followed by a candle that only partly fills it | Bulkowski lists it as the look-alike for the gap three methods |
The inside and outside pairs are the most common mix-up. An inside pattern starts with a small candle sitting within a big one; an outside pattern starts with a big candle swallowing a smaller one. They tell opposite stories about the second session, which is why they test differently.
Related lesson: Three soldiers and three crows
Common Mistakes When Trading These Patterns
The common mistakes with these patterns are decision errors, and each one has a rule that catches it.
| Mistake | How it shows up | The rule that catches it |
|---|---|---|
| Entering before the pattern completes | Shorting on candle 3 or 4 of a falling three methods because the bounce looks weak | No pattern exists until the final candle closes |
| Calling a gap pattern a staircase | Reading two tall candles and a gap fill as rising three methods | Count the candles first: five is a staircase, three with a gap is a gap fill |
| Loose containment | The middle candles leave candle 1's range and the trader counts it anyway | Write down whether bodies only or bodies and shadows must stay inside |
| Ignoring the trend | Buying a three outside up in a sideways range | Apply a mechanical trend rule before checking the shape |
| Stop inside the pattern | Stop at the fifth candle's high instead of the pattern high | Set invalidation beyond the whole pattern's extreme |
| Trading against the larger trend | Buying a 5-minute rising three methods inside a daily downtrend | Check the higher timeframe first |
| Treating tested rates as win rates | Assuming a 75% reversal rate means 75% winning trades | Price the entry and stop, then measure your own win rate |
| Switching entry rules mid-sample | Using the close entry after a loss and the confirmation entry after a win | Keep one entry route for the whole sample |
Trading Candlestick Patterns on Intraday Futures Charts
Trading candlestick patterns such as three methods and three outside up on intraday futures charts is a different setting from the daily stock charts behind most of the statistics. Bulkowski's rates and most academic results come from daily bars on stocks, so treat them as background rather than as numbers that carry over to a 5-minute MES chart.
Three practical adjustments help. Use session-aware bars, because a bar that spans a session break can create a gap that does not exist in continuous trading. Expect the gap three methods patterns to appear mostly at the open. And size in micros when a pattern's stop is wide, because a 25-point falling three methods on the full-size E-mini S&P 500 risks ten times the dollars of the MES version.
On our accounts, every position has to be closed by 4:45 PM ET on regular trading days, with no overnight or weekend holds, so a daily staircase or outside pattern is context and the trade itself happens on an intraday chart. Our 50K accounts allow up to 4 minis or 40 micros, with 10 micros counting as one mini, which is why sizing a wide pattern in MES matters. WealthCharts on our accounts includes Chart Replay for practising pattern reads on past sessions, and our evaluation and funded accounts are simulated.
A Routine for Testing Each Candlestick Pattern
A testing routine for rising and falling three methods, the two gap three methods patterns and three outside up and down turns them from chart decoration into something you can measure.
- Name the family: five candles with a small middle section is a staircase, three with a gap is a gap fill, three with an engulfing body is an outside pattern.
- Apply your mechanical trend rule and skip the pattern if it fails.
- Measure body sizes against the average range and check containment or engulfment.
- Wait for the final candle to close.
- Mark the stop beyond the whole pattern and the measure rule target, and note the stop to target distance.
- Enter with your one chosen route and size from the risk per contract.
- Log entry, stop, size, exit and costs for every instance, and review after at least 30 instances.
If 30 instances take a year to collect, that tells you something too: the pattern is a rare event, and your time is better spent on the common ones.
Frequently Asked Questions About These Patterns
What is the falling three methods candlestick pattern?
Falling three methods is a five-candle bearish continuation pattern. A tall black candle is followed by three small candles drifting higher inside its range, then a tall black candle closes below the first candle's close. It represents a short pause in a decline after which sellers return. Bulkowski found it continued lower 71% of the time from 64 samples.
What is the difference between three methods and three outside patterns?
Three methods patterns are continuation patterns: a pause inside a trend that resolves in the trend's direction. Three outside patterns are reversal patterns built on an engulfing candle plus a confirming third candle. One says the move is still working, the other says it stopped.
What do three red candles mean?
Three tall red candles in a row after a rise usually mean a possible bearish reversal, the pattern called three black crows. Each candle opens within the prior body and closes near its low, and Bulkowski found it acting as a bearish reversal 78% of the time. Three red candles in a downtrend are simply a continuing decline.
What is a 3 bar pattern?
A 3 bar pattern is any candlestick formation defined by three consecutive candles. Three outside up, three outside down and the two gap three methods patterns are all 3 bar patterns. Rising and falling three methods are not, because they need five candles.
Can a dragonfly doji be bearish?
Yes, depending on where it appears. Investopedia notes that a dragonfly doji after a price advance warns of a potential decline, confirmed if the next candle closes lower. After a downtrend, the same candle is read as a possible bullish reversal.
What are three ways to trade three methods and three outside patterns?
The three common ways to trade a completed three methods or three outside pattern are entering at the final candle's close, entering on a break of the final candle's extreme as confirmation, or placing a limit order for a partial retrace. Each uses the same stop beyond the pattern, and each changes the break-even win rate. Choose one and test it consistently.
Is three outside up the same as three white soldiers?
No. Three outside up starts with a bearish candle that a bullish candle engulfs, then a higher close. Three white soldiers is three bullish candles in a row, each opening within the prior body and closing higher than the last. Both are read as bullish reversals after a decline.
Risk Note on Trading Candlestick Patterns
Trading futures involves substantial risk of loss and is not suitable for everyone, and the leverage in futures means a loss can be larger than you expect. A stop order does not guarantee your exit price, and fast markets can fill far from the level you set. Every price, account balance, cost and position size in this guide is an illustrative example, not a record of a real trade or a promise of any result. Evaluation and funded prop firm accounts are simulated, and simulated results do not represent live trading. This guide is general education, not investment advice.


