




TL;DR: Harami candlestick patterns are two-candle stalls with a small body inside a big one, and the key choice is when to act on them. A bullish harami follows a decline and a bearish harami follows a rise. Tested reversal rates sit near 53%, so the invalidation price matters more than the shape. Confirmation improves the read but can cost most of the reward on a near target.
Harami candlestick patterns show up constantly, which is exactly why they cause trouble. You see a big red candle, then a small green one tucked inside it, and it is tempting to call the bottom. The pattern is telling you something real. It is just a smaller claim than most traders hear, and the gap between the two is where the losses come from.
This guide covers how to identify a harami with measurable tests, the bullish, bearish and cross variants, how it compares with engulfing and inside bar patterns, what the published testing found, and one worked futures example that prices three entry choices before the trade is taken.
What Harami Candlestick Patterns Are
A harami is a two-candle pattern. The first candle, often called the mother, is long and moves in the direction of the existing trend. The second candle, the child, is small enough that its real body (the open-to-close part of the candle) sits inside the real body of the mother. Harami is Japanese for pregnant, which is where the mother and child names come from.
That is the whole definition, and it says less than people think. A harami does not claim the trend has turned. It claims the side that had been winning stopped making progress for one candle at that price.
There are two directional readings, and location decides which one applies:
- A bullish harami forms after a decline: a long bearish candle, then a small candle inside its body.
- A bearish harami forms after a rise: a long bullish candle, then a small candle inside its body.
- A harami cross is either version with a doji (open and close at or near the same price) as the child.
The harami is the opposite of an engulfing pattern. In an engulfing pattern, the second body swallows the first and the pattern expands. In a harami, the second body is contained and the pattern contracts.
Harami patterns are one family among many. Thomas Bulkowski's published testing ranks 103 candlestick patterns, and the widely used TA-Lib library has 61 candlestick pattern recognition functions, including separate ones for the harami and the harami cross.
How to Identify a Harami Candlestick on a Chart
Spotting a harami by eye is easy. Spotting one that qualifies is a matter of arithmetic. Two candles can look contained on a zoomed-out chart and fail the test once you read the four prices.
Bulkowski's identification guideline for the bullish harami is simple: a tall bearish candle in a downward trend, then a bullish candle nestled within the body of the prior candle, with the shadows ignored. The tops or bottoms of the two bodies can be the same price, but not both. Academic tests use the same core rule. Tharavanij, Siraprapasiri and Rajchamaha define the bullish harami as the second body sitting inside the first body, with the first body larger, in a downtrend.
Six harami recognition tests
The tests below turn that description into something you can check and log. Body containment is the definition. The others are conventions that tighten it, so write down which ones you use before you look at a chart.
- Prior trend. A bullish harami needs a decline into it and a bearish harami needs a rise. Inside a flat range, the same two candles carry no directional claim.
- Mother size. The mother should be a long candle for that chart, with a body that fills most of its range. A body of at least half the range is a common convention.
- Body containment. Both ends of the child's body sit inside the mother's body.
- Range containment. The child's high and low also sit inside the mother's high and low. This is stricter and optional, but it keeps the pattern's extreme at the mother candle, which is where the stop goes.
- Child size. The child body is a small share of the mother body. Sources agree smaller reads stronger, but few give a number, so pick one and record the measured value.
- Child open. The child classically opens against the prior move, above the mother's close in a bullish harami.
Measuring a harami on an ES chart
Here is an illustrative bullish harami on a 15-minute E-mini S&P 500 (ES) chart. The prices are round levels chosen for the example, not a record of a real session. The market fell from a swing high at 7,690.00, bounced to a lower high at 7,672.00, then dropped into 7,620.00.
| Harami test | Requirement | Measured on the example | Result |
|---|---|---|---|
| Prior trend | Decline into the pattern | Lower high at 7,672.00, then a drop to 7,620.00 | Pass |
| Mother size | Long body that fills most of its range | Opens 7,652.00, closes 7,622.00, a 30.00 point body in a 34.00 point range (88.24%) | Pass |
| Body containment | Child body inside mother body | Child body 7,630.00 to 7,636.00 inside 7,622.00 to 7,652.00 | Pass |
| Range containment | Child high and low inside mother high and low | Child range 7,626.00 to 7,640.50 inside 7,620.00 to 7,654.00 | Pass |
| Child size | Child body a small share of mother body | 6.00 point body, 20.00% of the mother body | Pass |
| Child open | Child opens against the decline | Opens 7,630.00, which is 8.00 points above the mother close | Pass |
Notice what the table does not say. It does not say the trade works. It says these two candles meet a stated definition, which is the only honest starting point.
The Bullish Harami Pattern
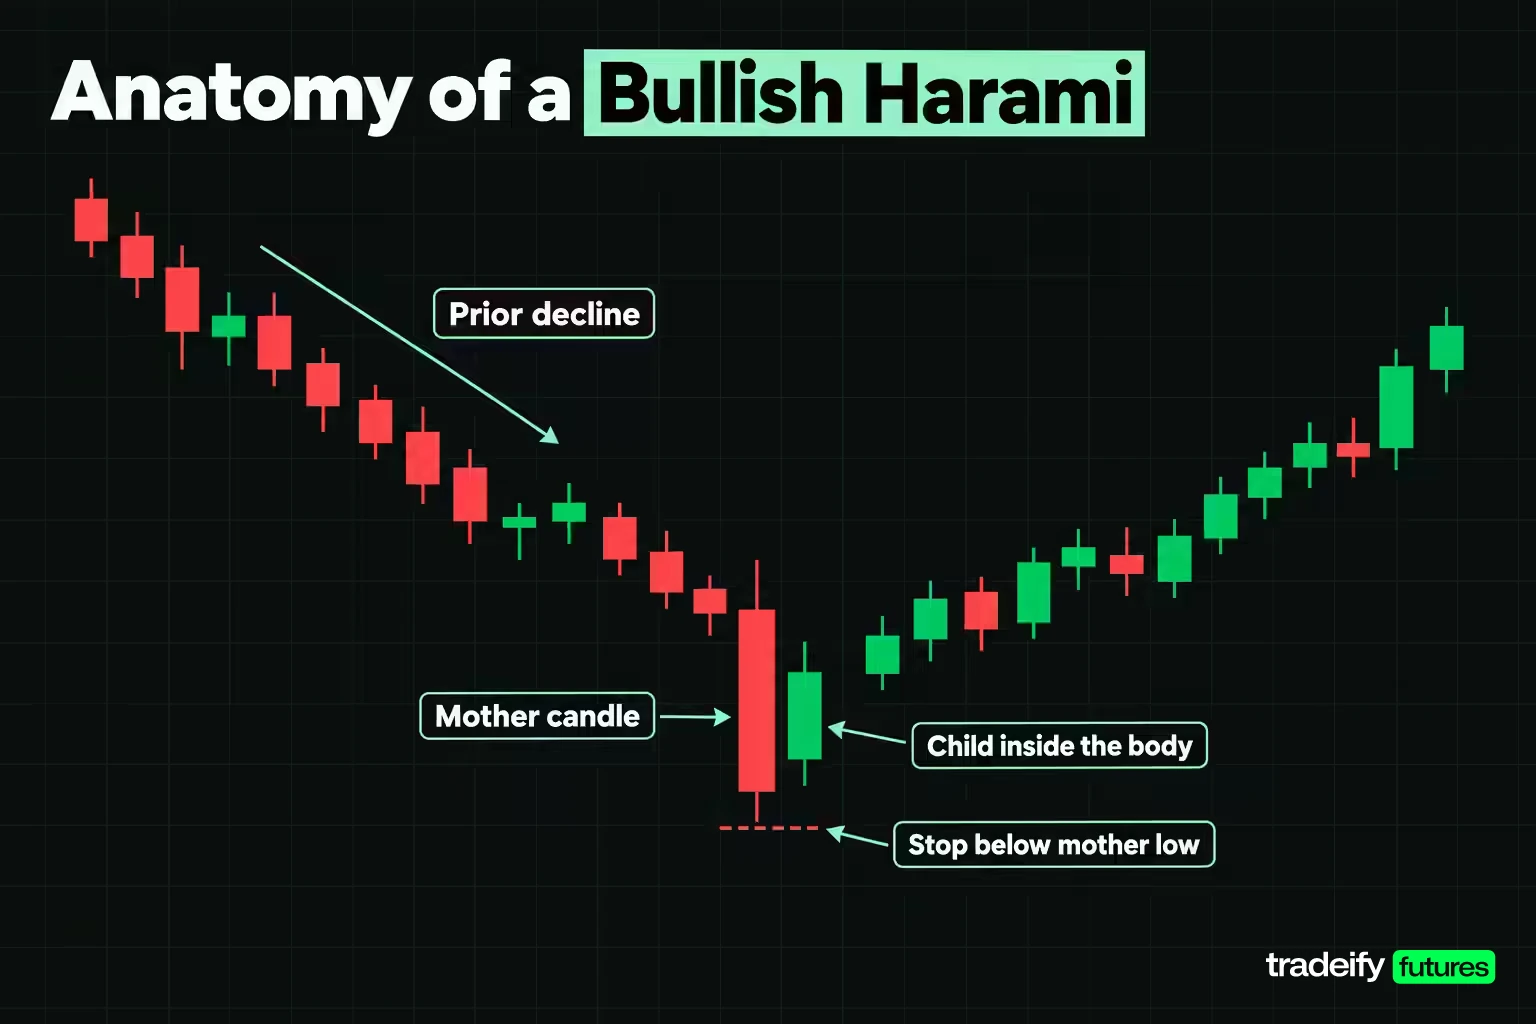
The bullish harami appears after a decline. The first candle is a long bearish candle that extends the selling. The second is a small candle, usually bullish, that opens above the first candle's close and stays inside its body.
Read the two candles as a short story. On the mother candle, sellers had control from open to close. On the child, they could not even push price back to that close. Buyers did not take the market back either. They simply stopped the bleeding for one candle. That is a pause, and pauses can resolve in either direction.
Bulkowski's notes on where the bullish harami tends to do better are practical. Candles near the yearly low performed best in his data, and he suggests selecting tall candles, meaning a mother that is long relative to recent bars. Both points say the same thing: the pattern carries more weight when it forms after a real move into a meaningful area, not in the middle of nowhere.
The invalidation is where traders tend to get loose, usually because a tighter stop makes the trade look better. The bullish harami's claim is that the mother's low held. So the natural stop goes one tick under the mother low. A stop inside the pattern, such as under the child low, can be taken out before the pattern's own claim has even been tested.
The Bearish Harami Pattern
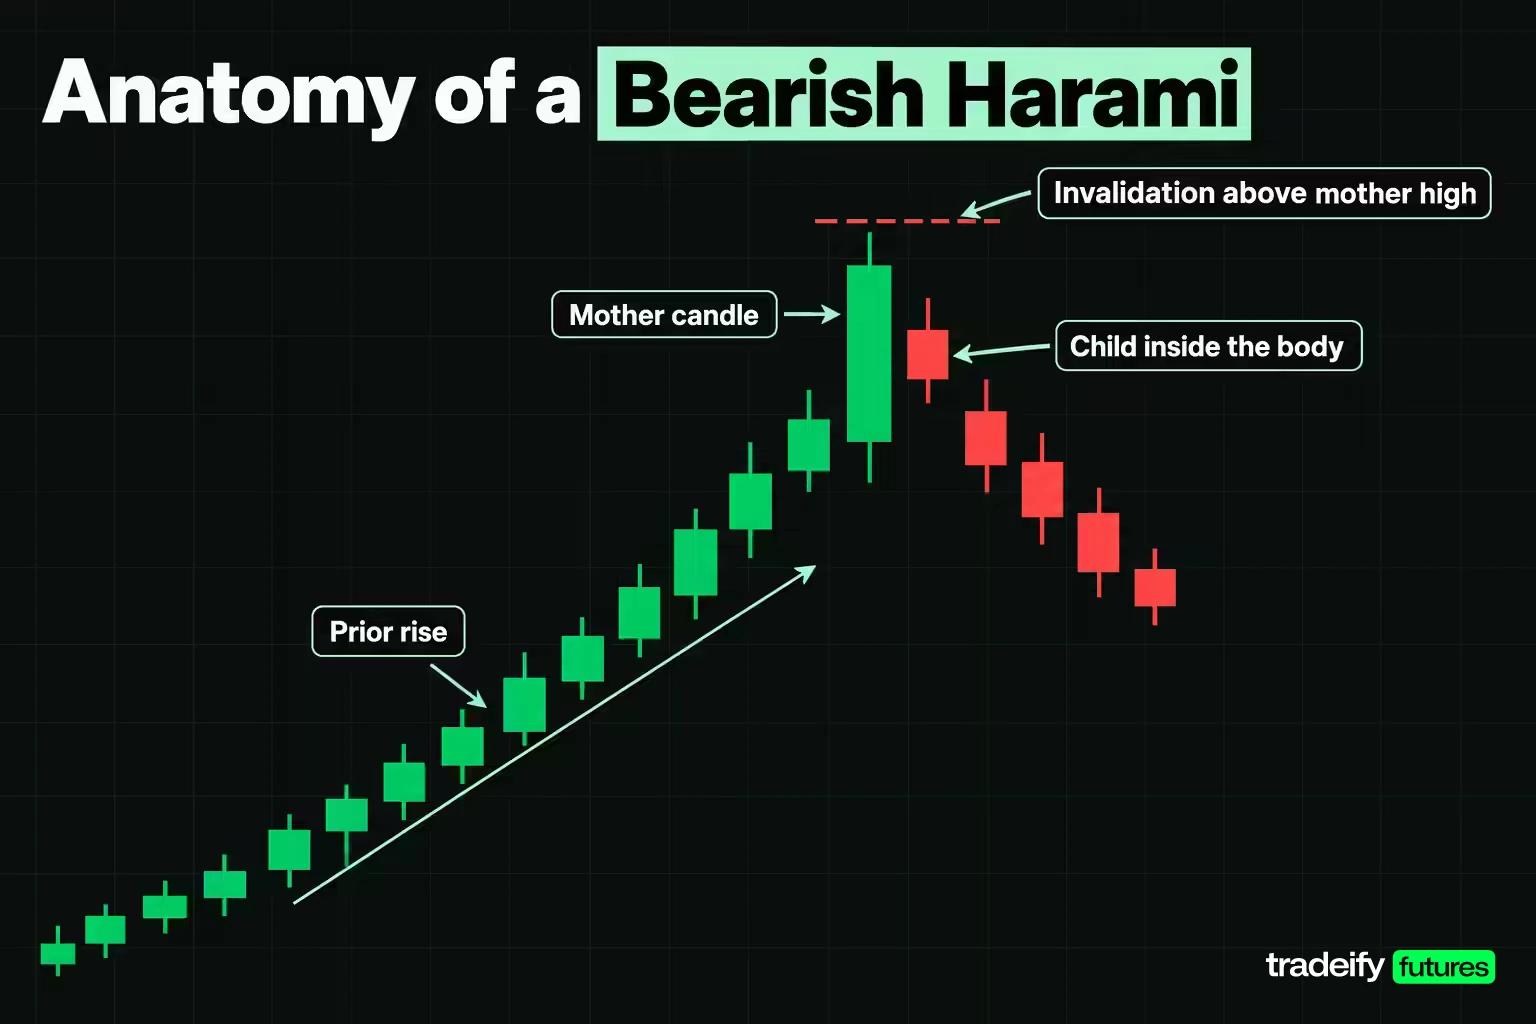
The bearish harami is the mirror image. It forms after a rise, with a long bullish candle followed by a small candle, usually bearish, whose open and close sit inside the first candle's body. Bulkowski's guideline asks for a tall bullish candle followed by a small bearish one with both its opening and closing prices within the body of the bullish candle.
An illustrative bearish harami on the same ES chart looks like this. The mother opens at 7,700.00, runs to a high of 7,734.00 and closes at 7,730.00, a 30.00 point body in a 36.00 point range (83.33%). The child opens at 7,724.00, which is 6.00 points below the mother close, and closes at 7,716.00. Its 8.00 point body is 26.67% of the mother body, and its 15.00 point range stays inside the mother's range.
The invalidation sits one tick above the mother high, at 7,734.25. A bearish read that ignores that level is just a guess that the top is in.
Why the bearish harami often acts as a continuation
Here is the uncomfortable part. Bulkowski's testing found the bearish harami acting as a bullish continuation 53% of the time, with an overall performance rank of 72 out of 103. The pattern that is supposed to mark a top more often broke out upward and continued the rise.
That does not make the pattern useless. It changes what it means. A bearish harami says buyers hesitated after a strong candle, and in a healthy uptrend hesitation often resolves higher. Bulkowski's own tidbits point to where it works better: near the top of a trend channel, and at the top of an upward retrace inside a larger downtrend, where a downward break rejoins the primary trend.
So the practical rule is to treat a bearish harami as a warning, not a short signal. Wait for a close below the mother low (7,698.00 in the example) before acting on it.
Related lesson: Trendlines and channels
The Harami Cross and Its Doji Child
A harami cross is a harami whose child is a doji, so its open and close are at or near the same price. Bulkowski's guideline for the bullish harami cross is a tall bearish candle in a downtrend followed by a doji that fits within the high-low range of the prior day. That last detail matters. For the cross, he uses the mother's full range, not only its body.
Take an illustrative 15-minute ES harami whose mother candle runs from a high of 7,654.00 to a low of 7,620.00. A cross version would use a doji child that opens and closes at 7,632.00, with a high of 7,637.00 and a low of 7,627.00. Its 10.00 point range is 29.41% of the mother's range.
The cross is usually described as the stronger version because a doji states indecision more clearly than a small body. The testing does not back that up. Bulkowski found the bullish harami cross continuing the prior downtrend 55% of the time, with an overall performance rank of 50. The bearish harami cross acted as a bullish continuation 57% of the time, ranked 80.
A doji child makes the pause easier to see. It does not make the next move easier to predict.
Related lesson: Doji candlestick patterns
Harami Trend Reversal Signals and Confirmation
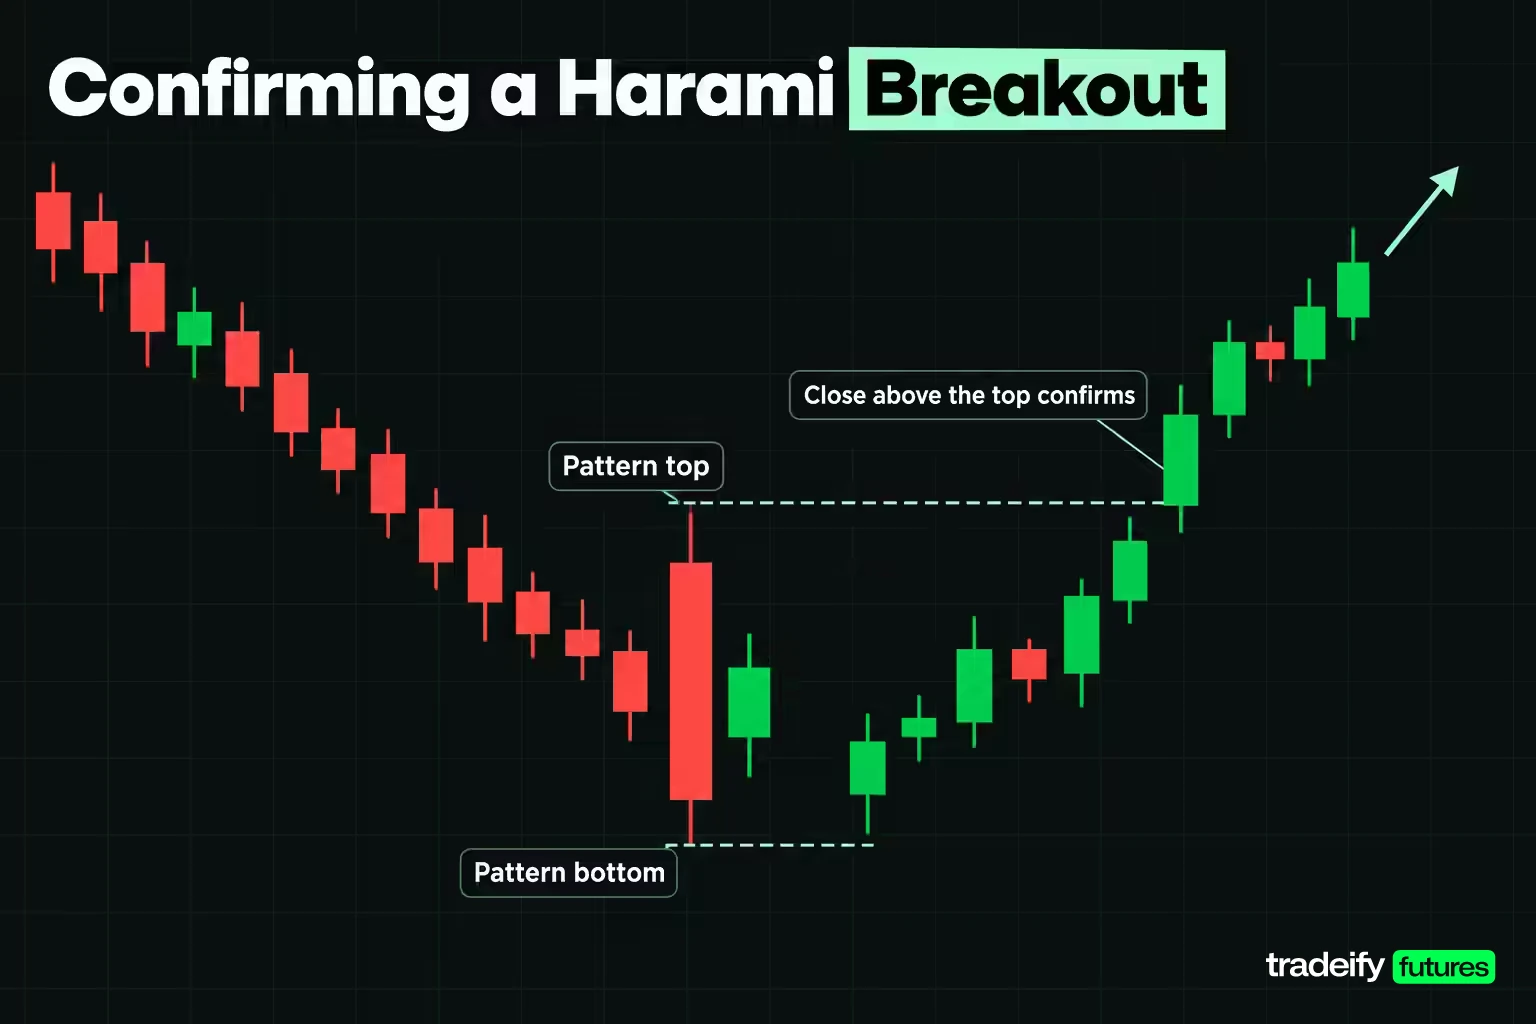
A harami marks a potential reversal, not a confirmed one. The useful way to think about it is as a stall: the trend's last push failed to follow through. Whether that stall becomes a turn depends on what price does next.
Bulkowski's definition of a breakout is the cleanest test available. A breakout is a close above the top of the candlestick pattern or below its bottom. For a bullish harami, the top of the pattern is the mother's high. Until price closes beyond one edge, the pattern has not resolved, and you are trading a guess about which edge breaks first.
Three inside up and three inside down
A harami plus one confirming candle has its own name. The three inside up is a bullish harami followed by a bullish candle that closes above the prior close. Bulkowski tested it as a bullish reversal 65% of the time, with an overall performance rank of 20, against 53% and rank 38 for the two-candle bullish harami. The three inside down, the bearish version, tested as a bearish reversal 60% of the time, ranked 56.
That looks like a clear win for waiting one candle. But a different study complicates it. On Thai SET50 stocks from 2006 to 2016, Tharavanij and co-authors found the three inside up produced winning probabilities of .40 to .50 across their holding periods, no better than the plain bullish harami. One more candle of confirmation helped in one dataset and did nothing in another.
The honest takeaway is this: confirmation reduces how often you act on a harami that fails, and it costs you price. Whether that trade-off pays depends on your target, which the worked example puts in numbers.
Related lesson: Morning star and evening star patterns
Harami vs Engulfing, Doji and Inside Bar Patterns
Several patterns get confused with the harami. The differences are mechanical, so a table settles them faster than a description.
| Pattern | Candles | What the second candle does | How it relates to the harami |
|---|---|---|---|
| Harami | Two | Body sits inside the first body | The baseline: a contraction after a long candle |
| Harami cross | Two | A doji inside the first candle | A harami with an indecision child |
| Engulfing | Two | Body swallows the first body | The mirror image: an expansion instead of a contraction |
| Inside bar | Two | Full high and low inside the prior high and low | Measured on the full range, with no body or trend requirement |
| Homing pigeon | Two | Two bearish bodies, the second inside the first | A bullish harami variant where both candles are bearish |
| Lone doji | One | No second candle required | Indecision on one candle, with no containment test |
The inside bar causes the most mix-ups. A harami is defined on bodies, so a child whose shadow pokes outside the mother's range can still be a harami. An inside bar is defined on the full range, so that same pair would fail. When the child's full range sits inside the mother's range and the bodies are contained too, the pair is both.
Which is more powerful, a harami or an engulfing pattern
Engulfing patterns reverse more often in Bulkowski's testing. The bullish engulfing tested as a bullish reversal 63% of the time and the bearish engulfing 79%, against roughly 53% for the harami. But his overall performance ranks, which measure the move after the breakout, put the bullish engulfing at 84 and the bearish engulfing at 91, both worse than the bullish harami at 38.
So "more powerful" depends on what you measure. Engulfing patterns pick direction more often. The bullish harami's moves after the breakout ranked better. Neither number on its own makes a trade.
Related lesson: Engulfing candlestick patterns
How to Trade a Harami With a Worked ES Example
Every harami trade forces three decisions before the order goes in: where you enter, where you are wrong, and how much size the stop allows. The pattern answers none of them. The example below prices each choice on one illustrative bullish harami on a 15-minute ES chart, using round prices rather than a real session.
The contract specs come from CME Group. The E-mini S&P 500 (ES) is worth $50 per index point with a minimum tick of 0.25 points ($12.50). The Micro E-mini S&P 500 (MES) is worth $5 per index point, with the same 0.25 point tick worth $1.25, so one MES is one tenth the size of one ES.
The market fell from 7,690.00 to a lower high at 7,672.00 and then into 7,620.00. The mother candle opens at 7,652.00, runs from a high of 7,654.00 down to 7,620.00 and closes at 7,622.00. The child opens at 7,630.00 and closes at 7,636.00 with a high of 7,640.50 and a low of 7,626.00. The stop goes one tick under the mother low at 7,619.75. The target is the prior lower high at 7,672.00, the nearest level where sellers last took control.
Three harami entry routes compared
| Entry route | Entry price | Risk in points | Reward in points | Reward to risk | Break-even win rate | Risk per MES | Risk per ES |
|---|---|---|---|---|---|---|---|
| At the child close | 7,636.00 | 16.25 (65 ticks) | 36.00 | 2.22 to 1 | 31.10% | $81.25 | $812.50 |
| One tick above the child high | 7,640.75 | 21.00 (84 ticks) | 31.25 | 1.49 to 1 | 40.19% | $105.00 | $1,050.00 |
| One tick above the mother high | 7,654.25 | 34.50 (138 ticks) | 17.75 | 0.51 to 1 | 66.03% | $172.50 | $1,725.00 |
The break-even win rate is risk divided by risk plus reward, before commissions and slippage, which push it higher.
The table makes the confirmation trade-off concrete. Entering at the child close is the cheapest route, with a 31.10% break-even rate, but you act before the pattern has proved anything. Waiting for a break of the child high costs 4.75 points of entry and lifts the break-even rate to 40.19%. Waiting for a full breakout above the mother high, Bulkowski's definition of a confirmed upward break, leaves only 17.75 points to the target and needs a 66.03% win rate to break even.
That last row is the trap, and it catches careful traders more than careless ones. Full confirmation is the most comfortable entry and, against a near target, close to the worst one. If you insist on that confirmation, you need a target further away, which means a different trade idea, not the same one entered later.
Choosing the harami stop
On a long harami entry at the child close of 7,636.00, with a target at 7,672.00, the stop choice moves the numbers almost as much as the entry choice does.
- One tick under the mother low, 7,619.75: 16.25 points of risk, 2.22 to 1, break-even 31.10%.
- At the mother close, 7,622.00: 14.00 points of risk, 2.57 to 1, break-even 28.00%, $70.00 per MES.
- One tick under the child low, 7,625.75: 10.25 points of risk, 3.51 to 1, break-even 22.16%, $51.25 per MES.
The tightest stop looks best on paper. It is also the one most likely to be hit by ordinary noise, because it sits inside the pattern, above the mother low the pattern claims will hold. A better ratio on a stop that does not match the idea is not a better trade. It is a different, weaker idea with a nicer-looking spreadsheet.
Sizing a harami trade from the stop
Size comes from the stop distance and the amount you are willing to lose, not from how good the pattern looks. Take an illustrative $400 risk budget per trade:
- Child-close entry: $81.25 per MES, so 4 MES with $325.00 at risk.
- Child-high entry: $105.00 per MES, so 3 MES with $315.00 at risk.
- Mother-high entry: $172.50 per MES, so 2 MES with $345.00 at risk.
One ES does not fit the budget on any route, because even the cheapest route risks $812.50 per contract. That is why micros exist. They let the stop sit where the pattern says it should, instead of moving the stop to fit a full-size contract.
Related lesson: Position sizing
Confirming a Harami With Indicators and Volume
Many guides pair the harami with an indicator: RSI in oversold territory for a bullish harami, a MACD crossover, a Stochastics turn or rising volume on the child or the next candle. The logic is reasonable. A filter tries to keep only the haramis that form where momentum is already stretched.
The evidence on filters is thinner than the advice. Tharavanij and co-authors tested candlestick patterns on SET50 stocks with Stochastics %D, RSI and Money Flow Index filters. Filtering cut the number of trades, but mean returns and winning probabilities did not significantly increase in general. For two-day bullish patterns, the bullish harami was the best strategy both with and without filters, and filtering left its returns and risks relatively the same.
Volume is harder to test, and no study reviewed here isolates it for the harami. Bulkowski notes that volume gives performance clues for the bearish harami without making it a rule. Treat volume and indicators as filters to test on your own sample, not as confirmation by default.
A filter earns its place when it removes a failure you have actually seen in your log. Adding RSI to a chart does not make a harami in the middle of a range any more meaningful.
Related lesson: Relative strength index
Harami Patterns on Intraday and Daily Timeframes
Most published harami testing uses daily bars. Candlestick analysis is generally considered best suited to daily price series, partly because a daily open and close capture overnight information. Bulkowski's figures and the SET50 study both come from daily data on stocks.
On intraday futures charts, two things change. Haramis become far more common, because a 5-minute chart prints many small candles inside larger ones, and most of them are noise. And the mother and child can straddle a session break, so a gap between them may reflect overnight news rather than a battle between buyers and sellers.
A workable approach is to use the higher timeframe for location and the lower one for timing. Mark the support, resistance and trend on a 60-minute or daily chart, then only take a 5 or 15-minute harami that forms at one of those levels. A harami at a level other traders already watch carries a claim. A harami in the middle of the session's range usually carries none.
Related lesson: Multiple timeframe analysis
Harami trades on accounts with a daily flat rule
On our accounts, every position must be closed by 4:45 PM ET on regular days, with no overnight or weekend holds, so a daily harami is context and the trade itself happens on an intraday chart. Our 50K accounts allow up to 4 minis or 40 micros, which is why sizing a harami trade in micros matters. WealthCharts on our accounts includes Chart Replay for practicing pattern reads on past sessions, and evaluation and funded accounts are simulated.
How Reliable Are Harami Candlestick Patterns
The tested results are modest, and it is better to know that before you size a trade on them.
Bulkowski's testing on daily data found the bullish harami reversing 53% of the time, with an overall performance rank of 38 out of 103. His best average move 10 days after the breakout was 4.05%, short of the 6% he considers good. The bearish harami acted as a bullish continuation 53% of the time and ranked 72. He describes both as near random on direction.
The SET50 study gives a different angle on the same pattern. Across 975 bullish harami signals on Thai large-cap stocks from July 2006 to June 2016, mean returns were 0.53% after 1 day, 0.64% after 3 days, 0.84% after 5 days and 0.53% after 10 days, all statistically significant. But the winning probability, the share of trades that made money, was only .50 to .53. And the 5-day mean of 0.84% came with a standard deviation of 7.04%. The bearish harami, across 997 signals, produced no significant returns at all.
Other markets point in different directions. In the studies Tharavanij and co-authors review, harami signals generated significant positive abnormal returns on 69 Taiwan Stock Exchange securities from 1998 to 2007, and the bullish harami performed well on highly liquid or small Chinese stocks. Marshall, Young and Rose found no profits from candlestick patterns on Dow Jones Industrial Average stocks from 1992 to 2002.
What harami reliability research means for traders
The published harami research, Bulkowski's daily-data testing and the SET50 stock study, leads to three practical points.
- In the SET50 study, the bullish harami's edge came from wins being somewhat larger than losses, not from winning more often, with winning probabilities of .50 to .53. A trade that wins about half the time needs its winners to be larger than its losers, which is why the stop and target decide the outcome more than the pattern does.
- The bearish harami showed no reliable edge as a short signal in either Bulkowski's testing or the SET50 study. Waiting for a close below the mother candle's low is the minimum.
- Both studies are mechanical tests on daily stock data: enter at the pattern and exit on a fixed rule. None tested a confirmed intraday futures entry, so your own logged sample is the only evidence that applies to how you trade it.
Related lesson: How to keep a trading journal
Harami Pattern Pros and Cons
Harami patterns are easy to define and easy to find, which helps you build a sample. They are also weak on direction, which limits what that sample can show.
Advantages:
- It is easy to define precisely. Body inside body is a rule you can test, log and automate.
- It appears often. Bulkowski gives the bullish and bearish harami frequency ranks of 25 and 26, so you will see enough of them to build a sample.
- It gives a natural invalidation level at the mother's high or low, which makes the stop decision less arbitrary.
- It flags a loss of momentum early, before a larger reversal pattern finishes forming.
Disadvantages:
- Direction is close to a coin flip in Bulkowski's published testing, at about 53% either way.
- The bearish harami more often acted as a continuation than as a top.
- Waiting for confirmation can consume most of the reward when the target is near.
- On intraday charts, most contained pairs are noise unless they sit at a level that matters.
- A harami says nothing about how far price will go after it resolves.
Common Harami Trading Mistakes
Most harami losses come from decision errors, not recognition errors. You saw the pattern correctly and still took the wrong trade. Each mistake below has a rule that catches it.
| Harami mistake | What it looks like | The rule that catches it |
|---|---|---|
| Trading a harami in a range | Two contained candles in a market going nowhere | Confirm the prior trend first. No decline, no bullish harami |
| Moving the containment threshold | Accepting a child body that fills most of the mother because the setup looks good | Write your maximum child size as a percentage in advance and log the measured value |
| Shorting every bearish harami | Selling into an uptrend on the strength of two candles | Treat it as a warning and wait for a close below the mother low |
| Stopping inside the pattern | A stop under the child low, above the mother low the pattern claims will hold | Put the stop one tick beyond the mother's extreme |
| Paying for confirmation without pricing it | Waiting for a break of the mother high with a target 17.75 points away | Price each entry route before the trade and skip setups where confirmation leaves too little reward |
| Sizing to the pattern instead of the stop | Choosing contracts because the pattern looks clean | Divide the risk budget by the dollar risk per contract and round down |
| Judging the pattern on a handful of trades | Calling the pattern broken or brilliant after five results | Review only after 30 or more logged instances with fixed entry, stop and exit rules |
A six-step harami trading routine
- Mark the prior trend and the nearest support or resistance on a higher timeframe.
- Record the four prices of both candles and check body containment, then range containment.
- Measure the child body as a percentage of the mother body and write it down.
- Set the invalidation one tick beyond the mother's extreme before choosing an entry.
- Price the entry routes against the target and pick the one you will use for the whole sample.
- Size from the stop and the risk budget, then log the result whichever way it goes.
FAQ
What is the bearish harami pattern?
A bearish harami is a long bullish candle followed by a small candle whose body sits inside the first candle's body, after a rise. It suggests buying momentum stalled. Bulkowski's testing found it acting as a bullish continuation 53% of the time, so a close below the first candle's low is the usual confirmation.
Is a harami bullish or bearish?
A harami can be either, depending on the trend before it. After a decline it is read as a bullish harami, and after a rise it is read as a bearish harami. The two candles themselves carry no direction without the trend before them.
What is the difference between a harami and a harami cross?
A harami cross differs from a plain harami only in its second candle, which is a doji. In a plain harami the second candle has a small real body. The doji's open and close are at or near the same price. The cross shows indecision more clearly, but testing has not shown it reversing more reliably.
Which candle is more powerful, harami or engulfing?
Engulfing patterns reverse more often in Bulkowski's testing, at 63% bullish and 79% bearish against about 53% for the harami. His overall performance ranks, which measure the move after the breakout, favour the bullish harami at 38 over both engulfing patterns. Neither pattern is a complete trade on its own.
How many candlestick patterns are there?
There is no fixed number, because different authors name different variants. Bulkowski's testing ranks 103 candlestick patterns, and the TA-Lib library recognises 61. Most traders use a small set of single, two and three-candle patterns.
What is the strongest bearish pattern?
In Bulkowski's overall performance ranking, three black crows is the strongest bearish reversal, at 78% and rank 3, followed by the evening star at 72% and rank 4. No pattern is strongest in every market. The bearish harami ranks 72 of 103.
How do you confirm a harami pattern?
The most common confirmation is a close beyond the mother candle, above its high for a bullish harami or below its low for a bearish one. A softer version is a break of the child's high or low. Each step of confirmation costs entry price, so check the reward left to your target first.
Harami Pattern Trading Risk
Trading futures involves substantial risk of loss and is not suitable for everyone, and leverage means a loss on one trade can be larger than you expect. A stop order does not guarantee your exit price, and fast markets can fill well past the level you set. Every price, account figure and position size in this guide is an illustrative example, not a record of a real trade or a promise of any result, and the published test results describe historical stock samples that may not repeat. Evaluation and funded prop firm accounts are simulated, and simulated results do not represent live trading. This guide is general education, not investment advice.


