




TL;DR: A rising wedge is two up-sloping trendlines that converge, and in Bulkowski's sample it broke down 60% of the time. 51% of those downward breaks failed to move 5%, so wait for a close below the lower line. Put the stop above the highest peak, target the lowest valley and size from that stop. A falling wedge is the mirror image and broke upward 68% of the time.
A rising wedge puts you in an awkward spot. Price is making higher highs and higher lows, the chart looks healthy, and the pattern is telling you to get ready to sell. Short too early and you are fighting an uptrend. Wait for proof and the stop ends up a long way from your entry.
That tension is the whole lesson. This guide covers how to draw a rising wedge and its mirror, the falling wedge, what the published statistics say about how often each one follows through, and how to turn the shape into a stop, a target and a position size you can actually carry.
What a Rising Wedge Is
A rising wedge is a chart pattern bounded by two trendlines that both slope upward and converge. The lower line, drawn through the rising lows, climbs faster than the upper line drawn through the rising highs, so the price range narrows as the pattern matures.
Three shapes share the two-line idea, and the difference between them decides how you read the chart.
- Wedge. Both lines slope the same way and converge.
- Triangle. The lines converge, but they do not slope the same way. In an ascending triangle the upper line is flat and the lower line rises.
- Channel. The lines slope the same way but stay parallel, so the range never narrows.
A rising wedge carries a bearish bias, and a falling wedge (two down-sloping lines converging, with the upper line falling faster) carries a bullish one. Both are expected to break against their own slope.
The bias is counterintuitive. Higher highs and higher lows normally describe an uptrend. In a rising wedge the convergence is the signal: each push higher covers less ground than the last while the lows keep rising underneath, so buyers are paying up for less progress.
Related lesson: Trendlines and channels
Why a Rising Wedge Forms
A rising wedge forms when buying keeps lifting the lows but can no longer extend the highs at the same pace. StockCharts describes the advances off the lower line becoming shorter and shorter, which makes the rallies unconvincing, while the upper line fails to keep pace and signals supply coming in as prices rise.
In plain terms, buyers keep stepping in on every dip, a little higher each time, because the trend has trained them to. Sellers who would have waited for much higher prices start offering sooner. The range compresses between two groups who are both getting more eager, and something has to give.
The resolution comes when the dip buyers stop showing up at the lower line. Once that line breaks, traders who bought the last several dips are all underwater at once, and their exits can add to the move down. That is the story the shape tells. How often the story plays out is a separate question, and the published rising wedge statistics answer it with less confidence than the textbook drawing implies.
How to Identify a Rising Wedge
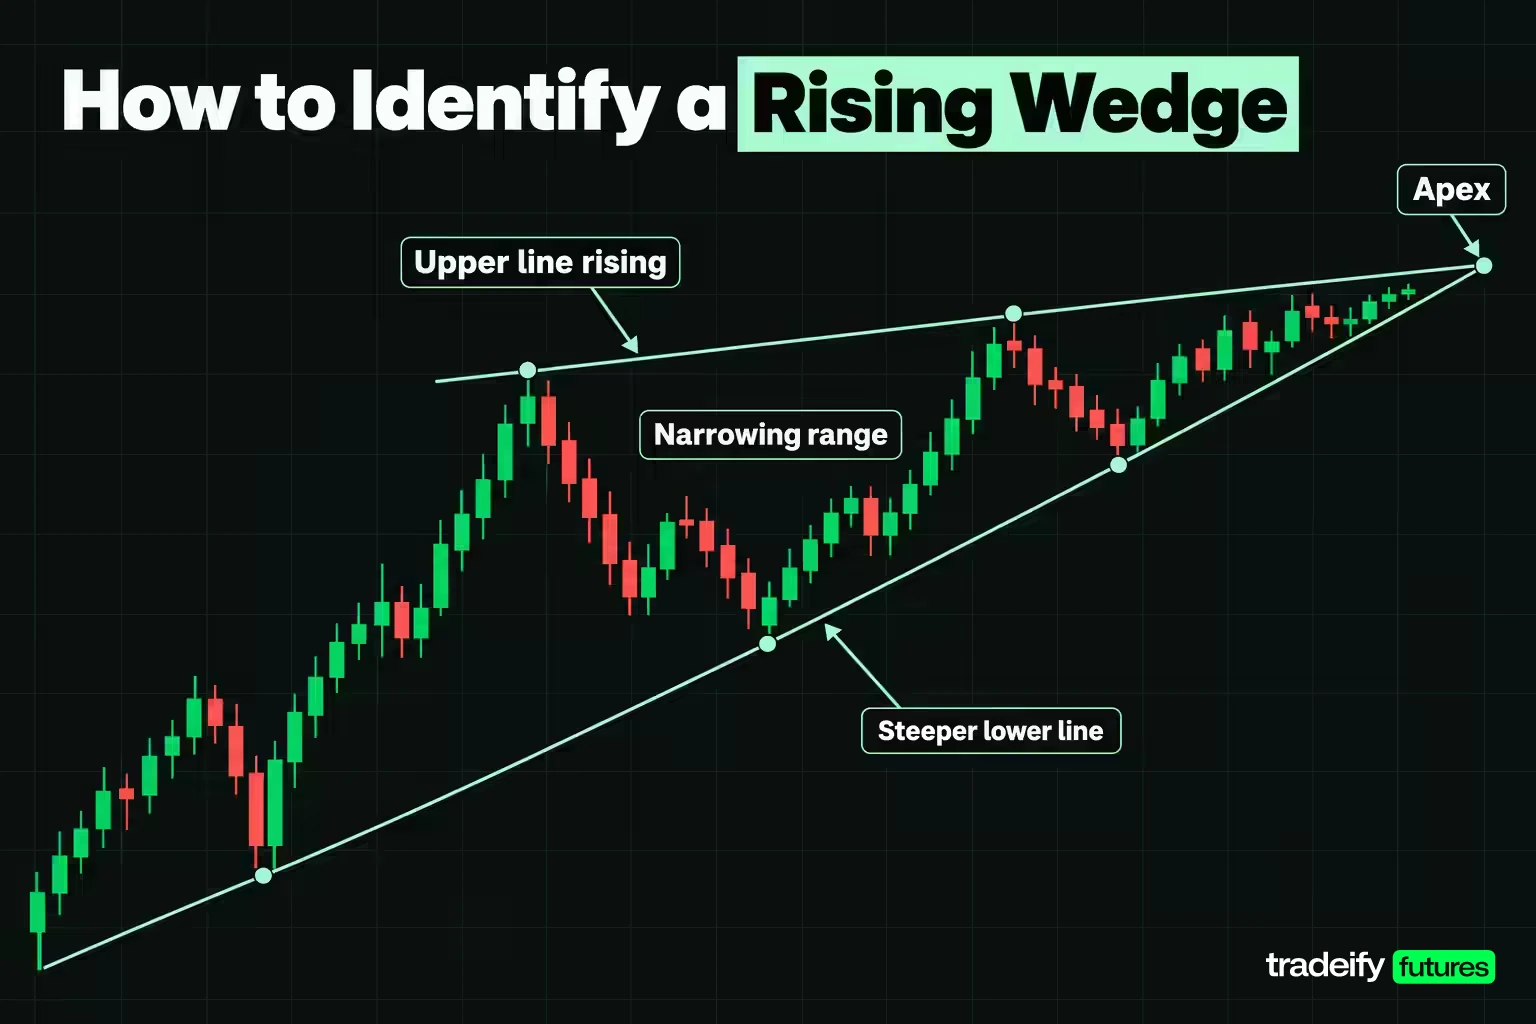
Identifying a rising wedge comes down to five checks, applied in order. Stop at the first one that fails.
- Both lines slope upward. If the upper line is flat, you are looking at an ascending triangle. If it slopes down, the lines are not a wedge.
- The lower line is steeper than the upper. If the upper line is steeper, the range is widening, not narrowing.
- Enough touches. thinkorswim's pattern reference says a decent rising wedge has at least five reversals, three on one trendline and two on the other. Bulkowski's identification guidelines give the same five-touch floor. Two touches per line can be drawn through almost anything.
- Enough time. Bulkowski sets 3 weeks as the minimum duration on daily charts and calls anything shorter a pennant. StockCharts says the pattern usually forms over a three to six month period.
- Real contraction. Measure the gap between the lines at the start and at the latest bar. If it has barely closed, it is a rising channel drawn on a squashed price axis.
The slope test that sets the apex
The two slopes also tell you roughly when a rising wedge should resolve. Divide the opening width by the amount the gap closes per bar and you get the bar where the lines would meet, called the apex. Bulkowski reports that upward breakouts from rising wedges arrive on average 67% of the way to the apex, and thinkorswim says breakouts are generally expected in the second half of the pattern.
Here is that arithmetic on one illustrative opening width of 180.00 points.
| Upper line per bar | Lower line per bar | Gap closed per bar | Lines meet at bar | 67% of the way |
|---|---|---|---|---|
| 2.00 points | 8.00 points | 6.00 points | 30 | 20 |
| 4.00 points | 6.00 points | 2.00 points | 90 | 60 |
| 3.00 points | 4.00 points | 1.00 points | 180 | 121 |
The opening width is identical in all three rows. What changes the timeline is the slope ratio: a 4 to 1 ratio closes in 30 bars, while a 1.33 to 1 ratio needs 180. So before you decide that a rising wedge you marked weeks ago is overdue, run the division. It may be early.
Rising Wedge Reversal vs Continuation
A rising wedge can appear in two very different places on a chart, and the location changes what the pattern means, though not which way it is expected to break.
- Reversal. The rising wedge forms after an advance and slopes up with the trend. A break of the lower line suggests the advance is ending. thinkorswim notes that rising wedges often follow a climax peak, with the rally inside the wedge failing to reach the climax high.
- Continuation. The rising wedge forms inside a downtrend and slopes up against it. The wedge is a weak bounce, and a break of the lower line suggests the downtrend is resuming.
StockCharts puts it plainly: regardless of type, rising wedges are bearish. Wikipedia's summary of the pattern adds that a rising wedge is statistically more reliable when it forms during a primary downtrend, and that inside an uptrend similar structures may resolve as flags or pennants.
That gives you a practical filter. A rising wedge inside a falling market lines up with the larger trend. A rising wedge inside a strong uptrend is asking you to call the top of that trend, which is a harder trade with more ways to go wrong. Bulkowski's guidelines say the trend leading into the pattern can be any direction, so treat the trend as context for how much confidence to give the setup, not as a reason to skip the confirmation.
Related lesson: Market structure, highs, lows and trends
Rising Wedge vs Falling Wedge
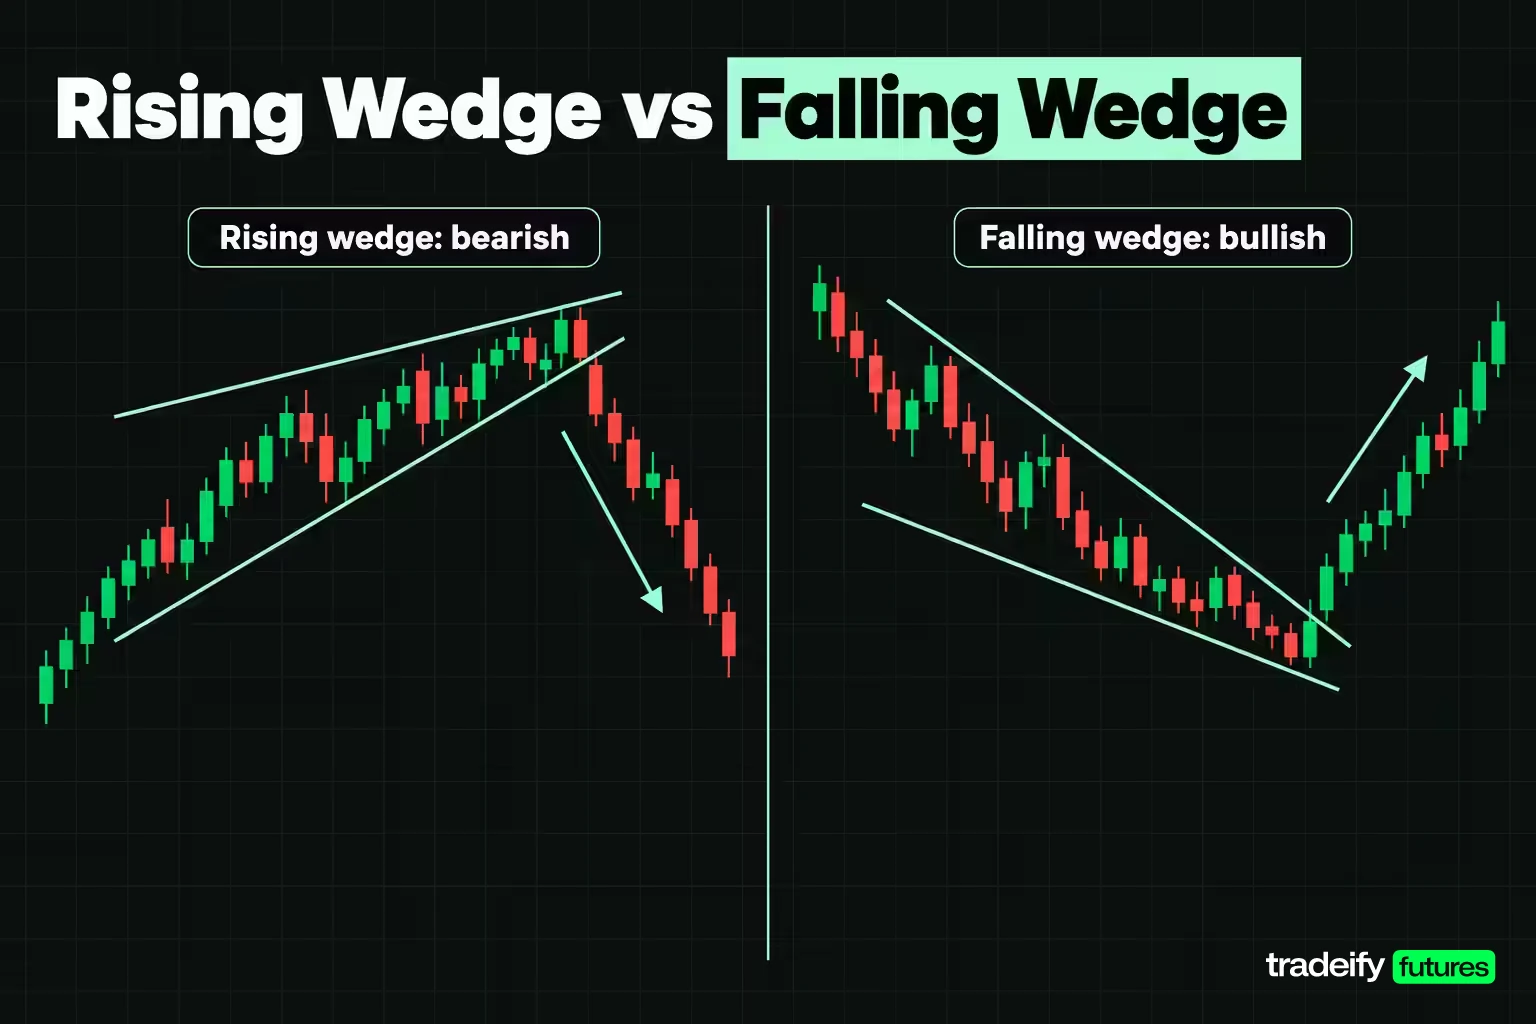
A rising wedge and a falling wedge are mirror images in shape, but the published statistics do not treat them as mirror images in behavior.
| Feature per Bulkowski unless noted | Rising wedge | Falling wedge |
|---|---|---|
| Line slopes | Both up, lower line steeper | Both down, upper line steeper |
| Expected bias | Bearish | Bullish |
| Breakout direction in Bulkowski's sample | Downward 60% of the time | Upward 68% of the time |
| Average break location | 67% of the way to the apex on upward breaks | 61% to 62% of the way to the apex |
| Volume trend before the break | Down 79% of the time | Down 72% to 75% of the time |
| Break even failure rate, expected direction | 51% | 26% |
| Share meeting the price target, expected direction | 32% | 62% |
| Role of breakout volume | StockCharts calls it less important | StockCharts calls it essential |
Read the failure row closely. In Bulkowski's sample the falling wedge's expected break (upward) fails far less often than the rising wedge's expected break (downward). Even so, Bulkowski calls the falling wedge a poor performer among bullish patterns, and says the only variation that works well is a downward breakout in a bear market, which still ranks in the bottom half of his list.
So neither wedge is a strong pattern on its own. If you trade them, you are trading a modest edge at best, and the risk plan has to carry more of the load than the shape does. The falling wedge is the more forgiving of the two, and the rising wedge's downward break is the weakest version of the pair.
Related lesson: Triangles ascending descending and symmetrical
Volume in Rising and Falling Wedges
Volume tells you whether the compression inside a wedge is real. In a textbook rising wedge, volume fades as price climbs, because each push higher draws less participation. Bulkowski found that volume trended downward until the breakout in 79% of rising wedges and in 72% to 75% of falling wedges.
That makes declining volume a description of the pattern, not a confirmation of the trade. Almost every wedge has it. A rising wedge with volume climbing into the third touch of the upper line is a warning that buyers are still committed, and it deserves more suspicion.
The break is where volume adds information. StockCharts treats an expansion of volume on the support break as bearish confirmation for a rising wedge, but says volume is not particularly important on rising wedges overall. For falling wedges it goes further: volume expansion on the breakout is an essential ingredient, and without it the breakout lacks conviction and is vulnerable to failure. Bulkowski's falling wedge data agrees that upward breakouts on heavy breakout-day volume performed better.
The practical rule is simple. On a rising wedge, a heavy-volume break is a plus but not required. On a falling wedge, a quiet breakout is a reason to wait.
Related lesson: What is volume
Using RSI and MACD With a Rising Wedge
Momentum indicators help with one specific question on a rising wedge: is the push to each new high getting weaker? That is what the wedge's shape already implies, and an indicator can show it in numbers.
The two most common tools are these.
- RSI. StockCharts describes the default as 14 periods, the setting Wilder suggested, with readings above 70 treated as overbought and below 30 as oversold. On a rising wedge, the useful signal is bearish divergence: price makes a higher high at the upper line while RSI makes a lower high.
- MACD. The MACD line is the 12-day EMA minus the 26-day EMA, with a 9-day EMA of that line as the signal line. A lower MACD peak against a higher price peak is the same divergence in a different form, and a bearish signal-line cross near the lower line can line up with the break.
Money flow indicators work the same way. In StockCharts' AnnTaylor example, Chaikin Money Flow turned negative before the rising wedge broke and was well below -10% when the support line gave way.
Use indicators as filters, not triggers. Divergence can persist for many bars while price keeps grinding up inside the wedge. The trigger is still the close below the lower line. An indicator only tells you whether that close is more or less worth trusting, and adding a third or fourth indicator does not make an unconfirmed wedge any more confirmed.
Related lesson: Relative strength index RSI
Rising Wedge Success Rate
The best-known published numbers on wedge performance come from Thomas Bulkowski's Encyclopedia of Chart Patterns, summarized on his site with statistics updated in August 2020. They come from stocks in bull markets, based on more than 1,400 rising wedge trades, so treat them as a description of that sample, not a forecast for a futures contract.
| Bulkowski rising wedge measure | Upward break | Downward break |
|---|---|---|
| Break even failure rate | 19% | 51% |
| Average move after the break | 38% rise | 9% decline |
| Throwback or pullback rate | 72% | 72% |
| Percentage meeting the price target | 63% | 32% |
| Overall performance rank | 32 out of 39 | 36 out of 36 |
A few definitions make the table readable. The break even failure rate is the share of patterns that fail to move at least 5% after the breakout, which Bulkowski describes as failing to cover the cost of trading. A pullback is a downward breakout that returns to the breakout price within 30 days; a throwback is the same thing after an upward breakout.
Three things stand out.
- The named direction is the weak one. Downward breaks happen 60% of the time, but 51% of them fail to move 5%, and they rank last of 36 downward-breakout patterns. Bulkowski calls rising wedges some of the worst performing chart patterns.
- The surprise direction is stronger. When a rising wedge breaks up anyway, the record is far better. That is a reason to respect upward breaks, not a reason to buy every rising wedge.
- Most breaks come back. A 72% return-to-breakout rate means most trades will see price revisit the broken line. Bulkowski also notes that throwbacks and pullbacks hurt performance.
Other sources agree in tone. thinkorswim calls rising wedges that break downward one of the least reliable patterns, and StockCharts calls the rising wedge one of the most difficult chart patterns to recognize and trade accurately.
How to Trade a Rising Wedge Breakdown
The clearest way to see how a rising wedge trade works is to price one. The example below uses the E-mini S&P 500 (ES), where one tick is 0.25 index points worth $12.50. The prices are illustrative daily bars built so the geometry can be checked by hand, not a record of a real session.
- Lower line. Starts at 7,000.00 and rises 8.00 points per bar, with touches at 7,000.00 (bar 0), 7,064.00 (bar 8) and 7,128.00 (bar 16).
- Upper line. Starts at 7,180.00 and rises 2.00 points per bar, with touches at 7,188.00 (bar 4) and 7,208.00 (bar 14).
- Apex. The 180.00 point opening width closes by 6.00 points per bar, so the lines meet at bar 30.
- Break. Bar 18 closes at 7,120.00, below the lower line at 7,144.00. That is 60% of the way to the apex.
- Height. Highest peak minus lowest valley, 7,208.00 minus 7,000.00, which is 208.00 points or 832 ticks.
- Stop. One tick above the highest peak, at 7,208.25. A new high above every peak in the pattern means the bearish reading is wrong.
Bulkowski's primary target for a downward break is the lowest valley in the pattern, here 7,000.00. Against that one stop and one target, three entries are available.
| Entry | Entry price | Risk | Reward to 7,000.00 | Reward to risk | Break-even win rate |
|---|---|---|---|---|---|
| Close below the lower line | 7,120.00 | 353 ticks, $4,412.50 | 480 ticks, $6,000.00 | 1.36 to 1 | 42.38% |
| Retest of the broken line | 7,150.00 | 233 ticks, $2,912.50 | 600 ticks, $7,500.00 | 2.58 to 1 | 27.97% |
| Short at the third lower touch | 7,128.00 | 321 ticks, $4,012.50 | 512 ticks, $6,400.00 | 1.60 to 1 | 38.54% |
Comparing the three rising wedge entries
The retest entry has the best numbers because the stop is fixed by the pattern. Entering closer to the stop shrinks the risk while the target stays put. With the lower line projected at 7,152.00 on bar 19, a short at 7,150.00 sells just under the broken line. The catch is that a retest is not guaranteed. Bulkowski's 72% pullback rate means most downward breaks do come back to the breakout price, but some never do, and the trader waiting for the retest simply misses the move.
The touch entry is the impatient one, and it is the one most traders are tempted by. Shorting at 7,128.00 on the third lower-line touch means selling before the pattern has broken, at the exact spot where the lower line has held every time so far. It costs less risk than the confirmed close, but it is a bet that support will fail before you have any evidence that it will.
The confirmed close is the slowest and most expensive in risk, and it is the only entry of the three that waits for the pattern to do what it is named for. Bulkowski's tip is direct: wait for a close outside one of the trendlines before taking a position.
Execution costs matter too, though less here than on tight-stop patterns. Two ticks of slippage on one ES contract is $25.00, which is 0.57% of the 353-tick risk on the confirmed entry. The same two ticks would be 16.67% of a 12-tick risk, which is one reason a wide-stop pattern like a wedge behaves differently from a scalp.
Related lesson: Slippage explained
Rising Wedge Stop Loss and Profit Targets
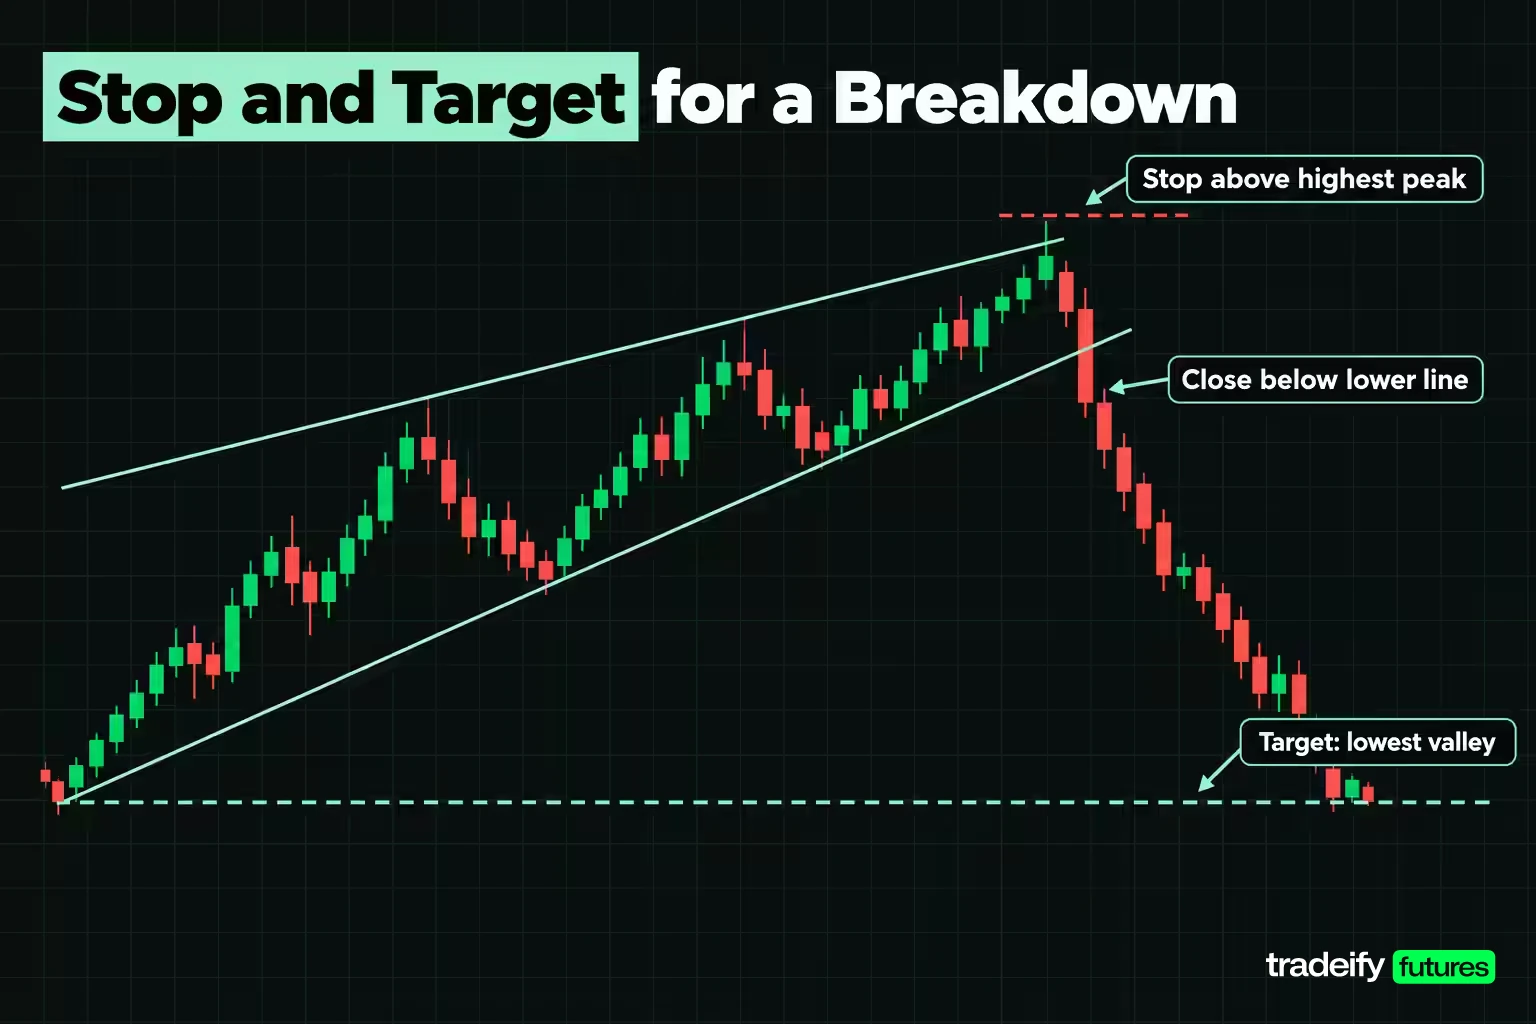
A rising wedge stop goes where the bearish reading is proven wrong, and for a downward break that is above the highest peak in the pattern. In the illustrative ES rising wedge (highest peak 7,208.00, lowest valley 7,000.00, breakout price 7,144.00), that puts the stop at 7,208.25. Some traders tuck the stop just above the broken lower line instead, which is tighter but sits inside normal pullback range, since Bulkowski's sample saw 72% of downward breaks return to the breakout price.
Comparing rising wedge target methods
Targets are where wedge trades are won or lost. StockCharts says there are no measuring techniques to estimate the decline after a rising wedge, while Bulkowski gives two. Here is how three target methods compare from the same 7,120.00 confirmed entry.
| Target method | Target price | Reward | Reward to risk | Break-even win rate |
|---|---|---|---|---|
| Full height below the breakout price | 6,936.00 | 736 ticks, $9,200.00 | 2.08 to 1 | 32.42% |
| Lowest valley in the pattern | 7,000.00 | 480 ticks, $6,000.00 | 1.36 to 1 | 42.38% |
| 32% of height below the breakout price | 7,077.50 | 170 ticks, $2,125.00 | 0.48 to 1 | 67.50% |
The first row is the textbook measured move: the 208.00 point height subtracted from the 7,144.00 breakout price. The third row is Bulkowski's scaled version, which multiplies the height by the 32% of downward breaks that met their target in his sample. That gives 66.56 points, or 7,077.44, which rounds up to the nearest tick at 7,077.50 for a short.
The tension is plain. The full measured move pays 2.08 to 1 but Bulkowski's sample suggests the full move is reached about a third of the time. The scaled target is the one the data supports, and it pays less than the stop risks. Choosing a target is really choosing which assumption about the pattern you trust, and that choice belongs in the plan before the trade, not after price starts moving.
Three reasonable ways to handle it:
- Use the lowest valley as the main target and accept a moderate ratio on the confirmed entry.
- Require the retest entry, which keeps a structural target worthwhile because the risk is smaller.
- Take partial profits at a nearer target and leave a smaller piece for the full height.
Related lesson: Risk-reward ratio
Avoiding False Rising Wedge Breakouts
A false breakout on a rising wedge is a close below the lower line that fails to follow through, and Bulkowski's numbers say to expect plenty of them. In his sample, 51% of downward breaks failed to move 5%. A few filters reduce the damage.
- Use closes, not wicks. Bulkowski's confirmation is a close outside a trendline. An intraday poke through the lower line that closes back inside is not a break.
- Wait for the prior reaction low. StockCharts says it is sometimes prudent to wait for a break of the previous reaction low before treating the rising wedge as confirmed. In the illustrative ES wedge that is the 7,128.00 touch, and the 7,120.00 close clears it.
- Check where the break happens. A break in the first third of the pattern arrives before the lines have done much converging. thinkorswim expects breakouts in the second half.
- Plan for the return. With Bulkowski's 72% pullback rate, price coming back to the broken line is normal. A trade plan that treats any return as failure will get shaken out of most valid breaks.
- Respect the upward break. A rising wedge can break upward, and Bulkowski's numbers for that direction are much better than for the downward break. If price closes above the upper line, the bearish idea is gone.
- Watch for busted patterns. Bulkowski defines a busted pattern as one where price moves no more than 10% after the breakout before reversing to the other side. His falling wedge page describes price sometimes curling back after a downward break and soaring upward.
The common thread is that confirmation costs something. Every filter on this list makes the entry later or the stop wider. You give up a better price to get a better reason, and with a pattern that fails this often, that is usually the right trade to make.
Related lesson: Breakout trading
Trading a Falling Wedge Breakout
A falling wedge trade runs the same logic in reverse: long on a close above the upper line, stop below the lowest valley. This illustrative example uses the Micro E-mini Nasdaq-100 (MNQ), where one tick is 0.25 index points worth $0.50.
- Upper line. Starts at 25,180.00 and falls 8.00 points per bar, with touches at 25,180.00 (bar 0), 25,116.00 (bar 8) and 25,052.00 (bar 16).
- Lower line. Starts at 25,000.00 and falls 2.00 points per bar, with touches at 24,992.00 (bar 4) and 24,972.00 (bar 14).
- Break. Bar 18 closes at 25,056.00, above the upper line at 25,036.00.
- Height. 25,180.00 minus 24,972.00, which is 208.00 points.
- Stop. One tick below the lowest valley at 24,971.75. Risk from the 25,056.00 entry is 84.25 points, or 337 ticks, which is $168.50 per MNQ contract.
| Falling wedge target | Target price | Reward | Reward to risk | Break-even win rate |
|---|---|---|---|---|
| Highest peak in the pattern | 25,180.00 | 496 ticks, $248.00 | 1.47 to 1 | 40.46% |
| 62% of height above the breakout price | 25,164.75 | 435 ticks, $217.50 | 1.29 to 1 | 43.65% |
| Full height above the breakout price | 25,244.00 | 752 ticks, $376.00 | 2.23 to 1 | 30.95% |
Bulkowski's primary falling wedge target is the highest peak in the pattern. His scaled target uses the 62% of upward breaks that met their target, which gives 128.96 points above the 25,036.00 breakout price, rounded down to the nearest tick at 25,164.75 for a long.
Two details from Bulkowski's falling wedge data are worth carrying into the plan. A gap upward on the breakout day suggests a better performing wedge, and tall falling wedges performed better than short ones. Throwbacks happened 62% of the time, so expect price to revisit the broken upper line more often than not.
Historical Wedge Examples on Real Charts
Real wedge charts are messier than textbook drawings, which is why two StockCharts case studies, one rising wedge and one falling wedge, are worth reading closely. Both are stock charts from 1998 and 1999.
AnnTaylor rising wedge reversal
From a low around $10 in October 1998, AnnTaylor (ANN) climbed past $23 in less than seven months. The final leg ran from below $15 in February to $23.50 in mid-April, and the rising wedge formed over that leg with three successively higher peaks and three higher lows. The lower line was visibly steeper than the upper line.
The break was not instant. The stock hugged the support line for over a week before breaking with a sharp decline, and the previous reaction low gave way a few days later. Chaikin Money Flow had turned negative in late April and was well below -10% at the break. Afterward, the April reaction low around $20 turned into resistance, and the stock retested it in early July before declining further.
The useful part is the sequence: weak money flow first, a slow grind along support, a close below the line, then the reaction low breaking, then a retest from below. Each step was a separate decision point, and a trader who shorted the first touch of support would have sat through more than a week of nothing before being proven right.
Freeport-McMoRan falling wedge reversal
Freeport-McMoRan (FCX) had been in a downtrend since the third quarter of 1997. The falling wedge formed with four successively lower peaks and four lower lows, but each new low was only slightly lower than the last, a sign that buyers were stepping in almost immediately.
The late February low was flat, and the stock consolidated just above 9 for a few weeks. The March breakout came with a series of strong advances and a positive divergence in the PPO, a momentum oscillator. Upside volume picked up after a heavy-volume decline on February 24, and above-average volume continued through the breakout. After the trendline break there was a brief pullback to support from the trendline extension before the stock advanced further.
The FCX breakout shows why StockCharts calls volume essential for a falling wedge. The breakout did not rely on the shape alone.
Related lesson: Double top and double bottom
Position Sizing for Wedge Trades
A wedge is a wide-stop pattern by construction, because the stop belongs beyond the highest peak or lowest valley rather than a few ticks from entry. That makes position sizing the decision that keeps a wedge trade survivable.
The method is simple: decide your dollar risk budget first, divide it by the risk per contract, and round down. Here is what the illustrative wedges allow at three example risk budgets.
| Contract and stop | Risk per contract | Contracts at $500 | Contracts at $1,000 | Contracts at $2,000 |
|---|---|---|---|---|
| ES, 353-tick stop | $4,412.50 | 0 | 0 | 0 |
| MES, 353-tick stop | $441.25 | 1 | 2 | 4 |
| ES, 233-tick retest stop | $2,912.50 | 0 | 0 | 0 |
| MES, 233-tick retest stop | $291.25 | 1 | 3 | 6 |
| NQ, 337-tick stop | $1,685.00 | 0 | 0 | 1 |
| MNQ, 337-tick stop | $168.50 | 2 | 5 | 11 |
The same rising wedge allows zero ES contracts inside a $2,000 budget and four MES contracts. That is the honest answer on a small account: trade the micro, or skip the trade. Moving the stop closer to make a full-size contract fit does not make the trade smaller. It moves the stop inside the pattern, where normal noise takes it out.
The same math applies to any account with a daily loss limit or trailing drawdown. A single wedge stop that consumes most of a day's allowed loss leaves no room for the pullback the statistics say is likely.
Related lesson: Position sizing
Choosing a Timeframe for Rising Wedges
Rising wedge statistics and definitions are built on daily charts, and that matters when you trade shorter timeframes. Bulkowski's minimum duration for a rising or falling wedge is 3 weeks, and he calls anything shorter a pennant. StockCharts describes the rising wedge as usually forming over three to six months.
A wedge drawn on a 5-minute chart can have the same geometry and the same slope arithmetic, but it sits outside the samples those statistics come from. Treat intraday wedges as a way to frame the structure and locate the break, and size your targets to what the session can realistically deliver instead of borrowing the daily averages.
How rising wedges behave in futures, forex and crypto
The published wedge statistics are stock statistics. Futures, currencies and crypto trade nearly around the clock, react to scheduled data at set times and can gap between sessions, so a wedge in those markets can break on a news release rather than a slow loss of momentum. thinkorswim says wider wedges seem more reliable than narrow ones, and Bulkowski found wide rising wedges and tall falling wedges performed better in his sample, so pattern size is a reasonable first filter in any market. Test any wedge rule on the instrument and timeframe you trade before relying on it.
On our accounts, every position must be closed by 4:45 PM ET and overnight or swing holds are not allowed. A daily rising wedge can shape your bias, but the trade itself has to be planned and finished inside one session, sized within your account's contract limit (a 50K account allows 4 minis or 40 micros). Funded accounts are simulated, and if you use WealthCharts, its Chart Replay lets you practice drawing wedges on historical data bar by bar.
Related lesson: Multiple-timeframe analysis
Rising Wedge Trading Checklist
Run this rising wedge checklist before entering, in order, and stop at the first item that fails. It splits into two parts: checks on the pattern, then checks on the order.
Rising wedge pattern checks
- Both lines slope up, and the lower line is steeper than the upper.
- At least three touches on one line and two on the other.
- The gap between the lines has clearly narrowed since the first touch.
- The pattern meets the duration you are relying on, or you are treating it as an intraday structure with smaller targets.
- You know the trend context, either continuation inside a downtrend or reversal after an advance.
Rising wedge order checks
- Price has closed below the lower line, not just traded through it.
- The stop sits above the highest peak, and you have priced it in dollars per contract.
- The target is chosen in advance, with its reward to risk and break-even win rate written down.
- The position size fits your risk budget with the stop where the pattern says it belongs.
- You know what you will do if price pulls back to the broken line, and what you will do if it closes above the upper line.
Rising Wedge FAQ
Is a rising wedge bullish or bearish?
A rising wedge is bearish. Both trendlines slope up, the lower line rises faster, and the expected break is below the lower line. Bulkowski's data shows downward breaks 60% of the time, so the bias is real but far from certain.
Is a rising triangle bullish or bearish?
A rising triangle, usually called an ascending triangle, leans bullish. Its upper line is flat and its lower line rises, and Bulkowski found it broke upward 63% of the time. The flat ceiling is what separates it from a rising wedge.
What is the most powerful pattern in trading?
No single pattern is the most powerful in every market. Rankings depend on the sample, the definitions and the period tested. In Bulkowski's rankings, rising wedge downward breaks finish last of 36, so pattern popularity and pattern performance are different things.
What is a wedge in trading strategy?
A wedge is a price range squeezed between two converging trendlines that slope the same way. In a trading plan it marks where a break is likely, where the idea is invalidated and which way the bias points.
Is a rising channel bullish or bearish?
A rising channel is bullish while it holds, because its parallel lines describe an orderly uptrend with no built-in reversal signal. If the lines start converging, the channel is turning into a rising wedge.
Does a rising wedge work on a 5-minute chart?
The geometry works on any timeframe, but the published statistics use a 3-week minimum on daily charts. On a 5-minute chart, use the wedge to locate the break and the stop, and size targets to the session.
Rising Wedge Trading Risk
Trading futures involves substantial risk of loss and is not suitable for everyone. Futures are leveraged, losses can exceed what you expect, and a stop order does not guarantee your exit price in a fast market. Every price, risk budget and position size in this guide is illustrative, not a record of a real trade or a promise of any result, and the published pattern statistics come from historical stock samples that may not carry over to your market. Simulated and funded accounts are simulated. This guide is education, not investment advice.


