



TL;DR: Martingale trading doubles the stake after every loss so one win repays the run, and the real question is whether your account survives the streak. On 1,078 ES and NQ trades, doubling from $500 tripled a $100,000 account and then broke a 30% loss limit in eight trades. Reshuffled into other orders, the same trades broke the limit 99.8% of the time. A flat or fixed-fraction stake on the same trades never did.
Martingale trading is a position sizing rule, not a setup. It says nothing about where to enter or exit. It only answers how much to risk next, and after a loss the answer is always "more than last time". That's why it can feel great for weeks and still end the account in one bad stretch.
This guide explains the mechanics and the math, then tests the idea properly. One entry rule is held fixed across ten years of E-mini S&P 500 and E-mini Nasdaq-100 futures, and only the sizing changes. That separates what the ladder does from what the strategy does, which is the comparison most martingale explanations skip.
What Martingale Trading Is and How the Doubling Works

Martingale trading takes a betting system that was popular in 18th-century France and applies it to trade size. In the original game, a gambler bets on a coin, doubles the bet after every loss and goes back to the first bet after a win. The first win recovers every loss in the run plus a profit equal to the original stake.
A few terms make the rest of this page easier to follow:
- Rung. One step of the ladder. The first rung risks 1 unit, the second 2, the third 4, and so on.
- Ladder. The full set of rungs you can afford. A six-rung ladder risks 1, 2, 4, 8, 16 and 32 units, 63 units in all.
- Cycle. Everything from a fresh first rung until either a win resets the ladder or the ladder runs out of rungs.
- Emptied ladder. A cycle in which every rung lost. The whole stack is gone.
In trading, the "stake" is the dollars at risk between entry and stop, not the position's face value. If your stop is 25 points on the E-mini S&P 500 (ES), one contract risks 25 x $50 = $1,250, and one Micro E-mini (MES) risks 25 x $5 = $125. Doubling the stake at the same stop distance means doubling the contract count, so a ladder grows in contracts as well as dollars.
Doubling has a cousin in averaging down. A trader who adds a larger position to a trade that is already losing is running a martingale inside one trade, with the same arithmetic and less visibility.
Related lesson: Leverage explained
The Martingale Trading Math and Expected Value
The martingale trading math starts with a simple formula. In an even-money game where you win 1 unit or lose 1 unit, with loss probability q and a bankroll that covers n doublings, the expected profit per cycle is B(1 - (2q)^n), where B is the first bet. When q is above one half, that number is negative for every ladder length, so the ladder only makes the average loss bigger.
Roulette shows the effect. On an American wheel a red or black bet loses with probability 10/19. A gambler with 63 units can afford six doublings, and the chance of six losses in a row is 2.1256%. Ninety-seven times out of a hundred the cycle wins 1 unit. About twice in a hundred it loses 63. Net, the expected result is a loss of about 0.36 units per cycle.
Martingale Expected Value at a 2R Target
Martingale trading changes one thing that matters: the payoff is not even money. A rule with a 2R target wins twice what it risks, so its break-even win rate is 33.3%, not 50%. On a 2R target, a win on rung k returns 2 x 2^k units against the 2^k - 1 already lost, so the cycle nets 2^k + 1 units.
Run that through the probabilities and a clear result appears. A ladder's expected value per cycle has the same sign as the rule underneath it. A losing rule makes a losing ladder, and a winning rule makes a winning ladder. The ladder multiplies the edge and the capital at the same time.
The table uses the 37.2% win rate measured in the 1,078-trade ES and NQ test on this page, at a 2R target.
| Rungs | Units committed | Chance the ladder is emptied | Cycles between emptyings | Expected R per cycle | Expected R per unit committed |
|---|---|---|---|---|---|
| 1 | 1 | 62.80% | 1.6 | +0.116R | +0.11596 |
| 2 | 3 | 39.44% | 2.5 | +0.262R | +0.08720 |
| 4 | 15 | 15.56% | 6.4 | +0.674R | +0.04495 |
| 6 | 63 | 6.14% | 16.3 | +1.325R | +0.02104 |
| 8 | 255 | 2.42% | 41.3 | +2.353R | +0.00923 |
| 10 | 1,023 | 0.95% | 104.8 | +3.973R | +0.00388 |
| 12 | 4,095 | 0.38% | 265.7 | +6.529R | +0.00159 |
Read the last two columns together. Every rung added raises the expected profit per cycle, which is the number martingale fans quote. Every rung added also raises the capital committed faster, so the return per unit you must hold in reserve falls from +0.11596 at one rung to +0.00159 at twelve. A longer ladder is a less efficient use of the same edge, and that is before any losing streak arrives.
Related lesson: Trading expectancy
How Martingale Losses Grow Exponentially
Martingale losses grow exponentially because each rung is twice the last. After n straight losses you have lost 2^n - 1 units and your next stake is 2^n. Early on the run looks harmless. Then the numbers turn.
| Losses in a row | Next stake in units | Units already lost | Next stake from a $500 start | Total lost from a $500 start |
|---|---|---|---|---|
| 3 | 8 | 7 | $4,000 | $3,500 |
| 5 | 32 | 31 | $16,000 | $15,500 |
| 8 | 256 | 255 | $128,000 | $127,500 |
| 10 | 1,024 | 1,023 | $512,000 | $511,500 |
| 12 | 4,096 | 4,095 | $2,048,000 | $2,047,500 |
The trap is in the first rows. Three or five losses on a $500 start are survivable on a normal account, so the ladder works most of the time and builds confidence. By the tenth loss you would need half a million dollars already spent and another $512,000 ready, all to win back the original $500 plus whatever the target adds.
Martingale trading is therefore a bet that the run you meet will be shorter than the ladder you can fund. The rest of this page measures how long real runs get.
How the Martingale Ladder Test Was Measured
The martingale ladder test on this page holds one simple trading rule fixed and changes only the sizing, so every difference in results comes from the ladder.
- Data. Daily bars for front-continuous E-mini S&P 500 (ES) and E-mini Nasdaq-100 (NQ) futures from January 2016 to November 3, 2026, back-adjusted at each quarterly roll so that contract switches don't create fake gaps.
- Entry. When the previous close is above its 200-session simple moving average, buy the next session's open. ES is checked first and NQ is used when ES has no signal. Only one position is open at a time, so every trade's size can depend on the result before it.
- Exit. The stop sits 0.5 times the 14-session average true range (ATR) below the entry, and the target sits twice that distance above it, a 2R target. If one session touches both, the trade counts as a loss.
- Fills. Exact stop and target prices, with no commission or slippage. Real fills would be worse.
That produced 1,078 trades from October 19, 2016 to November 2, 2026: 1,041 in ES and 37 in NQ. The rule won 401 times, a 37.2% win rate against a 33.3% break-even rate, and made +125R at an average of +0.116R per trade. Its worst stretch was a 33R drawdown from December 27, 2021 to March 15, 2023. The median ES stop was 24.91 points, about $1,245.50 on one ES or $124.55 on one MES.
So the rule has a small, real edge. That gives the martingale its best possible chance. If doubling fails on a rule that makes money, it won't rescue one that doesn't.
Related lesson: Average true range
A Martingale Ladder Worked Trade by Trade
A martingale ladder is easiest to judge on real trades. This worked example runs the first 12 trades of the test on a $100,000 account three ways: doubling from $500 after each loss, a flat $500 stake, and 0.5% of current equity.
| Trade | Entry date | Result | Doubling stake | Doubling balance | Flat balance | 0.5% stake | 0.5% balance |
|---|---|---|---|---|---|---|---|
| 1 | Oct 19, 2016 | -1R | $500 | $99,500 | $99,500 | $500 | $99,500 |
| 2 | Oct 31, 2016 | -1R | $1,000 | $98,500 | $99,000 | $498 | $99,003 |
| 3 | Nov 2, 2016 | -1R | $2,000 | $96,500 | $98,500 | $495 | $98,507 |
| 4 | Nov 3, 2016 | -1R | $4,000 | $92,500 | $98,000 | $493 | $98,015 |
| 5 | Nov 7, 2016 | +2R | $8,000 | $108,500 | $99,000 | $490 | $98,995 |
| 6 | Nov 8, 2016 | -1R | $500 | $108,000 | $98,500 | $495 | $98,500 |
| 7 | Nov 10, 2016 | +2R | $1,000 | $110,000 | $99,500 | $493 | $99,485 |
| 8 | Nov 22, 2016 | +2R | $500 | $111,000 | $100,500 | $497 | $100,480 |
| 9 | Dec 8, 2016 | +2R | $500 | $112,000 | $101,500 | $502 | $101,485 |
| 10 | Dec 12, 2016 | +2R | $500 | $113,000 | $102,500 | $507 | $102,500 |
| 11 | Dec 14, 2016 | -1R | $500 | $112,500 | $102,000 | $512 | $101,987 |
| 12 | Dec 15, 2016 | +2R | $1,000 | $114,500 | $103,000 | $510 | $103,007 |
What Trade 5 Shows About the Martingale Recovery
In this worked martingale example, trade 5 is the one traders remember. Four losses left the ladder $7,500 below its start and $5,500 behind the flat account. The fifth trade risked $8,000, 16 times the flat stake, won $16,000 and put the ladder $9,500 ahead.
That is a real recovery. It also put 8% of the account on one trade after four straight losses, a decision almost nobody would make if the ladder hadn't made it for them. The 0.5% column did the opposite, trimming its stake slightly as the account fell.
Losing Streaks That Break a Martingale Ladder
Losing streaks decide whether a martingale ladder survives, so the ES and NQ test on this page (1,078 trades from 2016 to 2026, a 2R-target trend rule) counted every losing run.
| Losses in a row | Runs of exactly this length |
|---|---|
| 1 | 97 |
| 2 | 70 |
| 3 | 25 |
| 4 | 26 |
| 5 | 19 |
| 6 | 10 |
| 7 | 6 |
| 8 | 4 |
| 9 | 1 |
| 10 | 1 |
| 13 | 1 |
The longest run was 13 straight losses in ES, from December 28, 2021 to January 25, 2022, right before the 2022 decline. Seven runs reached eight losses or more.
Do Losing Streaks Cluster in Martingale Trading?
A common defence of martingale trading is that long streaks are rare and a market that has just lost many times is "due". The 1,078-trade ES and NQ test on this page says otherwise in both directions. In that test, the chance of a loss right after a loss was 61.7%, almost the same as the 62.8% overall loss rate, so losses didn't cluster more than chance. And they didn't need to: when the same 1,078 results were reshuffled into 5,000 random orders, the longest losing run had a median of 13, a 5th percentile of 10 and a 95th percentile of 19. In 62% of the reshuffles a run of 13 or longer appeared.
That's the core problem for any ladder. With the test's 62.8% loss rate, runs of ten or more are not freak events over a thousand trades. They are close to certain, and a run near 19 is a fair planning case.
Surviving a 13-loss run and still placing the winning trade needs 14 rungs, 16,383 units. If the whole ladder must fit inside a 30% loss limit on $100,000, the first stake can be no more than $1.83. Budget for a 19-loss run and the first stake falls to about 3 cents. Neither is a trade you can place in futures.
Related lesson: Risk of ruin
Martingale Risk on a $100,000 Account
Martingale trading risk is clearest when the ladder runs on an account with a hard loss limit. The same 1,078 trades were run on a $100,000 account that stops trading if equity falls 30% below its high-water mark.
| Sizing rule | Ending or breach balance | Return | Worst drawdown | Trades before stop | Largest stake |
|---|---|---|---|---|---|
| Flat $500 per trade | $162,500 | +62.5% | 10.8% | All 1,078 | $500 |
| Double after every loss from $500 | $175,000 at breach | +75.0% | 42.1% | 153 | $64,000 |
| Add $500 after every loss | $317,500 | +217.5% | 22.8% | All 1,078 | $7,000 |
| 0.5% of current equity | $181,592 | +81.6% | 15.3% | All 1,078 | $937 |
The doubling ladder's path is the clearest lesson on this page. By January 23, 2018 it had turned $100,000 into $302,500. Then eight straight losses arrived between January 29 and February 9, 2018, as ES sold off. The stakes ran $500, $1,000, $2,000, $4,000, $8,000, $16,000, $32,000 and $64,000. Those eight trades cost $127,500 and left $175,000, a 42.1% drawdown that blew through the 30% limit on a single $64,000 loss.
The account still showed a profit when it stopped, and that's the dangerous part. A trader judging by the balance alone would have called the system a winner right up to the trade that ended it.
One order of trades is one draw, so the test also reshuffled the same results 2,000 times and counted how often each rule broke the 30% limit:
| Sizing rule | Share of reshuffled orders that breach | Median trade at breach |
|---|---|---|
| Flat $500 | 0% | None |
| 0.5% of current equity | 0% | None |
| Add $500 after every loss | 55.8% | 156 |
| Double after every loss | 99.8% | 40 |
Doubling survived only 0.2% of the reshuffled orders and usually failed within about 40 trades. The add-one ladder, which looked strong on the real order, broke the limit in more than half of the alternatives. A flat or percentage stake never did. The edge was the same in every row, and only the sizing changed.
Related lesson: Maximum drawdown
Martingale Trading in Trending and Ranging Markets
Martingale trading depends on market conditions more than most sizing rules, because the ladder needs a win to arrive before the capital runs out. Conditions that produce long losing runs are the ones that end it.
Strong trends against the position. A ladder that keeps buying into a falling market, or selling into a rising one, can meet one loss after another, because each new entry repeats the same wrong read. In the 1,078-trade ES and NQ test on this page, which only buys above the 200-session average, that filter kept the rule out of most of the 2022 decline: only 27 trades fired that year. Without a filter like that, a long-only ladder would have faced a far longer run.
The turn from trend to decline. That test's longest losing run, 13 trades, came from December 28, 2021 to January 25, 2022, while the filter still said "uptrend" and the market was rolling over. Eight-loss runs also appeared from February 12 to March 3, 2020 and around the February 2018 volatility spike. These are the weeks when a trend rule is most wrong and a ladder is most exposed.
Ranges. Forex martingale systems are usually sold for quiet ranges, where price keeps returning to the middle and a fade often wins on the next try. That works until the range breaks, and a breakout is precisely the event that produces a run of losing fades.
Volatility shocks. When volatility jumps, stops get hit faster and a ladder climbs its rungs in days. In February 2018 the test's doubling account, which risked $500 after a win and doubled after each loss, went from a record high of $302,500 to a breach of its 30% loss limit in under two weeks.
The pattern is uncomfortable for anyone running a ladder. A ladder does best in calm, mean-reverting stretches and worst in exactly the regime changes that matter most, and it has no way to tell them apart.
Related lesson: Trend following
Anti-Martingale and Reverse Martingale Sizing
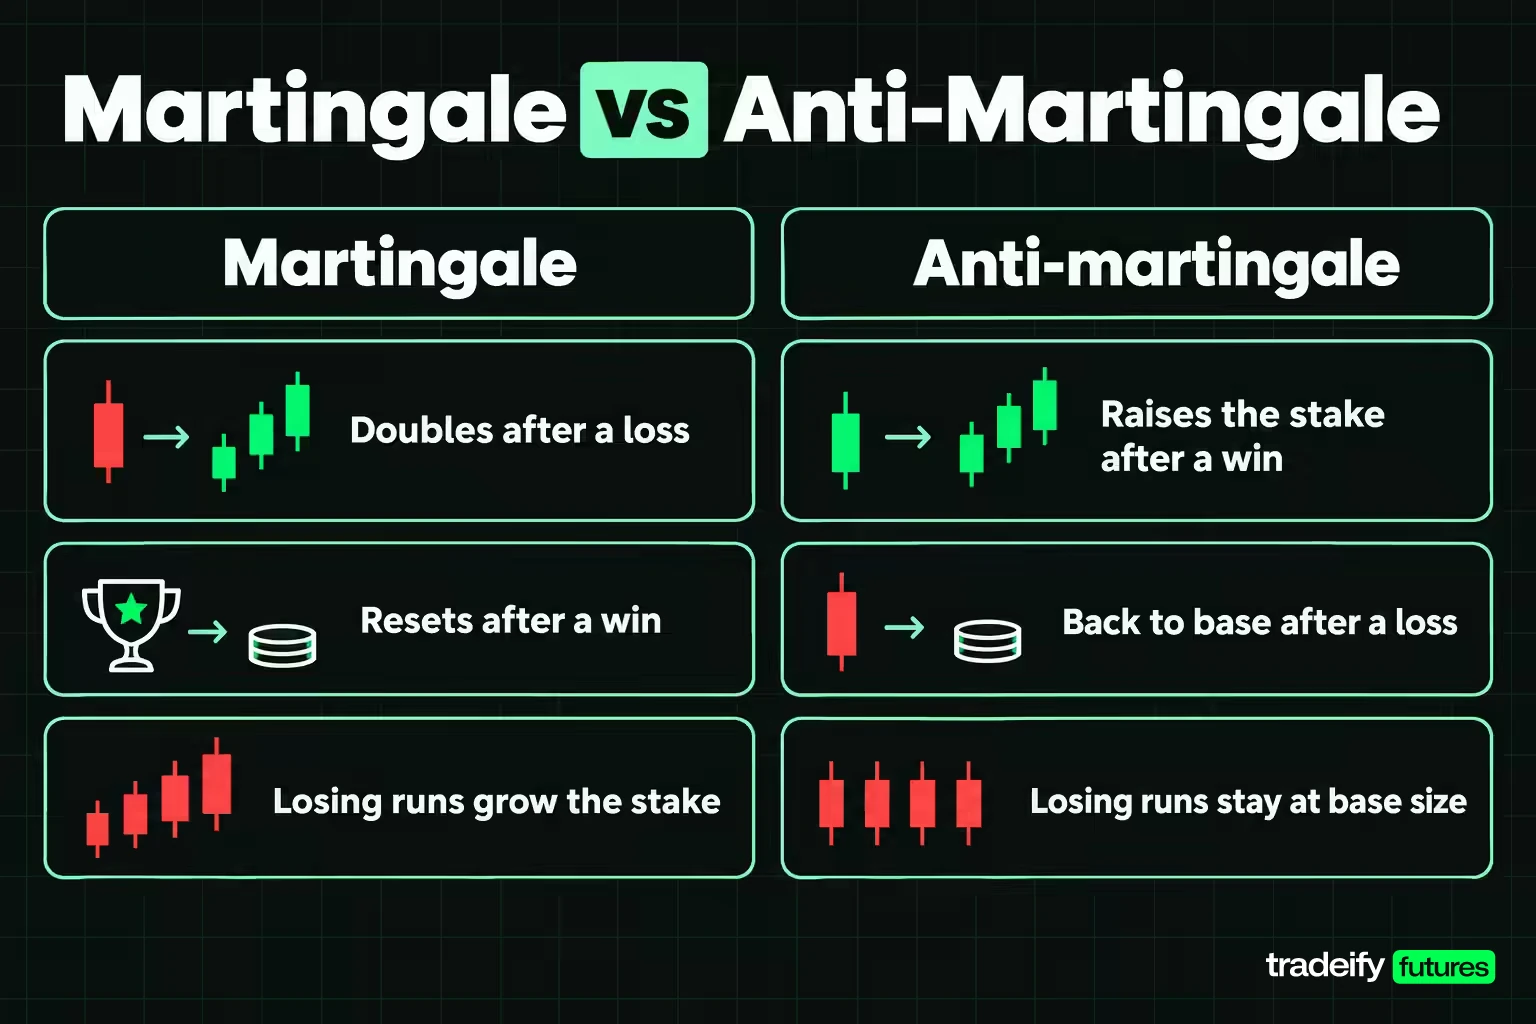
Anti-martingale sizing, also called reverse martingale, flips the rule: raise the stake after a win and drop back to the base stake after a loss. A losing run stays at base size, so the ruin path of the classic ladder disappears. Winning runs compound instead.
The ES and NQ test on this page ran anti-martingale on its 1,078 trades (a 2R-target trend rule, 2016 to 2026) on a $100,000 account with a 30% loss limit from the high-water mark, doubling after each win from $500 and returning to $500 after any loss. Reshuffling means the same results replayed in 2,000 random orders.
| Anti-martingale cap | Largest stake allowed | Return | Worst drawdown | Reshuffled orders that breach |
|---|---|---|---|---|
| 4 units | $2,000 | +107.0% | 11.8% | 4.0% |
| 16 units | $8,000 | +133.0% | 14.9% | 17.4% |
| 64 units | $32,000 | +141.0% | 25.4% | 34.6% |
| Uncapped | $64,000 reached | +109.0% | 25.5% | 61.8% |
A small cap worked well here. At 4 units the anti-martingale beat the flat stake with a similar drawdown and broke the limit in only 4.0% of reshuffles. As the cap rose, the risk climbed fast. The uncapped version survived the real order with a 25.5% drawdown, but it broke the limit in 61.8% of the reshuffled ones.
The reason is simple. After seven wins in a row, the longest winning run in that test (October 27 to December 13, 2023), an uncapped anti-martingale was risking $64,000 on the next trade. One loss there wipes out most of what the run made. Anti-martingale is safer than martingale only when a cap limits the largest stake, and the cap, not the direction, is doing the work.
Related lesson: Position sizing
Pyramid Martingale and Adding to a Winning Trade
Pyramid martingale usually describes adding to a position as it moves, either into a winner or into a loser, so the anti-martingale and martingale ideas show up inside one trade instead of across many.
Pyramiding into a winner adds size as price moves in your favour, often in shrinking steps (for example 3 contracts, then 2, then 1) with the stop moved up behind each add. This is anti-martingale logic applied within a trade. Total risk stays capped if each add is paired with a tighter stop on the whole position.
Adding to a loser buys more as price falls, so the average entry moves toward the market. When each add is larger than the last, it's a martingale: the position grows fastest exactly when the trade idea is failing.
The practical test is the same in both cases. Write down the maximum position and the maximum loss on the whole stack before the first entry. A pyramid that can't exceed a written cap is a plan, and one that keeps adding until the market turns is a ladder.
Related lesson: Scaling in and scaling out
Martingale Pros and Cons
The martingale pros are real, which is why martingale trading keeps attracting traders. The cons are larger and arrive all at once. The figures below come from the 1,078-trade ES and NQ test on this page, run on a $100,000 account with a 30% loss limit.
| Martingale feature | Pro | Con |
|---|---|---|
| Recovery after losses | One win repays a short losing run plus a profit | The repayment is small next to the capital the run committed |
| Win frequency | Most cycles end in a win, about 84% at four rungs in the test | The cycles that lose cost the whole stack |
| Short-run results | Doubling tripled the test account in about 15 months | It then broke a 30% limit in eight trades |
| Effect on edge | Multiplies a positive edge | Multiplies the capital needed faster, so return per unit falls |
| Simplicity | Easy to code and follow | Removes judgment about whether the setup still holds |
The sign of the edge underneath matters most. On a rule with no edge, the ladder doesn't help at all; it only reshapes losses into rare, very large ones. On a rule with an edge, the ladder still underperforms sizing that keeps risk proportionate, because it pays for its smooth early results with a much higher chance of ruin.
Martingale Compared With Flat, Fixed Fractional and Kelly Sizing
Martingale trading is easiest to judge next to the sizing rules traders normally use. All of the results below come from the same 1,078 trades on a $100,000 account with a 30% loss limit.
Flat stake. Risk the same dollars every trade. The $500 flat stake made +62.5% with a 10.8% worst drawdown and never came close to the limit.
Fixed fractional. Risk a set percentage of current equity, so the stake shrinks in a drawdown and grows with the account.
| Fixed fraction per trade | Return or result | Worst drawdown |
|---|---|---|
| 0.25% | +35.7% | 7.9% |
| 0.5% | +81.6% | 15.3% |
| 1% | +211.7% | 28.4% |
| 2% | Breached on trade 635, April 1, 2022 | 30.7% |
| 3% | Breached on trade 178, May 4, 2018 | 31.9% |
Higher fractions earn more until they don't. At 2% and 3% the same edge broke the limit, and 2% broke it in 98.5% of reshuffled orders.
Kelly criterion. The Kelly formula, f = W - (1 - W) / R, sizes from the edge itself. At a 37.2% win rate and a 2:1 payoff it gives 0.372 - 0.628 / 2 = 5.8% of equity per trade. That maximizes long-run growth in theory, but it is far above the 2% that already broke the limit here, which is why traders who use Kelly usually take a small fraction of it.
The 3-5-7 rule. This rule of thumb caps risk at 3% per trade and 5% across all open positions, and asks winners to be at least 7% larger than losers (definitions of the 7 vary). On this test, even 3% per trade was too aggressive for a 30% limit, so treat 3% as a ceiling, not a target.
The better strategy than martingale isn't a cleverer progression. It's a stake set from a risk budget and the distance to your stop, then left alone by the last trade's result.
Related lesson: Fixed-fractional position sizing
Trading Costs and Slippage on a Martingale Ladder
Trading costs hurt a martingale ladder more than a flat stake because the ladder concentrates its size on the trades that matter most. Commissions and exchange fees are charged per contract, so a rung with 32 times the contracts pays 32 times the commission.
The bigger issue is how small a typical edge is in the first place. The 2R-target ES and NQ trend rule measured on this page made +0.116R per trade before any costs. If commissions, spread and slippage together cost 0.05R per trade (an illustrative figure), they remove more than 40% of that edge before the ladder adds anything.
Slippage on the late rungs is the hidden part. A stop on a large position is a large market order, and in fast markets it fills worse than a small one. The late rungs are also the ones most likely to be hit during the volatility spikes that produce long losing runs. That test assumed exact fills at the stop, so its ladder results are better than a real account would have seen.
The Psychology Behind Martingale Trading Decisions

The psychology behind martingale trading is easy to recognise, because most traders have felt the pull without using the name. A loss stings, and the fastest way to make the sting go away is a bigger next trade that wins it back.
The gambler's fallacy. After several losses it feels like a win is due. In the 1,078-trade ES and NQ test on this page, the chance of a loss right after a loss was 61.7%, about the same as at any other time. The market doesn't remember your last trade.
Loss chasing and revenge trading. A ladder turns "I need to get it back" into a formula. Each rung is a revenge trade with a spreadsheet behind it, and the stake is set by the size of the hole, not the quality of the setup.
Sunk cost. By rung eight a trader has already lost 255 units. Stopping means accepting that loss, so the next rung feels less like a choice and more like the only way out.
False confidence. The ladder wins most cycles, so it builds a run of good results that look like skill. The doubling account in that test spent 15 months looking brilliant before the eight trades that ended it.
The practical fix is precommitment. Decide your maximum risk per trade and per day while you are calm, write them down and use platform risk settings or a lockout so the decision can't be reopened mid-tilt.
Related lesson: Revenge trading
Who Martingale Sizing Suits and Prop Firm Drawdown Limits
Martingale sizing suits almost no one who trades a real account with a real loss limit. In theory it only works for a trader with unlimited capital, no position limits and no drawdown rule, and that person has no need to recover a $500 loss.
The traders it attracts are usually the opposite: small accounts, a recent losing streak and pressure to get back to even quickly. That's the profile where an emptied ladder does the most damage.
Prop firm rules make martingale trading even harder. Most funded accounts have a fixed maximum drawdown, often a trailing one that follows the account's peak, and a cap on how many contracts you can hold. A ladder runs into both. It needs more size after losses, exactly when the drawdown buffer is smallest, and it hits the contract cap after a handful of rungs.
On our accounts, the 50K account allows 4 minis or 40 micros, so a ladder that starts at 1 micro runs 1, 2, 4, 8, 16 and 32 micros, and the seventh rung (64 micros) is over the limit. With an illustrative 10-point MES stop ($50 per micro), those six losing rungs would cost $3,150, more than the $2,000 trailing drawdown on a 50K Growth funded account. Our funded accounts are simulated, and our drawdown is an end-of-day trailing limit enforced in real time, so a ladder there usually ends the account long before it reaches its last rung.
Martingale Trading FAQ
Is martingale trading profitable?
Martingale trading is not reliably profitable, because it doesn't create an edge. Its expected value has the same sign as the rule underneath it, and it multiplies the capital at risk faster than the profit. In the 1,078-trade ES and NQ test on this page, doubling tripled a $100,000 account and then broke a 30% loss limit, and it broke that limit in 99.8% of reshuffled trade orders.
What is the 3-5-7 rule in trading?
The 3-5-7 rule is a risk guideline: risk at most 3% of the account on one trade, keep total open risk under 5%, and aim for winners at least 7% larger than losers. Definitions of the 7 vary between sources. It is the opposite of a martingale, because it caps the stake instead of growing it after losses.
Do casinos kick you out for Martingale?
Casinos usually have no need to, because table maximums already cap how far a martingale gambler can double. Every bet also still carries the house edge, so the system loses on average. Trading has the same ceiling in different clothes: account size, contract limits and drawdown rules.
What does it mean when you bet against a stock?
Betting against a stock means short selling: borrowing shares, selling them and buying them back later, hoping to buy back at a lower price. A short position loses when the price rises, and a trader who doubles a losing short is running a martingale on the short side.
Is there a better strategy than Martingale?
Yes. In the ES and NQ test on this page, a fixed-fraction stake of 0.5% of current equity per trade made +81.6% on the same trades as the martingale with a 15.3% worst drawdown and never broke a 30% limit in any reshuffled order. Size from a risk budget and your stop distance, not from the last trade's result.
Is anti-martingale safer than martingale?
Anti-martingale is safer only with a cap on the largest stake. In the ES and NQ test on this page, a 4-unit cap broke a 30% loss limit in 4% of reshuffled trade orders, against 62% uncapped. Without a cap, one loss after a winning streak can undo the streak.
This article is educational and is not investment advice. Futures and leveraged trading can lose money quickly, and losses can exceed what you expect when stops slip in fast markets. The test results on this page are hypothetical: they use back-adjusted continuous price data, exact fills and no costs, and they do not represent any real or funded account. Funded and evaluation accounts at prop firms are simulated, and past patterns may not repeat.


