



TL;DR: OHLC stands for open, high, low and close, the four prices that summarize one period on a chart. Open and close are single trades, while high and low are the extremes reached in between. Read direction from open against close and strength from where the close sits in the range. Convert the range to ticks and dollars: 1.25 points on MES is 5 ticks, or $6.25. Check the session, timeframe and true range from the prior close before trading off a bar.
You see a green bar, assume buyers are in control, and buy the next tick. Two bars later you are stopped out, and the chart still looks bullish. The bar did not lie. It told you two things at once, and you only read one of them.
OHLC data is the most common way price history is stored and charted. This guide explains what each of the four prices actually records, how to read a bar in points, ticks and dollars, where OHLC bars hide information, and how the same bar logic carries across futures, forex, stocks and commodities.
What OHLC Means on a Price Chart
OHLC stands for open, high, low and close. Those four prices summarize trading over one fixed unit of time, such as one minute, one hour or one day. An open-high-low-close chart, often just called an OHLC bar chart, draws one bar per period and is a standard tool in technical analysis.
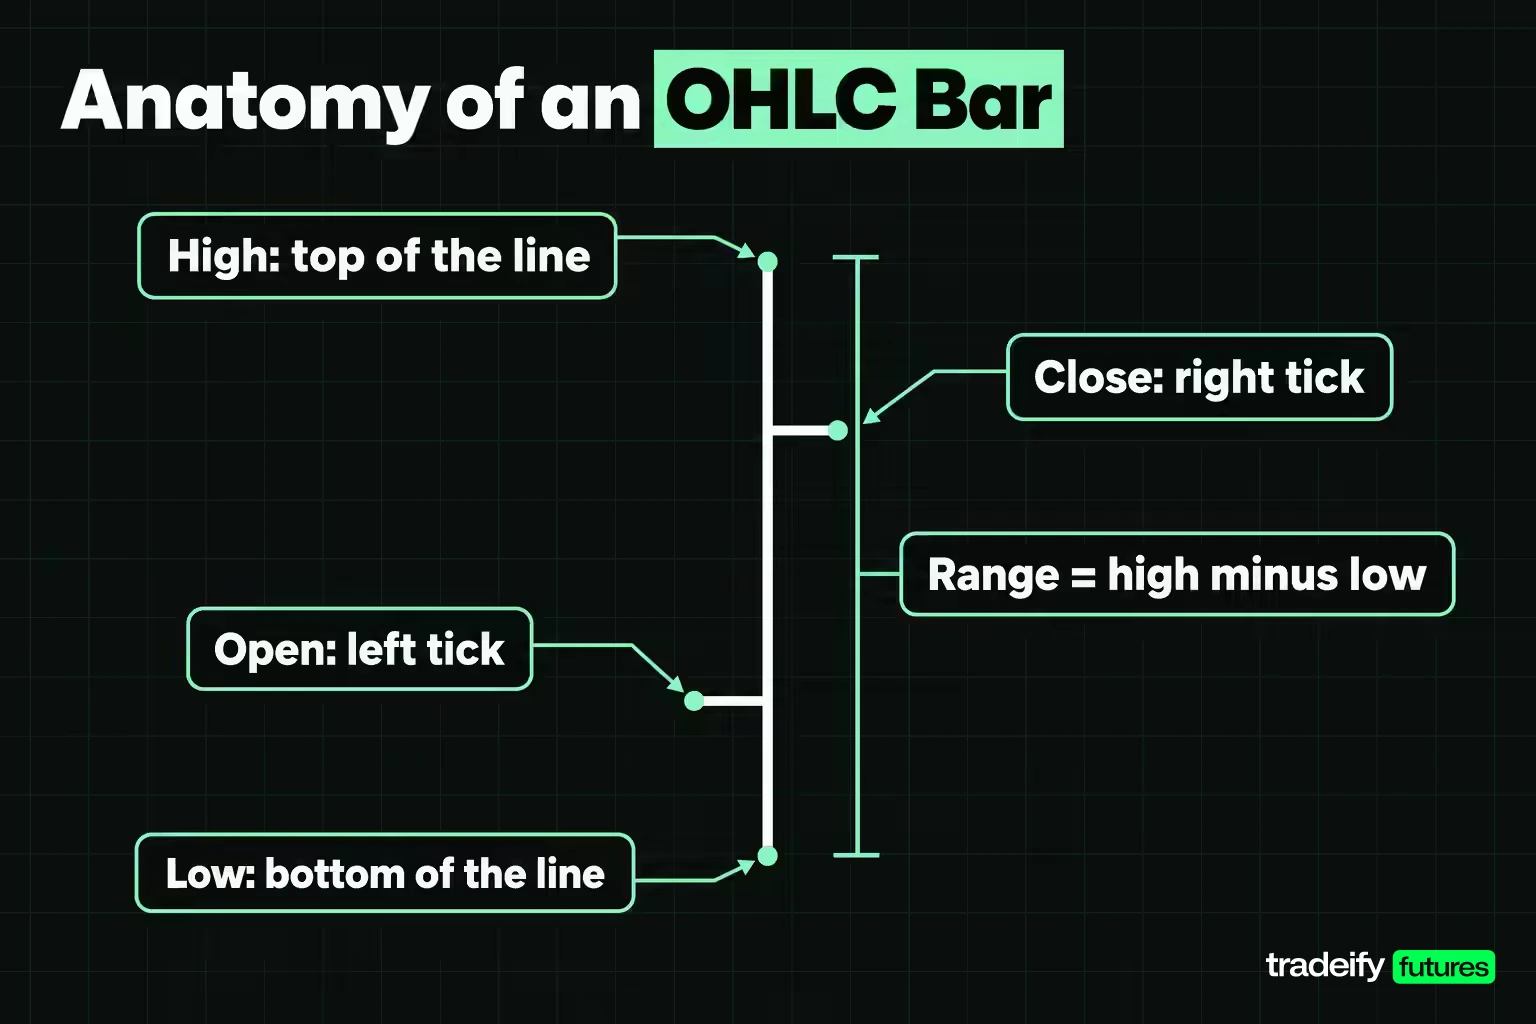
Each OHLC bar has three parts:
- A vertical line running from the period's high to its low, which shows the full range traded.
- A short tick on the left side marking the open.
- A short tick on the right side marking the close.
CME Group's charting course describes the bar chart the same way: one bar shows where price started, where it ended and the range it traded in between.
The four OHLC prices are not the same kind of number
Two of the four OHLC prices are single trades, and two are extremes.
- Open. The first traded price of the period. It is not an average or a quote.
- High. The highest price at which a trade occurred during the period.
- Low. The lowest price at which a trade occurred during the period.
- Close. The last traded price before the period ended.
Nobody chose the high or the low. Each one just records how far price got before the window closed. The close often gets the most attention, because it is the price the next period is measured against.
What traders use OHLC data for
Traders use OHLC bars to answer three questions quickly. Did price finish higher or lower than it started? How far did it travel? Who was in control at the end of the period? Volatility tools, trend reads, stop placement and most chart patterns all start from those four numbers.
Related lesson: What Is Price?
How to Read an OHLC Bar
The fastest way to learn to read an OHLC bar is to build one from the trades behind it. The example below uses Micro E-mini S&P 500 futures (MES). CME Group lists MES at $5 times the S&P 500 index, with a minimum tick of 0.25 index points worth $1.25 per contract.
Imagine a one-minute MES bar from 9:30 AM to 9:31 AM. The prices are illustrative, and these 15 trades print in order:
7000.00, 7000.25, 7000.50, 7000.25, 7000.75, 7001.00, 7000.75, 7000.50, 7000.25, 7000.50, 7000.75, 7001.25, 7001.00, 7000.75, 7000.50
Extract the four OHLC values from that list alone:
- Open is the first print, 7000.00.
- High is the maximum, 7001.25.
- Low is the minimum, 7000.00, which here is the opening print itself.
- Close is the last print, 7000.50.
Nothing else in the window changes those four values. That is what makes an OHLC bar compact, and it is also what makes it lossy. The order of the middle 13 trades is gone.
Range, body and shadows of an OHLC bar
Once you have the four OHLC prices, every other measurement on the bar follows from them.
| Bar measurement | Price or points | Ticks | Dollars per MES contract |
|---|---|---|---|
| Open | 7000.00 | 0 | $0.00 |
| High | 7001.25 | 5 above open | $6.25 |
| Low | 7000.00 | 0 below open | $0.00 |
| Close | 7000.50 | 2 above open | $2.50 |
| Range (high minus low) | 1.25 | 5 | $6.25 |
| Body (close minus open) | 0.50 | 2 | $2.50 |
| Upper shadow (high minus the higher of open and close) | 0.75 | 3 | $3.75 |
| Lower shadow (lower of open and close minus low) | 0.00 | 0 | $0.00 |
The parts always add up. The 0.50 body plus the 0.75 upper shadow plus the 0.00 lower shadow equals the 1.25 range. That relationship holds for every bar ever drawn, so it doubles as a quick check on any data you build yourself.
On the full-size E-mini S&P 500 (ES), CME lists the same 0.25-point tick worth $12.50, ten times the micro. The same 1.25-point range is $62.50 per ES contract. The bar looks identical on both charts, and the money at stake is not.
Where the close sits in the OHLC range
Open against close tells you direction. Where the close sits inside the high-to-low range tells you strength. You need both.
In the example bar, the close is 0.50 points above the low on a 1.25-point range, so it sits at 40% of the range. The bar finished up, but in the lower half of its range. Sellers met the 7001.25 high and pushed price back 0.75 points, more than the entire body.
A common way to put that on one scale is close location: close minus low, minus high minus close, all divided by the range. It runs from plus one (closed on the high) to minus one (closed on the low). Here it is 0.50 minus 0.75, divided by 1.25, which is negative 0.20. Up bar, weak finish. If your entry assumed momentum, that number is the argument against it.
Bullish and Bearish OHLC Bars
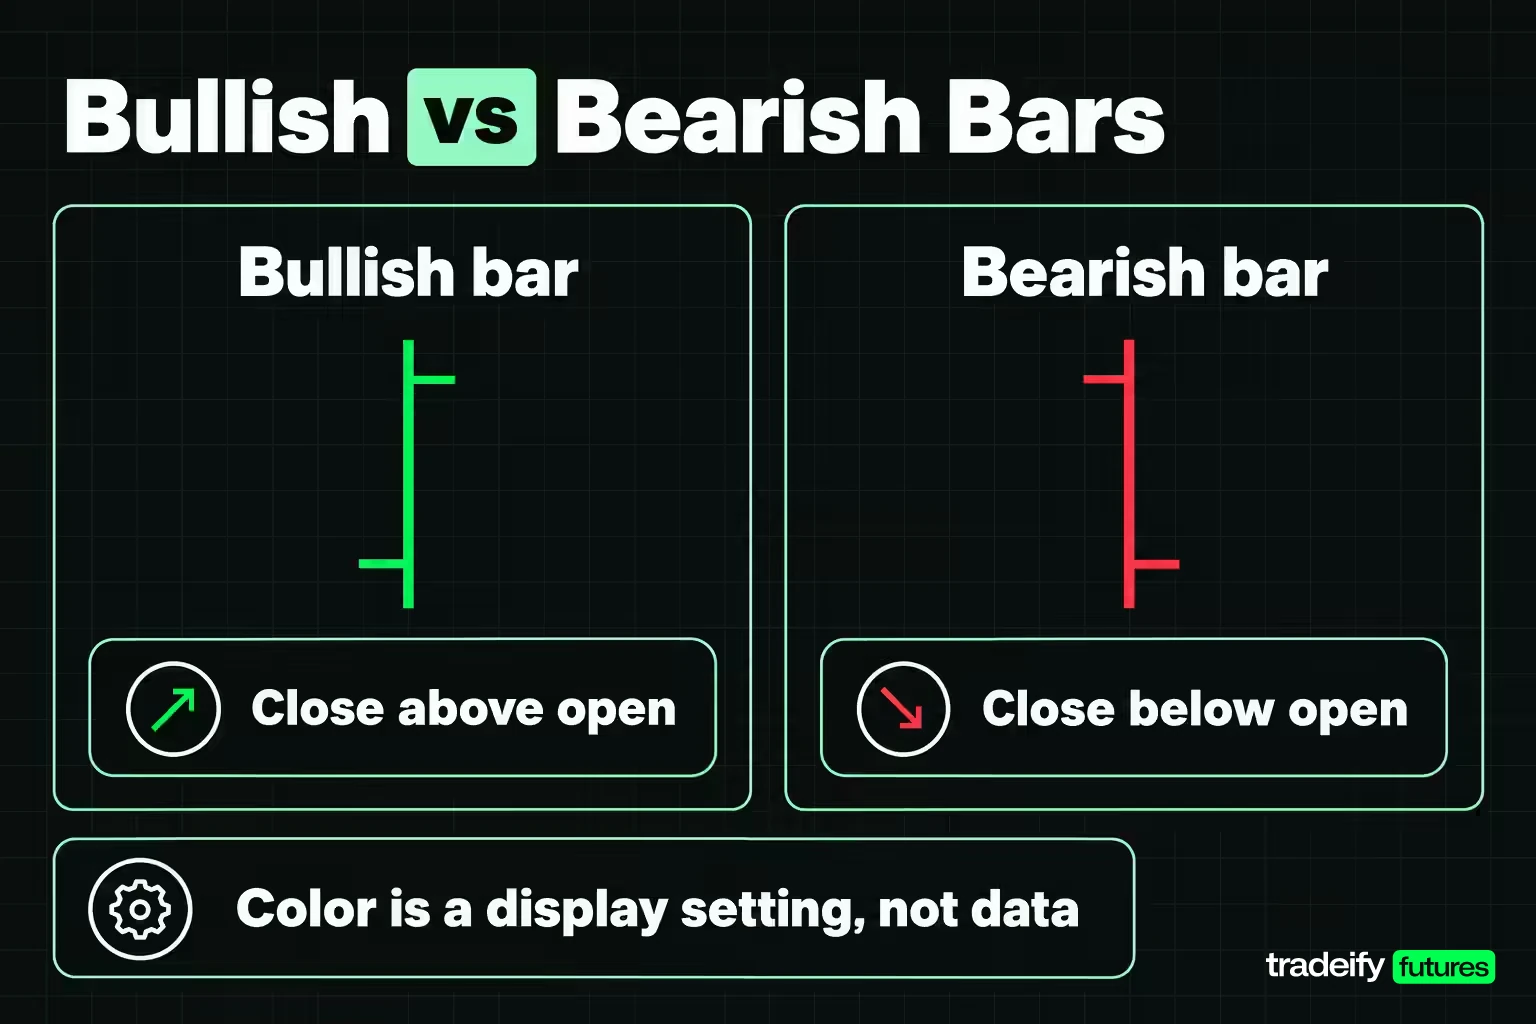
An OHLC bar is bullish when it closes above its open and bearish when it closes below it. On the bar itself, that means the right-hand tick sits above the left-hand tick on an up bar and below it on a down bar.
Color is a display setting, not part of the data. Investopedia notes that up bars on OHLC charts are often drawn black or green and down bars red. CME Group's charting course says the same green and red convention applies to candles, depending on your software's color settings. Before you trust a color at a glance, check what your platform uses.
When direction and strength disagree
Direction and strength are separate readings, and the bar is only clearly one-sided when they agree. Two illustrative MES bars show the difference.
| Example bar | Open | High | Low | Close | Body | Close location |
|---|---|---|---|---|---|---|
| Bearish and weak | 7004.00 | 7004.50 | 6999.00 | 6999.50 | Down 4.50 points | Negative 0.82 |
| Bearish but recovering | 7003.00 | 7003.25 | 6998.00 | 7002.50 | Down 0.50 points | Positive 0.71 |
The first bar dropped 4.50 points, 18 ticks or $22.50 per MES contract, and closed in the bottom tenth of a 5.50-point range. Sellers controlled the period from open to close.
The second bar is also red, but it only lost 0.50 points. It traded 5.00 points down to 6998.00 and then recovered to close near the top of its 5.25-point range. A trader who sells it because it is red is selling a bar where buyers won the second half.
That is the core discipline with bullish and bearish OHLC bars. The color tells you which way the period finished. The close location tells you who finished it.
Interpreting OHLC Data and Bar Patterns
Interpreting OHLC data means reading bars in context, not one at a time. A single bar describes one period. A sequence of bars describes behavior: whether highs keep rising, whether ranges are expanding, and whether closes are holding near the top or fading.
Investopedia summarizes the main OHLC reading cues this way:
- Open-to-close distance. A wide gap between open and close points to strong momentum, and a narrow one to indecision.
- Bar height. A tall bar means a wide range and more volatility in that period.
- Close position. A rally that closed well below its high suggests the rally faded late, and a drop that closed well above its low suggests selling faded.
Key reversal, inside and outside OHLC bars
Three bar patterns come up often on OHLC charts.
- Key reversal. In an uptrend, Investopedia defines it as a bar that opens above the prior bar's close, makes a new high and then closes below the prior bar's low. The downtrend version is the mirror image.
- Inside bar. A bar whose high is below the prior high and whose low is above the prior low. The range contracted inside the previous bar.
- Outside bar. A bar whose high is above the prior high and whose low is below the prior low. The range expanded on both sides.
Here is an illustrative key reversal on MES. The prior bar has a high of 7010.00, a low of 7004.00 and a close of 7008.00. The next bar opens at 7009.00, which is 1.00 point above the prior close, trades up to a new high of 7012.00, then falls to close at 7003.50, which is 0.50 points below the prior low. Its 9.25-point range is $46.25 per MES contract, and the close sits near the bottom of it.
That is an observation, not yet a trade. What would confirm it is follow-through: the next bars failing to reclaim the reversal bar's high and closing lower. What would invalidate it is price trading back above 7012.00. Without that second step, the pattern is just one bar that looked dramatic.
OHLC bar strategies for breakouts, trends and stops
Traders build OHLC readings into strategies in a few common ways, each with its own failure mode.
- Breakout confirmation. A close beyond a level counts for more than a high that poked through it. A bar whose high clears resistance but whose close sits back below it is a failed test, not a breakout.
- Multi-timeframe checks. A strong five-minute close can sit inside a weak hourly bar. Checking the higher-timeframe bar first stops you treating a pullback as a new trend.
- Trend reading. CME Group's course gives the example of a series of five-minute bars where the open and high are above the previous bar's high, which some traders read as an upward trend.
- Stop placement. Many traders reference the prior bar's high or low for a stop. The bar's range tells you what that stop costs in ticks before you take the trade.
None of these makes a pattern reliable on its own. One clean example on a chart is a story. Judge any OHLC-based rule over a meaningful sample in your journal before you trust it with size.
Related lesson: Multiple-Timeframe Analysis
OHLC Ranges and Volatility
The height of an OHLC bar is the simplest volatility read on a chart. A tall bar means price covered a lot of ground in that period, and a run of short bars means it covered little. Range expansion (bars getting taller) and range contraction (bars getting shorter) are often the first visible sign that market conditions have changed.
A bar is only wide or narrow relative to that instrument's own recent bars, on the same timeframe and session. A 10-tick MES bar might be quiet at the open and busy at lunch. Compare against a recent average, not against a feeling.
Why OHLC ranges do not add up across timeframes
OHLC ranges do not add up across timeframes. Here are five illustrative one-minute MES bars and the single five-minute bar they combine into.
| One-minute bar | Open | High | Low | Close | Range in points |
|---|---|---|---|---|---|
| 9:30 AM | 7000.00 | 7001.25 | 7000.00 | 7000.50 | 1.25 |
| 9:31 AM | 7000.50 | 7001.75 | 7000.25 | 7001.50 | 1.50 |
| 9:32 AM | 7001.50 | 7002.00 | 7001.25 | 7001.25 | 0.75 |
| 9:33 AM | 7001.25 | 7001.50 | 6999.75 | 7000.00 | 1.75 |
| 9:34 AM | 7000.00 | 7000.75 | 6999.50 | 7000.25 | 1.25 |
Combining the five bars follows four rules. The five-minute open is the first bar's open, 7000.00. The high is the highest high, 7002.00. The low is the lowest low, 6999.50. The close is the last bar's close, 7000.25. That gives a five-minute range of 2.50 points, which is 10 ticks or $12.50 per MES contract.
Now add the five one-minute ranges the way a spreadsheet column would: 1.25 plus 1.50 plus 0.75 plus 1.75 plus 1.25 equals 6.50 points, or 26 ticks and $32.50. The sum is 2.6 times the real five-minute range, and the gap between the two numbers is 4.00 points or $20.00 per contract.
Neither number is wrong. Each one-minute bar measures its own trip from its own low to its own high, so every pullback and recovery inside the window gets counted again. The five-minute bar measures the window once. Anyone estimating volatility by summing short bars gets a number that grows with how finely the data is sliced, not with how much the market actually moved.
OHLC Indicators Like True Range and ATR
Many technical indicators are calculated directly from OHLC prices. Moving averages usually use the close. Range-based tools use the high and low. The most widely used OHLC volatility indicator, average true range (ATR), uses three of the four prices.
StockCharts' ChartSchool explains that J. Welles Wilder developed ATR with commodities and daily prices in mind, because those markets are often subject to gaps and limit moves that a simple high-minus-low formula would miss. Wilder's true range is the greatest of three values:
- The current high minus the current low.
- The current high minus the previous close, as an absolute value.
- The current low minus the previous close, as an absolute value.
ATR is then a smoothed average of true range, typically over 14 periods, and it can be calculated on intraday, daily, weekly or monthly bars. ATR measures volatility only. It says nothing about direction.
How to use an OHLC indicator for stops and levels
The phrase "OHLC indicator" gets used loosely. It can mean a study calculated from the four prices, such as ATR, or a chart script that draws a previous period's open, high, low and close as horizontal lines. Either way, the useful questions are the same:
- Which of the four prices does it use, and on which timeframe?
- Does it include the gap from the prior close, or only the bar's own range?
- Which session template feeds it? A daily level built from the full futures session differs from one built from day-session hours only.
A sensible use is to turn an OHLC indicator into a number you can act on. For example, compare a planned stop distance to the instrument's recent ATR, so the stop is not tighter than an ordinary bar's movement.
Related lesson: Average True Range (ATR)
OHLC Bars and Price Gaps
A price gap appears when one OHLC bar's range does not overlap the previous bar's range. StockCharts defines an up gap as a bar whose low is higher than the previous high, and a down gap as a bar whose high is lower than the previous low. It notes that gaps often come from strong buying or selling interest that builds while a market is closed, such as an earnings report released after the close. ChartSchool sorts them into four types: common, breakaway, runaway and exhaustion gaps.
A bar only counts trades inside its own window. Any distance traveled between windows does not show up in the bar at all.
Worked gap on an OHLC chart
Suppose a five-minute MES bar closes at 7000.25 with a low of 6999.50 (illustrative prices), and the next bar opens at 6998.50, trades a high of 6999.00 and a low of 6998.00, and closes at 6998.75.
- The bar's own range is 1.00 point, which is 4 ticks or $5.00 per MES contract.
- Its high is 0.50 points below the prior bar's low, so it is a down gap by the StockCharts definition.
- Its true range is 2.25 points (the low is 2.25 points below the prior close), which is 9 ticks or $11.25.
The true range is 2.25 times the range the bar draws. The missing 1.25 points, or $6.25 per contract, never appear inside the bar. That is the mechanism behind a stop that seems to have been skipped: price did not trade through your level inside a bar, it jumped past it between bars.
Gaps in stocks versus near 24-hour futures
Gaps on daily stock charts usually form overnight, because the cash session closes and reopens. Equity index futures such as ES trade on CME Globex from Sunday 6:00 PM to Friday 5:00 PM ET with a daily maintenance break from 5:00 PM to 6:00 PM ET, so daily futures bars gap less often. Intraday gaps still appear around news releases, thin overnight trading and the reopen after the maintenance break.
Related lesson: Gaps and Gap Analysis
OHLC Timeframes and Session Settings
Any timeframe can carry OHLC bars. A five-minute chart draws one bar every five minutes, and a daily chart draws one per session. CME Group's charting course notes that a longer-term trader may track weekly or monthly bars, while a shorter-term trader may use 60-minute or 5-minute bars.
Common choices by style:
| Trading style | Typical OHLC timeframes | What each bar represents |
|---|---|---|
| Scalping | Tick charts, 1-minute | Seconds to a minute of trading |
| Day trading | 1-minute to 15-minute, plus 60-minute for context | Part of one session |
| Swing trading | 60-minute, 4-hour, daily | Hours to one session |
| Position trading | Daily, weekly, monthly | One session to a month |
Time-based and trade-based OHLC bars
Not every OHLC chart uses time. CME Group's course separates time-based charts, which start a new bar after a set amount of time, from trade-based tick charts, which start a new bar after a set number of trades, such as every 25 trades or 512 trades. Tick charts print bars faster when activity is high and slower when it is quiet, so the same morning can look very different on a 5-minute chart and a 512-tick chart.
Bar naming is another setting worth checking. As a Quantitative Finance Stack Exchange answer points out, there is no standard for labelling bars: some data vendors call the 3:00 to 3:05 bar the 3:00 bar, others the 3:05 bar. If you line up data from two sources, confirm which convention each uses.
What counts as a daily OHLC bar
The four OHLC fields are clear. The period they cover often is not. On a near 24-hour futures contract, a daily bar built from the full electronic session and one built only from day-session hours (for example, the 9:30 AM to 4:00 PM ET stock market core session) are two different summaries of the same day.
Here is an illustrative MES day shown both ways:
| Daily bar field | Full electronic session | Day session only |
|---|---|---|
| Open | 6992.00 | 6996.00 |
| High | 7004.25 | 7004.25 |
| Low | 6983.50 | 6990.25 |
| Close | 7000.25 | 7000.25 |
| Range | 20.75 points, 83 ticks, $103.75 | 14.00 points, 56 ticks, $70.00 |
| Body | 8.25 points, $41.25 | 4.25 points, $21.25 |
| Body as share of range | 40% | 30% |
| Close location | Positive 0.61 | Positive 0.43 |
Both columns are correct. The full-session bar is 6.75 points wider (27 ticks or $33.75 per MES contract) because the overnight low only exists on that version. If one chart uses the full session and another uses day hours, your range and volatility comparisons will drift with no change in the market.
Related lesson: Regular Trading Hours vs. Extended Trading Hours in Futures
OHLC vs Candlestick Charts
OHLC bars and candlesticks show exactly the same data: the open, high, low and close for each period. The difference is only in how the open and close are drawn.
- An OHLC bar marks the open with a left tick and the close with a right tick.
- A candlestick fills the space between open and close with a body and shows the high and low as wicks. Wikipedia notes that an up candle is normally hollow or green and a down candle filled or red.
Candlesticks are thought to have been developed in the 18th century by the Japanese rice trader Munehisa Homma, and Steve Nison introduced them to Western traders in his 1991 book Japanese Candlestick Charting Techniques.
When OHLC bars beat candlesticks
Wikipedia's OHLC entry, citing Technical Analysis for Dummies, gives each style its strength. Candles are easier to read on a live chart because the body visibly grows and shrinks. OHLC bars have the edge for static review of historical charts: they do not need color or fill to show the open and close, so they still read correctly in grayscale or print.
OHLC bars also avoid one common confusion. A candle can be hollow or green because it closed above its own open, while still closing below the previous bar's close. The color says up, the bar-to-bar comparison says down. On an OHLC bar, you compare the right tick to the previous right tick directly, without color pulling your eye.
So which should you use? The one you can read accurately at speed. The data is identical, so the choice changes how fast you see it, not what is there.
OHLC vs Line, Area and High-Low-Close Charts
Line and area charts drop most of the OHLC data. CME Group's charting course describes a line chart as one that shows the closing price for each period, which makes it a quick way to view a longer-term trend. An area chart is the same line with the space beneath it filled in.
A high-low-close (HLC) chart is an OHLC bar without the left tick. Microsoft's Excel documentation lists high-low-close as a stock chart that uses three series of values in the order high, low and close, next to open-high-low-close, which uses four in the order open, high, low and close. Adding volume gives the volume-open-high-low-close version, often written OHLCV.
| Chart type | Prices shown | Direction shown by | Best use |
|---|---|---|---|
| OHLC bar | Open, high, low, close | Right tick against left tick | Precise levels and static review |
| Candlestick | Open, high, low, close | Body color or fill | Fast pattern reading on a live chart |
| High-low-close | High, low, close | Close against prior close | Range and close without the open |
| Line | Close only | Slope of the line | Trend direction at a glance |
| Area | Close only, filled below | Slope of the filled line | Long-term trend on a dashboard |
| OHLCV | OHLC plus volume | Same as OHLC bar | Separating a move on heavy activity from a thin drift |
The line chart is easier to read and weaker for any decision that depends on where price went inside the period. If your stop sits beyond a bar's low, a line chart cannot show you that low.
How OHLC Bars Differ Across Futures, Forex, Stocks and Commodities
OHLC bars work the same way in every market, but what the open means and what a range costs change from one market to the next.
- Stocks. A Quantitative Finance Stack Exchange answer describes the original OHLC convention: in a session with opening and closing auctions, the open and close are the auction prices, and the high and low are the extremes of all trades. On a stock's daily bar, the open is usually a real auction print.
- Futures. Most futures trade close to 24 hours, so the same answer notes that the daily open is simply the first trade after the session begins. It is not an auction price.
- Forex. Currency futures such as CME's Euro FX trade on Globex nearly around the clock, so the daily open depends on where your platform starts the day.
- Commodities. Energy and metals futures follow the futures pattern, with long Globex sessions and a daily break.
What the same OHLC range costs in different contracts
A bar's range only matters to your account once it is converted into money. Here is the same 20-tick bar range on several CME contracts, using CME's published tick sizes.
| Contract | Tick size | Tick value | 20-tick range in price | 20-tick range per contract |
|---|---|---|---|---|
| Micro E-mini S&P 500 (MES) | 0.25 index points | $1.25 | 5.00 points | $25.00 |
| E-mini S&P 500 (ES) | 0.25 index points | $12.50 | 5.00 points | $250.00 |
| Micro WTI Crude Oil (MCL) | $0.01 per barrel | $1.00 | $0.20 | $20.00 |
| Light Sweet Crude Oil (CL) | $0.01 per barrel | $10.00 | $0.20 | $200.00 |
| Micro Gold (MGC) | $0.10 per troy ounce | $1.00 | $2.00 | $20.00 |
| Gold (GC) | $0.10 per troy ounce | $10.00 | $2.00 | $200.00 |
| Micro EUR/USD (M6E) | 0.0001 per euro | $1.25 | 0.0020 | $25.00 |
| Euro FX (6E) | 0.00005 per euro | $6.25 | 0.0010 | $125.00 |
Two bars can look identical on screen and carry a tenfold difference in dollars. Always convert the OHLC range into ticks and dollars for the contract you actually trade.
Related lesson: Tick Size and Tick Value
How to Create an OHLC Chart
Creating an OHLC chart starts with compiling OHLC data. For each period, take the first trade as the open, the maximum as the high, the minimum as the low and the last trade as the close. Most traders never do this by hand, because charting platforms build bars from the data feed automatically, but knowing the rule tells you what you are looking at.
Creating an OHLC chart in Excel
Microsoft's documentation for Excel stock charts is strict about column order. An open-high-low-close stock chart needs four series in the order open, high, low and close. A volume-open-high-low-close chart needs five series in the order volume, open, high, low and close.
To pull price history into a sheet, Excel's STOCKHISTORY function returns columns by number: 0 for date, 1 for close, 2 for open, 3 for high, 4 for low and 5 for volume. By default it returns date and close only, so request columns 0, 2, 3, 4 and 1 to get the order an OHLC chart expects.
Creating OHLC data in Python
In Python, the pandas library resamples a time series into OHLC bars with its resample and ohlc methods. The pandas documentation describes the ohlc method as computing the open, high, low and close of each group, excluding missing values. Point it at a series of trade prices indexed by timestamp, choose an interval, and it returns one OHLC row per interval.
OHLC data accuracy and tick data
OHLC data is a summary of tick-by-tick trades, and summaries carry assumptions. Check these before you trust a dataset:
- Empty intervals. If no trades occur in an interval, its OHLC values are undefined. Data sources either skip the bar or flag it, and the choice changes averages.
- Bar timestamps. Confirm whether each bar is labelled by its start time or its end time.
- Trades versus quotes. Bars built from trade prices and bars built from bid or ask quotes give different highs and lows.
- Sorting. The open and close depend on trade order, so trades must be sorted by timestamp before you extract them.
- Session template. Confirm whether daily bars use the full electronic session or day-session hours.
When you need the exact sequence inside a bar, such as whether the high or the low came first, OHLC data cannot tell you. That needs the time and sales record.
Related lesson: Time and Sales
Common OHLC Reading Mistakes
Most OHLC mistakes come from treating a bar as a full record of the period rather than a four-number summary. The table below lists the common ones and how to avoid them.
| Mistake | What it looks like | How to avoid it |
|---|---|---|
| Reading a bar as a full record | Treating the bar's low as the furthest price traveled | Check true range against the prior close |
| Judging strength by color alone | Calling a bar strong because it closed higher | Check where the close sits inside the range |
| Mixing sessions | Comparing a full-session daily bar with a day-session bar | Use one session template for every comparison |
| Summing ranges across timeframes | Adding short bar ranges to estimate a longer period | Measure the longer bar's range directly |
| Expecting bars to connect | Assuming one bar's close equals the next bar's open | Remember that bar boundaries do not create trades |
| Ignoring contract size | Treating a 20-tick bar as the same risk on every contract | Convert the range to dollars for your contract |
The last two rows trip up careful traders too. A bar's close is the last trade before the period ends, and the next bar's open is the first trade after it starts. As the Quantitative Finance Stack Exchange discussion puts it, those are two different trades, so in a thin market they can sit several ticks apart with nothing in between.
A quick OHLC checklist before you trade off a bar
Run these checks in order. They take under a minute on a market you know.
- Confirm the timeframe and session template.
- Confirm what the open represents: an auction print or the first trade after a break.
- Read direction (open against close) and strength (close location) separately.
- Convert the range to ticks and dollars for your contract and size.
- Compare the range with the instrument's recent average on the same timeframe.
- Check the distance from the prior close for any gap.
Related lesson: Market Structure: Highs, Lows, and Trends
OHLC Close Versus Settlement Price
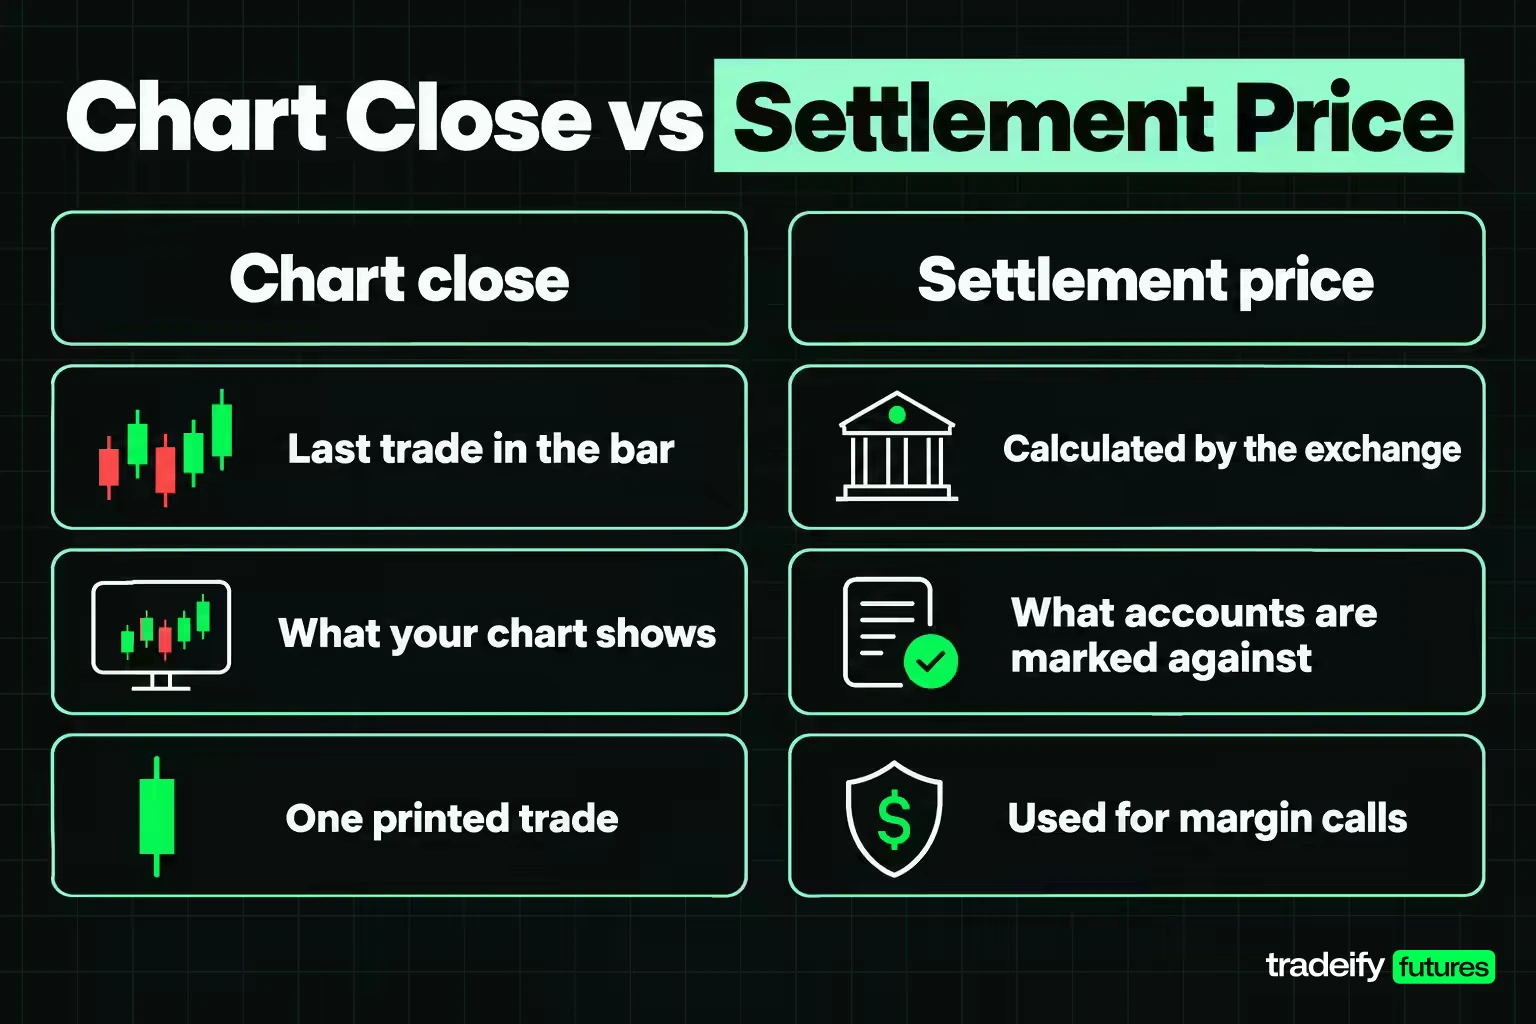
On a futures chart, the close of a daily OHLC bar is not always the price an account is marked against. That number is the settlement price, which the exchange calculates separately.
The CFTC defines the settlement price as the daily price at which the clearing organization clears all trades and settles all accounts between clearing members, and it is used to determine margin calls and invoice prices for deliveries. CME Rule 813 lets the exchange set daily settlement using methods such as the volume-weighted average price of trades in a settlement period or the bid and ask midpoint, rounded to a valid tick, depending on the product and its activity in that period.
So a daily bar can close at 7000.25 while the settlement comes out at 6997.75 (illustrative). That is 2.50 points apart, which is $12.50 per MES contract and $125.00 per ES contract. Neither number is an error. One is the last trade your chart saw, and the other is the exchange's calculated mark.
On our accounts, two of the supported platforms can display OHLC bars directly. Tradovate has an OHLC chart style and a Data Box that shows the values for the bar under your cursor, and WealthCharts has OHLC Bars plus a Data Window with OHLCV. Positions on our accounts must be closed by 4:45 PM ET, so no trade is carried from one daily bar into the next.
Related lesson: Last Price, Mark Price, and Mid Price
OHLC FAQ
What does OHLC stand for in trading?
OHLC stands for open, high, low and close. Those four prices summarize trading in one period, such as one minute or one day. Traders use them to judge direction, range and who controlled the end of the period.
What is a high-low-close chart?
A high-low-close chart is an OHLC bar chart without the open. Each bar shows the high and low as a vertical line and the close as a tick on the right. It suits traders who care about range and close but not the open.
How do you use an OHLC indicator?
You use an OHLC indicator by turning its reading into a specific decision, such as checking that your stop is wider than the recent average true range. Before that, confirm which of the four prices and which session template the indicator is built from. Treat it as context, not a signal on its own.
How do you read an OHLC chart?
Find the open on the left tick, the close on the right tick, and the high and low at the ends of the vertical line. Compare open and close for direction, then check where the close sits inside the range for strength. Read bars in sequence rather than one at a time.
What does OHLCV mean?
OHLCV adds volume to the open, high, low and close. Volume shows how much traded during the bar. It helps separate a wide range on heavy activity from a wide range on very little.
Why does one bar's close not match the next bar's open?
The close is the last trade before one period ends, and the open is the first trade after the next one starts. Those are two separate trades. In a fast or thin market, they can be several ticks apart.
Are OHLC bars better than candlesticks?
Neither has more information, because both show the same four prices. Candles are easier to read on a live chart, and OHLC bars read more cleanly on static or grayscale charts. Pick the one you read accurately.
This article is educational and is not financial advice or a recommendation to trade any instrument. All prices in the examples are illustrative, not market quotes. Futures are leveraged, and losses can build faster than expected and exceed what you planned to risk. Evaluation and funded accounts are simulated, and simulated results do not predict live results.


