




TL;DR: Spread trading means holding a long and a short in related contracts and profiting only if the gap between them moves your way. On 20 years of daily futures data, one z-score pairs rule made money on 4 of 7 pairs, and none of the 7 cleared statistical noise. Tight correlation did not predict results, and more than a third of dislocations stayed open for a full year. Fit the hedge ratio, freeze whole contracts, set a hold limit and price both legs before you trust any spread.
Spread trading changes the question you are answering. An outright futures trade asks whether gold, the S&P 500 or crude oil goes up or down. A spread trade asks whether one contract does better or worse than another, and the market's direction can be right, wrong or irrelevant to the result.
That sounds safer, and in some ways it is. It is also easy to mistake for a low-risk trade, which it is not. Spread trading also brings its own problems that a single-contract trader never meets: a hedge ratio that is a decimal while contracts are whole numbers, two sets of fees, a second leg that can fill late, and a relationship that can stop behaving for a year at a time.
This guide covers the definition, the types of spreads in futures and options, the main strategies and the workflow. Then it tests one of the most popular spread strategies, the z-score pairs trade, on 20 years of daily data in six futures contracts and prices the results in dollars.
What Spread Trading Is
Spread trading is buying one contract and selling a related contract at the same time, so the position gains or loses on the change in the price difference between them rather than on either price alone. CME Group's education material defines a spread trade as the simultaneous purchase and sale of two futures contracts to take advantage of price discrepancies.
The difference between the two legs is the spread. If you buy one leg and sell the other, you are "long the spread" when you profit from the difference widening in favour of the leg you bought, and "short the spread" when you profit from it moving the other way.
What you need to be right about is narrower than in an outright trade. Gold and silver can both fall 10%, and a trader long gold and short silver still makes money if silver falls further. The same trader loses if both metals rally and silver rallies harder.
Spread trading versus the bid-ask spread
The word "spread" has a second meaning that causes most of the confusion around this topic. Investor.gov defines the bid as the highest price a buyer will pay and the ask as the lowest price a seller will accept, and the difference between them is called the spread.
That bid-ask spread is a cost you pay on every trade, in stocks, forex, futures and options. It is not a strategy. When someone asks what the spread is in the share market, they usually mean this bid-ask gap. When a futures trader talks about spread trading, they mean a two-leg position.
Related lesson: Bid-ask spread
Types of Spreads in Futures and Options
Spreads come in a handful of families, and each one is a bet on a different relationship. CME Group groups futures spreads into intramarket spreads, intermarket spreads and commodity product spreads. Options add vertical, condor and calendar structures, and statistical pairs trading sits on top of the futures families as a method rather than a separate instrument.
Calendar spreads in one futures market
A calendar spread, also called an intramarket spread, buys a futures contract in one month and sells the same contract in another month. The bet is on the relationship between delivery months, which in physical commodities is driven by storage, financing and supply timing.
Calendar spreads are common enough that exchanges list them as their own instruments with their own price increments. CME's contract specifications set a silver calendar spread tick at 0.001 per troy ounce, which is $5.00, against an outright silver tick of 0.005, which is $25.00. The E-mini S&P 500 calendar spread trades in 0.05 index points, which is $2.50, against 0.25 points and $12.50 for an outright contract. Hedgers also use calendar spreads to roll a position from one month to the next.
Intermarket spreads and pairs
An intermarket spread buys and sells two different but related futures, usually in the same contract month. CME's examples include gold against silver, gold against platinum, the E-mini S&P 500 against the E-mini Russell 2000 and WTI crude against Brent.
A pairs trade is an intermarket spread chosen and sized statistically. You estimate a hedge ratio from the history of the two prices, measure how far the current gap sits from its usual level, and trade back toward it. The 20-year test in this guide uses that method.
Commodity product spreads such as the crush and crack
A commodity product spread trades a raw material against what it is processed into. CME's example is the soybean crush, which buys soybean futures and sells soybean meal and soybean oil futures to mimic a processor's margin. The crude oil crack spread does the same for a refinery, crude against refined products. CME describes these multi-leg spreads as mostly traded by professionals.
Options spreads, from debit spreads to iron condors
Options spreads combine two or more options on the same underlying. The Options Industry Council describes a bull call spread as buying one call and selling another call with the same expiration at a higher strike. Because the call you buy costs more than the one you sell, the trade always starts with a net payment, which makes it a debit spread. Both the maximum gain and the maximum loss are capped, and the most a debit spread can lose is the net debit paid to open it. A bear put spread works the same way in the other direction: buy a put and sell a lower-strike put, pay a net debit, and profit if the underlying falls. Traders use debit spreads when they want a directional view with a known worst case, accepting that the short option caps the upside.
A bear call spread flips that structure. You sell the lower-strike call and buy the higher-strike call, so you receive a net credit at the start, which makes it a credit spread. It profits if the underlying stays below the strikes and loses a limited amount if it rallies through them.
An iron condor combines a bear call spread and a bull put spread, according to Fidelity's explanation of the strategy: four options with the same expiration and different strikes, sold close to the market and bought further away. It is built to profit when price stays inside a range and volatility stays low.
Spread options are a separate product. CME describes calendar spread options as options on the spread between two futures contract months, which exercise into one long and one short futures position. They let a trader take an options view on a calendar spread rather than on either month alone.
Spread Trading vs Directional Trading

Directional trading and spread trading answer different questions, and the clearest way to see it is to put them side by side.
| Question | Directional trade | Spread trade |
|---|---|---|
| What you are betting on | One price rising or falling | One price beating another |
| What moves your P&L | The full move in one contract | The difference between two moves |
| Market falls hard | Hurts a long, helps a short | Can help, hurt or do nothing |
| Main risk | The market goes the wrong way | The relationship changes |
| Costs per round trip | One set of fees and slippage | Two sets, one for each leg |
| Typical exchange margin | Full outright rate | Often reduced if the exchange recognises the spread |
CME's own platinum-gold lesson shows what that looks like with real contract sizes. In the example, a trader buys two April platinum futures at $988.40 and sells one April gold future at $1,231.90, because platinum is a 50-ounce contract and gold is a 100-ounce contract. The trader is long the spread, betting platinum gains on gold.
Both metals rise. Platinum is sold at $1,056.40 and gold is bought back at $1,244.20. The platinum leg makes $6,800 and the gold leg loses $1,230, for a total of $5,570. A directional short in gold lost money on the same day. The spread made money because platinum rose faster.
The reverse is just as possible. If both legs fall and the leg you hold long falls faster, the spread loses while the outright market did nothing unusual. That is the core trade-off of spread trading: you remove most of the market's direction from the result and replace it with the behaviour of a relationship.
Five Common Spread Trading Strategies
Most spread trading strategies fall into five families. Each one has a reason to work and a known way to fail, and the reason matters more than the chart.
- Calendar carry and seasonal spreads. Traders compare nearby and deferred months of one commodity, using storage costs, harvest timing or inventory data to judge whether the gap between months is too wide or too narrow. The failure mode is a supply shock that reprices one month and not the other.
- Intermarket relative value. A trader takes a view on two related markets, such as gold against silver. CME defines the gold-silver ratio as the price of gold divided by the price of silver per troy ounce and notes that silver has far more industrial use, so the ratio tends to rise in uncertainty and fall in recoveries. The failure mode is a regime that lasts longer than the trade.
- Commodity product spreads. The crush and crack spreads trade a processing margin. They work when the margin moves back toward what processors can sustain and fail when capacity, regulation or demand changes the margin for years.
- Statistical pairs and mean reversion. A trader fits a hedge ratio, standardises the gap into a z-score and fades large readings. This is the strategy tested on 20 years of data in this guide, because it is rule-based enough to measure.
- Options spreads. Debit spreads take a directional view with capped cost, credit spreads and iron condors collect premium in exchange for capped but real downside. They are spread trading in a different sense, since the legs are options on one underlying rather than two markets.
If you want the three most common futures spread trading strategies, they are calendar spreads, intermarket relative value and statistical pairs. The real difference between them is how much of the edge comes from fundamentals and how much from statistics.
Related lesson: Pairs trading
Advantages and Disadvantages of Spread Trading
Spread trading has real advantages, and most of them come from the second leg offsetting part of the first. It also has real costs that rarely get the same attention.
Advantages of spread trading
- Lower volatility. CME's spread lessons describe reduced volatility and lower margin requirements as the main advantages, because related legs at the same exchange tend to move together.
- You can profit in rising, falling or flat markets, as long as the relationship moves your way.
- Margin offsets. Exchanges often recognise a spread as less risky than two outright positions and charge less margin on it.
- New views become tradeable. A view that small caps will beat large caps, or that one delivery month is mispriced against another, cannot be expressed with one outright contract.
Disadvantages of spread trading
- Two legs pay two sets of costs. CME's own pros-and-cons list starts its cons with added transaction costs.
- Lower risk usually means lower returns. The same list says that while risk is generally reduced, returns are as well.
- Relationship risk. A spread can lose with no outright move at all, and the relationship has no natural stopping point.
- Leg risk and complexity. Intermarket spreads may fill one leg at a time, and the hedge ratio rarely matches whole contracts.
Margin requirements for spreads
CME's spread overview gives an illustrative margin offset. With an outright soybean margin of $3,000 and corn at $1,500, a trader might receive a 75% margin credit on a soybean-corn spread, so the initial margin is $1,125 rather than $4,500. Those figures are CME's teaching example, not current margins, and real margins change with volatility.
In spread trading, the margin credit is not automatic. CME's "Why Smart Money Trades Spreads" series notes that margin offsets apply only when the spread is held at the ratio the clearing house recognises, so a 2:1 recognised spread held at any other ratio needs more margin. CME's margin page adds that inter-commodity spread credits are not allowed when either contract is in its delivery month. Your broker sets the final figure, so check with them before sizing.
Leg Risk and How Spread Orders Get Filled
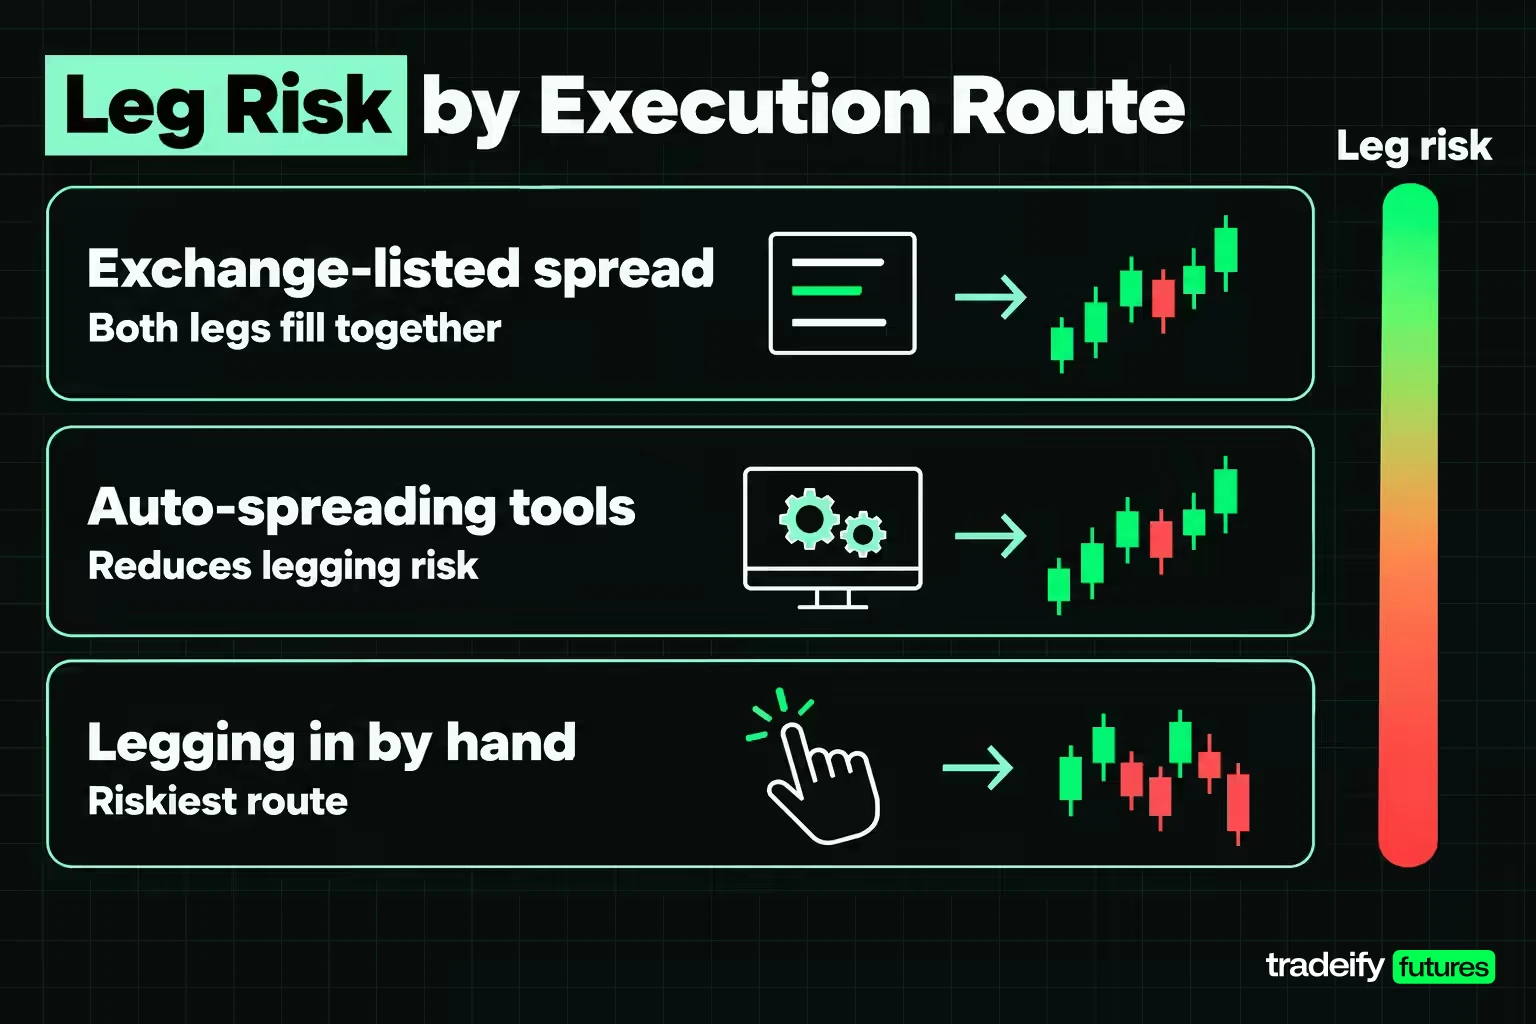
Leg risk is the chance that one side of a spread fills and the other does not, or fills at a worse price, leaving you with an outright position you did not want. Because a spread's edge is often a few ticks of relative value, one leg filling a few ticks late can wipe out the whole expected profit.
How much leg risk you carry depends on how the spread is executed.
- Exchange-listed calendar spreads. CME lists dedicated calendar spread markets that trade the spread as one instrument, which allows execution with no legging risk because both legs fill together or not at all.
- Intermarket spreads without a listed market. CME notes these may carry legging risk, which can be reduced by using dedicated inter-market spread contracts where they exist, or by trading liquid contracts with the auto-spreading tools some trading screens offer.
- Legging in by hand. Entering one leg and then the other is the riskiest route. If you must, fill the less liquid leg first, so the leg you can always get filled is the one you finish with.
Leg risk also returns on the exit. A spread that has worked can give back part of the gain if the second leg is closed into a fast market, so plan both exits before you enter.
Related lesson: Slippage explained
A Spread Trading Process From Idea to Exit
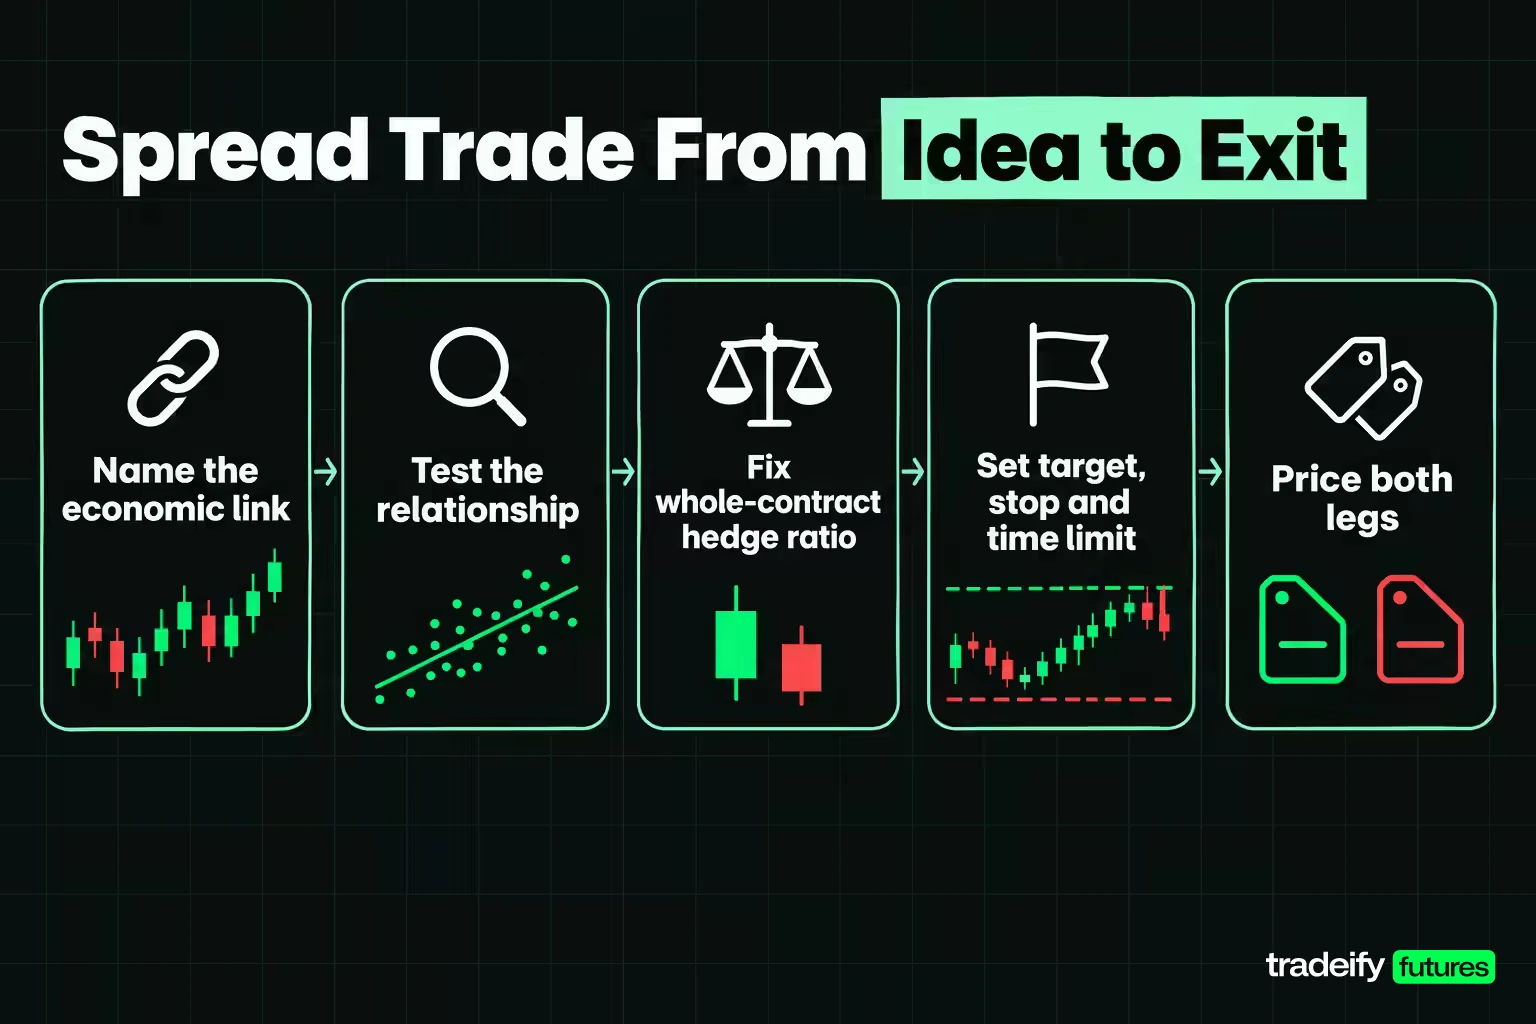
A spread trading process has more steps than an outright trade, because each leg needs its own decisions and the relationship needs one more. Order matters here, so the process splits into the work before the trade and the work during it.
Before the spread trade
- Start with a reason. Name why the two contracts should be linked: the same input, the same demand driver, two substitutes, or two months of one commodity. A spread with no economic link is a coincidence.
- Test the relationship, not just the correlation. Check whether the gap between the legs has returned to its usual level in the past, how long that took and how often it failed.
- Estimate the hedge ratio. Fit how much of the second leg offsets one unit of the first, in dollar terms, over a window long enough to be stable.
- Convert it to whole contracts and freeze it. Pick the contract counts that come closest to the ratio, then keep them fixed for the life of the trade, even when a new fit suggests a different count.
Placing and managing the spread trade
- Define the entry. Write down the reading that triggers a trade, such as a z-score of 2.
- Define three exits. A target when the gap closes, a stop when it widens a set amount further, and a time limit for when it does neither.
- Price both legs. Add slippage and commission on both legs, both ways, and compare that to a typical winning trade.
- Size from the combined risk. Size from what both legs can lose together, not from the larger leg alone.
- Journal the leg that did the work. Record which leg earned and which leg paid on every trade, because that is how you find out whether the relationship or the market made the money.
Related lesson: How to keep a trading journal
How the 20-Year Spread Test Was Built
The statistical pairs strategy is the easiest spread trading method to measure, so this guide tests it on daily data. The study uses daily open and close prices for six futures from Yahoo Finance's continuous front-month series, from September 1, 2005 to November 4, 2026: gold, silver, copper and platinum, plus the E-mini S&P 500 and the E-mini Nasdaq-100.
Contract sizes and tick values come from CME's published contract specifications. Notional values use round illustrative prices, not quotes.
| Contract | Symbol | Contract unit | Tick | Tick value | Notional at an illustrative price |
|---|---|---|---|---|---|
| Gold | GC | 100 troy ounces | 0.10 | $10.00 | $400,000 at $4,000 |
| Silver | SI | 5,000 troy ounces | 0.005 | $25.00 | $250,000 at $50 |
| Copper | HG | 25,000 pounds | 0.0005 | $12.50 | $150,000 at $6.00 |
| Platinum | PL | 50 troy ounces | 0.10 | $5.00 | $75,000 at $1,500 |
| E-mini S&P 500 | ES | $50 x index | 0.25 | $12.50 | $350,000 at 7,000 |
| E-mini Nasdaq-100 | NQ | $20 x index | 0.25 | $5.00 | $560,000 at 28,000 |
The rule was identical on seven pairs: gold against silver (GC/SI), gold against platinum (GC/PL), silver against platinum (SI/PL), gold against copper (GC/HG), silver against copper (SI/HG), copper against platinum (HG/PL) and the E-mini S&P 500 against the E-mini Nasdaq-100 (ES/NQ).
Rules every spread trade in the test followed
Every spread trade in the 20-year test used the same five rules.
- Hedge ratio. Each session, regress the log price of the first leg on the log price of the second over the trailing 252 sessions, about one trading year.
- Signal. The gap from that fit, divided by its standard deviation, is the z-score. A trade triggers the first session the z-score reaches 2 or more, sold if the first leg is rich and bought if it is cheap.
- Contracts. One to three contracts on the first leg, with the whole-contract count on the second leg that comes closest to the dollar hedge ratio. The fit and counts are frozen at entry.
- Exits. Target when the z-score comes back inside 0.5, stop when it reaches 4 on the entry side, which is two more standard deviations against you, and a time limit at 60 sessions.
- Fills and costs. Signals are read on the close and filled at the next session's open. Each trade pays one tick of slippage per contract per leg on the way in and again on the way out, plus an assumed $4.00 per contract round turn for commission and fees.
Signals run from August 2006 for ES/NQ and September 2006 for the pairs without platinum. The platinum series has gaps in its early years, so platinum pairs start in August 2007, which gives those three pairs about 19 years.
Limits of the spread data
Two limits apply to every figure from this 20-year spread test. The continuous series is not back-adjusted, so a contract roll during a trade can add a price jump that no one could trade. Daily bars also cannot show what happened inside a session, so every fill is a session open. Treat the results as a measurement of the method, not a track record.
Related lesson: Mean reversion trading
Why Correlation Is a Poor Spread Screen
The usual first screen for a spread is how closely the two contracts move together. In the 20-year test, the daily return correlation across all 15 possible pairs of the six contracts ranged from close to zero to above 0.9.
| Pair | Daily return correlation | Median one-year fit R squared |
|---|---|---|
| ES/NQ | 0.922 | 0.923 |
| GC/SI | 0.794 | 0.756 |
| SI/PL | 0.680 | 0.669 |
| GC/PL | 0.580 | 0.419 |
| SI/HG | 0.447 | 0.420 |
| HG/PL | 0.422 | 0.528 |
| GC/HG | 0.350 | 0.344 |
| HG/ES | 0.289 | 0.341 |
| HG/NQ | 0.245 | 0.264 |
| PL/NQ | 0.244 | 0.214 |
| PL/ES | 0.233 | 0.261 |
| SI/ES | 0.153 | 0.317 |
| SI/NQ | 0.140 | 0.261 |
| GC/ES | 0.033 | 0.253 |
| GC/NQ | 0.031 | 0.270 |
On a textbook screen, ES/NQ is the best spread in the set by a wide margin.
Spread results for the seven tested pairs
The spread trading results tell a different story. This table shows what the 20-year test's z-score rule (enter at 2.0, target 0.5, stop at 4.0, 60-session limit) produced on the seven tested pairs. The last column is a bootstrap 95% range for the average net trade: if it spans zero, the pair's result cannot be told apart from luck.
| Pair | Trades | Win rate | Net after costs | Worst drawdown | Range for the average trade |
|---|---|---|---|---|---|
| GC/SI | 44 | 40.9% | $159,296 | -$148,855 | -$7,132 to $17,355 |
| GC/PL | 42 | 52.4% | -$49,914 | -$219,162 | -$10,166 to $8,026 |
| SI/PL | 49 | 55.1% | $61,550 | -$196,930 | -$10,729 to $12,790 |
| GC/HG | 48 | 45.8% | -$132,486 | -$202,894 | -$9,514 to $4,134 |
| SI/HG | 49 | 44.9% | $65,073 | -$231,639 | -$13,697 to $18,514 |
| HG/PL | 43 | 39.5% | -$100,004 | -$165,450 | -$7,008 to $2,293 |
| ES/NQ | 45 | 42.2% | $19,738 | -$66,740 | -$2,640 to $3,732 |
The most tightly linked pair, ES/NQ, made the smallest profit of the four winners, $19,738 over 45 trades in 20 years. GC/SI, with a lower correlation, made the most, but only after a worst drawdown of -$148,855 along the way. Four of seven pairs finished positive, and the range for the average trade spans zero on all seven.
Across the 320 trades, 106 closed at the target, 117 at the stop and 97 at the time limit. A rule that stops out more often than it reaches its target is a sign that the gaps it bets on were widening more often than closing.
The lesson is about what correlation measures. Correlation says two prices tend to move the same way on the same day. A spread needs something else: a gap that comes back after it opens. Two contracts can move together almost every day and still drift apart for a year.
Related lesson: Correlation risk
How Sensitive Spread Results Are to Two Settings
A spread trading rule with a real edge should survive small changes to its settings. The z-score pairs rule in the 20-year test did not. Each cell shows net profit after costs, with the number of trades in brackets, when one setting changes and everything else stays the same as the base rule of a 2.0 entry and a 60-session hold limit.
| Pair | Entry at 1.5 SD | Entry at 2.0 SD | Entry at 2.5 SD | Hold limit 20 | Hold limit 120 |
|---|---|---|---|---|---|
| GC/SI | $47,009 (62) | $159,296 (44) | -$78,860 (30) | $152,537 (56) | $112,469 (40) |
| GC/PL | -$124,279 (54) | -$49,914 (42) | $1,621 (27) | -$3,803 (53) | -$44,889 (36) |
| SI/PL | -$143,187 (69) | $61,550 (49) | -$363,582 (27) | -$166,435 (64) | -$6,221 (46) |
| GC/HG | $309,902 (72) | -$132,486 (48) | $24,428 (38) | -$163,751 (57) | -$537,917 (45) |
| SI/HG | -$160,169 (71) | $65,073 (49) | -$19,018 (31) | $185,019 (62) | $297,883 (47) |
| HG/PL | $86,831 (69) | -$100,004 (43) | $66,537 (27) | -$49,696 (54) | -$45,543 (42) |
| ES/NQ | -$47,456 (63) | $19,738 (45) | -$21,260 (33) | $33,794 (62) | -$47,196 (40) |
SI/PL made $61,550 at a 2.0 entry and lost $363,582 at 2.5. GC/HG lost $132,486 at the base setting and made $309,902 with an earlier entry. Only GC/SI stayed positive at four of the five settings, and it still lost $78,860 at the 2.5 entry.
That pattern is what overfitting looks like from the inside. If you test a dozen settings and keep the best one, you will find a winner in almost any pair, and it will mostly describe the past sample. A spread worth trading should be profitable across a range of reasonable settings, not at one.
How Long a Spread Dislocation Lasts
In spread trading, every trade is a bet that a gap closes, so the length of a typical gap decides your hold limit, your capital tie-up and how much patience the trade needs. The 20-year test measured it two ways.
The first is direct. Every time a pair's z-score reached 2 while no episode was open, the study froze the fit and counted sessions until the z-score came back inside 0.5, following each episode for up to 250 sessions. The second fits how much of the gap survives from one session to the next and converts it to a half-life, the number of sessions for half the gap to close.
This guide's 20-year test produced these episode counts and lengths for each pair.
| Pair | Episodes | Median sessions to close | Closed within 20 | Closed within 60 | Not closed within 250 | Widened to 3 SD | Implied half-life |
|---|---|---|---|---|---|---|---|
| GC/SI | 24 | 24 | 29% | 33% | 9 | 75% | 32.7 |
| GC/PL | 23 | 24 | 30% | 43% | 9 | 65% | 31.3 |
| SI/PL | 27 | 21 | 33% | 44% | 8 | 59% | 26.5 |
| GC/HG | 16 | 169 | 0% | 6% | 11 | 94% | 33.0 |
| SI/HG | 28 | 51 | 25% | 43% | 6 | 64% | 29.3 |
| HG/PL | 26 | 53.5 | 15% | 42% | 6 | 73% | 28.0 |
| ES/NQ | 22 | 25 | 18% | 32% | 12 | 77% | 36.5 |
In this guide's test, the median column looks manageable, at 21 to 53.5 sessions for six of the seven pairs. The tail is the warning. Of 166 episodes across the seven pairs, 61 had not closed after 250 sessions, roughly a full trading year. On ES/NQ, 12 of 22 episodes never closed within that year under the fit that triggered them.
Spread gaps that widened before closing
In this guide's 20-year test, most spread gaps got worse before they got better. Between 59% and 94% of episodes widened to 3 standard deviations, half again as far as the entry, at some point. A spread trader who enters at 2 needs a plan for 3, because on these pairs it was the normal path rather than the exception.
The tempting plan is to add at 3, because the spread now looks even cheaper. That is averaging down into a relationship that may be telling you something has changed. A stop written down before entry exists so that decision is made while you are calm, not while the position is 3 standard deviations against you.
The half-life column runs from 26.5 to 36.5 sessions, which says a typical gap fades over one to two months. Half-life is an average, though, and averages hide the year-long episodes that hurt.
Whole Contracts and the Spread Hedge Ratio
A spread's fitted hedge ratio comes out as a decimal, such as 0.66, and you cannot trade 0.66 of a contract. Rounding to whole contracts changes the position you actually hold, sometimes by a lot.
The 20-year test measured this for the smallest real position: one contract on the larger leg and the nearest whole number on the other. The daily swing is the standard deviation of the position's daily dollar change across the sample, compared with what the exact fractional ratio would have produced.
| Pair | Median hedge error at one lot | Daily swing, whole contracts | Daily swing, exact ratio | Difference in daily swing | Held count differed from refit |
|---|---|---|---|---|---|
| GC/SI | 38.1% | $2,963 | $2,338 | +26.7% | 27.3% |
| GC/PL | 16.0% | $2,449 | $2,501 | -2.1% | 61.2% |
| SI/PL | 12.9% | $3,128 | $3,143 | -0.5% | 64.5% |
| HG/PL | 17.4% | $1,829 | $1,742 | +5.0% | 43.2% |
| ES/NQ | 17.6% | $1,389 | $1,299 | +6.9% | 39.4% |
On GC/SI, the one-lot version missed the fitted ratio by a median of 38.1% and swung 26.7% more each day than the exact hedge, $625 of extra daily movement that had nothing to do with the relationship. On ES/NQ the extra swing was 6.9%. On the other pairs rounding barely changed the daily swing, because a hedge ratio fitted on log prices is not exactly the lowest-volatility hedge either. The copper pairs against gold and silver are left out of this table because their fitted ratios were so small at times that a one-lot hedge stopped meaning anything.
Why the spread contract count stays frozen
The last column of that rounding table is the reason to freeze the count. During the trades the z-score rule took in this guide's 20-year test, a fresh fit would have called for a different contract count on 27.3% to 64.5% of held sessions. Re-estimating mid-trade means changing the position for a reason that has nothing to do with whether the gap is closing.
For spread trading in equity index futures, smaller contracts make rounding less painful. CME's Micro E-mini S&P 500 is $5 per index point and the Micro E-mini Nasdaq-100 is $2 per index point, a tenth of ES and NQ, so a ratio can be matched in steps ten times finer.
Related lesson: Position sizing futures contracts
Two ES and NQ Spread Trades Priced Line by Line
Two real trades from the ES/NQ log in the 20-year test show how a spread makes and loses money. Neither is the best or worst trade in the log.
A winning ES and NQ spread trade
The winning ES/NQ spread trade came from a September 2022 signal, when the S&P 500 contract looked cheap against the Nasdaq-100 contract.
| Item | Winning trade |
|---|---|
| Signal | September 26, 2022, z-score -2.36, hedge ratio 0.609, R squared 0.963 |
| Position | Long 2 ES at 3,668.00, short 1 NQ at 11,315.50 |
| Leg notional | $366,800 of ES against $226,310 of NQ |
| Exit | October 25, 2022 open, ES 3,803.25, NQ 11,453.75 |
| ES leg | +$13,525 |
| NQ leg | -$2,765 |
| Gross | $10,760 |
| Costs | $72, made of $60 slippage and $12 commission |
| Net | $10,688 after 20 sessions, closed at the target |
Because ES was cheap, the rule bought ES and sold NQ. Both rallied. ES gained 135.25 points, worth $13,525 on two contracts, while NQ gained 138.25 points, a $2,765 loss on the short. The relationship did the work, and the short leg paid part of the bill, exactly as a spread is meant to behave. The $10,760 gross win sits close to the pair's median winning trade of $10,222.
A losing ES and NQ spread trade
The losing ES/NQ spread trade came from a February 2022 signal, when the S&P 500 contract looked rich against the Nasdaq-100 contract.
| Item | Losing trade |
|---|---|
| Signal | February 3, 2022, z-score +2.29, hedge ratio 0.776, R squared 0.921 |
| Position | Short 3 ES at 4,518.00, long 2 NQ at 14,770.00 |
| Leg notional | $677,700 of ES against $590,800 of NQ |
| Exit | May 3, 2022 open, ES 4,145.50, NQ 13,051.75 |
| ES leg | +$55,875 |
| NQ leg | -$68,730 |
| Gross | -$12,855 |
| Costs | $115, made of $95 slippage and $20 commission |
| Net | -$12,970 after 60 sessions, closed at the time limit |
Because ES looked rich, the rule sold ES and bought NQ. Both indexes then fell hard. The short ES leg made $55,875, but the long NQ leg lost $68,730 because the Nasdaq-100 fell further. Nothing about the market was unusual for a selloff. The relationship simply kept moving against the position for 60 sessions.
What would have warned you on the entry day? Very little. The fit had an R squared of 0.921 and the gap was an ordinary 2.29 standard deviations. The only protection was what had been set beforehand, the 60-session limit that closed the trade and the contract count.
Rounding made the loss worse. At the fitted ratio of 0.776, the NQ leg should have been about $525,900 of notional, but two NQ contracts were $590,800. At the exact ratio, the NQ leg would have lost about $61,200 and the trade's gross loss would have been about $5,300, not $12,855. Over half of this loss came from holding more NQ than the fit called for.
What Costs Do to a Two-Leg Spread
Every spread trading position pays twice, once per leg, on the way in and on the way out. In the 20-year test that came to one tick of slippage per contract per leg each way plus $4.00 per contract round turn, which is an assumption rather than any broker's rate.
| Pair | Median cost per trade | Median winning trade before costs | Net at one tick | Net at two ticks |
|---|---|---|---|---|
| GC/SI | $126 | $11,905 | $159,296 | $153,336 |
| GC/PL | $86 | $13,910 | -$49,914 | -$53,094 |
| SI/PL | $166 | $11,470 | $61,550 | $54,150 |
| GC/HG | $101 | $13,884 | -$132,486 | -$137,026 |
| SI/HG | $191 | $16,020 | $65,073 | $56,148 |
| HG/PL | $101 | $11,750 | -$100,004 | -$103,519 |
| ES/NQ | $100 | $10,222 | $19,738 | $16,268 |
On daily-bar spreads in full-size contracts, costs are small against a typical winner, about 1% of it. Doubling slippage to two ticks a leg each way cut GC/SI by $5,960 and ES/NQ by $3,470, and it did not change the sign of any pair. In this test, costs were not what decided the result. The relationship was.
That changes quickly with shorter holds or smaller targets. A spread trader aiming for a few ticks of relative value on an intraday chart pays the same two-leg cost on a much smaller win, and the cost share rises from about 1% toward a large fraction of the edge.
Related lesson: Commission-adjusted futures breakeven
Spread Trading on a Funded Futures Account
Spread trading on a prop or funded futures account runs into rules that a personal brokerage account does not have. Three matter most.
First, a drawdown rule sees both legs. Exchange margin may treat a recognised spread as one lower-risk position, but a trailing drawdown measured on account value counts the combined swing of both legs. The ES/NQ spread in the 20-year test held a median of 5 contracts and about $509,000 of combined notional per trade, and its worst run of losses was -$66,740.
Second, many firms require positions to be closed every day. Every pair in the 20-year test needed weeks to work, with median episode lengths of 21 to 169 sessions, so the strategy as tested cannot exist on an intraday-only account.
Third, many firms prohibit hedging, and a spread is a hedge by design. Check how a firm's rules treat opposing positions in related products before you plan any spread trade.
On our accounts, the spreads in this study are not allowed. Opposing positions in two products from the same Product Group count as prohibited hedging, in one account or across accounts, and our Help Center's own example is long ES with short NQ. Gold, silver, copper and platinum all sit in our Metals group. A calendar spread holds opposite positions in two months of one product, and both months belong to that product's group, so it falls under the same rule. All positions also close by 4:45 PM ET, with no overnight holds.
Spread Trading FAQ
What is spread in trading?
In trading, "spread" has two meanings. The bid-ask spread is the gap between the highest bid and the lowest ask, and it is a cost on every trade. A spread trade is a position that buys one contract and sells a related one, so it profits from the change in the difference between them.
Is pairs trading the same as spread trading?
Pairs trading is one kind of spread trading. Spread trading covers any long and short in related contracts, including calendar spreads and product spreads. A pairs trade picks the two legs and the ratio statistically and bets that a gap from the usual relationship will close.
Is 1 pip spread good?
A 1 pip spread is good when it is small next to your target and bad when it is not. On a 10-pip target it takes about 10% of the move, and on a 100-pip target about 1%. Compare it with the typical spread for that currency pair and with your own average win, not with a fixed rule.
Is spread trading less risky than outright trading?
Spread trading usually has lower day-to-day volatility than an outright position, which is why exchanges often charge less margin on recognised spreads. It is not low risk. In this guide's 20-year test, every pair had a worst drawdown in the tens or hundreds of thousands of dollars, and relationships stayed broken for a year at a time.
How long should you hold a spread trade?
Long enough for a typical gap to close, and no longer than the point where the trade has told you the relationship is not behaving. In this guide's 20-year futures test, the median gap closed in 21 to 53.5 sessions on six of the seven pairs, but more than a third of gaps had not closed after 250 sessions. Set the time limit before you enter.
Can both legs of a spread lose at the same time?
Yes. If you are long one leg and short the other, the position loses whenever the long leg falls further or rises less than the short leg. Both legs can lose in the same session only when prices move against both positions at once, such as the long leg falling while the short leg rises, which is when spreads lose fastest.
Spread trading involves futures and, in some forms, options, and both can lose more than you expect, quickly. A spread holds two positions and carries the risk of both legs plus the risk that the relationship between them changes, so it can lose in rising, falling and flat markets. The 20-year results in this guide are historical measurements under stated assumptions about fills and costs, not the results of any trading account and not a forecast. Funded and evaluation accounts at prop firms are simulated. Nothing here is investment advice or a recommendation to trade any contract.


