




TL;DR: Pairs trading buys one instrument and shorts a related one, betting that the gap between them closes rather than on market direction. Across six pairs and 6,023 sessions to November 4, 2026, a 2.0 z-score divergence closed at its mean 24.8% of the time. The hedge ratio drifted as much as 80.6% in two years, which quietly turns a pair into a directional bet. Test cointegration, size from spread volatility, and check the holding time before trusting a pair.
Pairs trading is usually the first strategy traders meet after they learn to short. Two instruments that normally move together drift apart. You buy the laggard, short the leader, and wait for the gap to close.
Simple is not the same as easy. The part that decides whether the strategy works is a measurement question most explanations skip: when the gap opens, how often does it actually close, how far does it run against you first, and does the hedge still mean what it meant on the day you placed it?
This guide answers those with a six-pair study run on five years of daily closes, then covers the full method: the spread, the z-score, cointegration testing, entry and exit rules, sizing, pair selection, and what it takes to automate.
Related lesson: Short selling mechanics
What pairs trading is and how a pair trade works
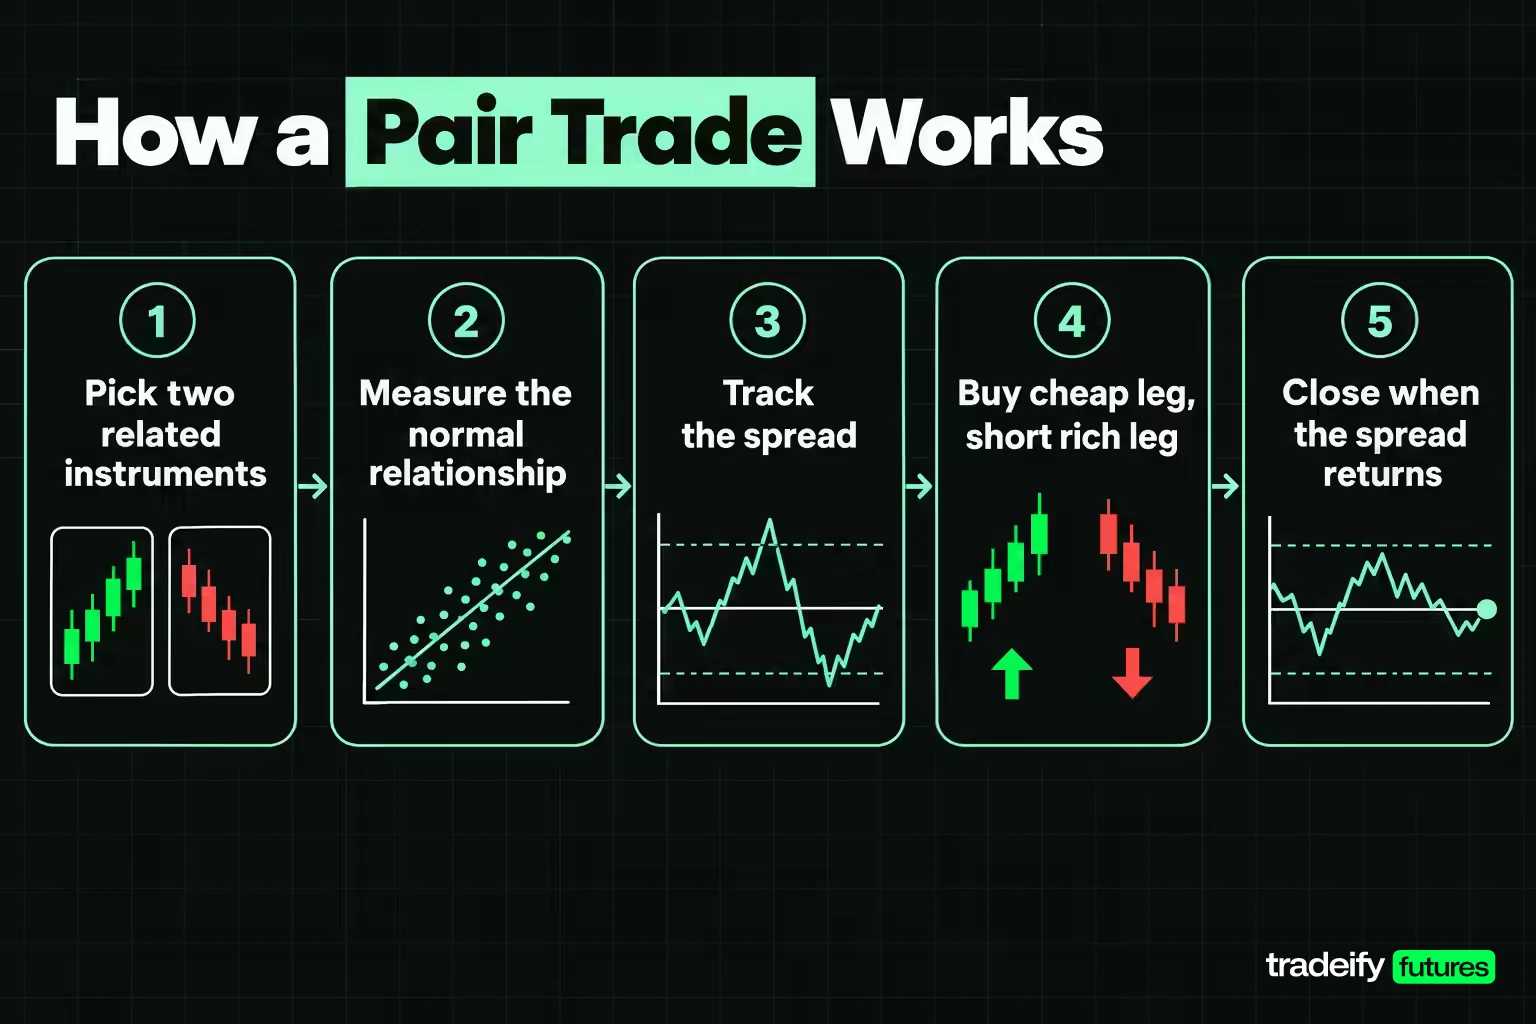
Pairs trading is a relative-value strategy. You hold two positions at once, long one instrument and short a related one, and the trade pays when the price relationship between them returns to its usual shape. Whether the market as a whole goes up or down matters less than whether the gap narrows.
The mechanics run in a fixed order:
- Pick two instruments with a shared economic driver, such as two payment networks, two gold miner funds or two points on the Treasury curve.
- Measure their normal relationship over a lookback window, usually with a regression that produces a hedge ratio.
- Track the spread, meaning the gap between the two after the hedge ratio is applied.
- When the spread stretches unusually far from its average, buy the cheap leg and short the rich leg.
- Close both legs when the spread returns to its average, or when a stop or time limit says the relationship has changed.
The strategy has a long research record. Gatev, Goetzmann and Rouwenhorst tested it on US stocks with daily data from 1962 through 1997 in a 1999 NBER working paper. They matched stocks by the smallest distance between their normalized price paths and reported average annualized excess returns of up to 12% for portfolios of top pairs. They also noted that part of those profits may come from market microstructure effects. That second sentence matters as much as the first one.
A pair trade is a bet on a relationship. If the relationship holds, direction barely matters. If it breaks, you can lose on both legs at once.
Is pairs trading market neutral
Pairs trading is often called market neutral, and that is only partly true. A pair is closer to neutral than an outright long, because a broad selloff hits the long leg and helps the short leg. It is not free of direction, and the leak comes from how the legs are sized.
There are two common ways to balance a pair:
- Dollar neutral. Equal dollars long and short. Simple, but if one leg is more volatile than the other, a market move still pushes the spread.
- Hedge-ratio neutral. The short leg is sized by a regression coefficient (the hedge ratio), so a typical move in one leg is offset by the matching move in the other.
Futures make the sizing visible. The E-mini S&P 500 (ES) is worth $50 times the index and the E-mini Nasdaq-100 (NQ) is worth $20 times its index, per CME's contract specifications. At illustrative prices of 6,000 on ES and 21,000 on NQ, one ES controls $300,000 of notional and one NQ controls $420,000.
A hedge ratio of 0.65 says to short $195,000 of NQ against each ES, which is 0.46 of a contract. You cannot trade 0.46 of a contract. Two ES against one NQ gives a ratio of 0.70, and seven ES against five NQ is dollar neutral at $2,100,000 a side. Every rounding choice leaves a small directional position behind.
The bigger leak is time. The hedge ratio comes from history and history moves. A pair that was balanced on entry day can carry a meaningful net exposure a month later, which is covered with measured numbers in the risk section.
Related lesson: Beta and market risk
Correlation vs cointegration in a pair
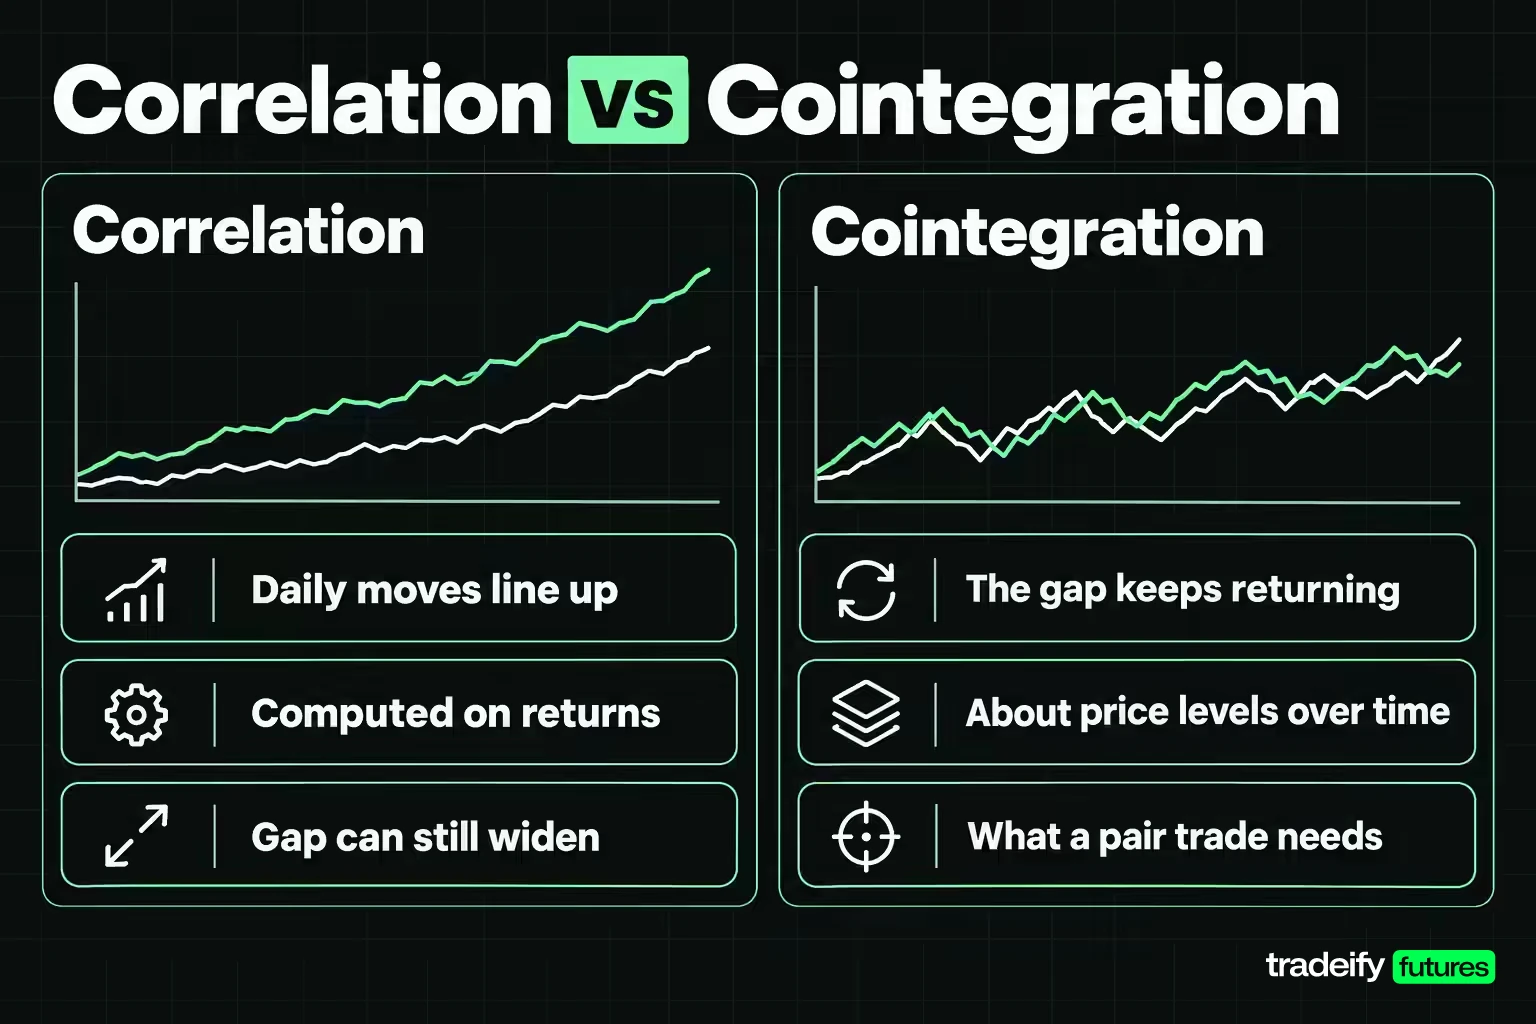
Correlation and cointegration get used as if they were the same thing in pairs trading. They are not, and mixing them up is the most common way a pair goes wrong.
Correlation measures whether two instruments move in the same direction on the same days. It is computed on returns, and a high reading says the daily moves line up.
Cointegration measures whether the distance between two price series keeps returning to a stable average. It is a statement about price levels over time, not about daily moves.
A pair can be highly correlated and still not cointegrate. Imagine two instruments that rise and fall together every day, with one rising slightly faster on average. The daily correlation stays high while the gap between them widens year after year. A mean-reversion trade on that gap keeps waiting for a return that never comes.
The six-pair study in this guide shows the problem in live data. GDX against GDXJ, two gold miner funds, carried a one-year return correlation of 0.99, the highest in the set. At a 2.0 z-score entry its signals averaged -0.08 spread standard deviations per trade. Crude oil against RBOB gasoline had the lowest correlation at 0.75 and posted the best result, +0.63. High correlation was not a useful filter on its own.
The pair you want has both: a shared driver that keeps daily moves aligned, and a spread that statistically returns to its average.
Related lesson: Correlation risk
How to test a pair for cointegration
Cointegration testing is how you check that a spread actually returns to its average before you bet on it. The idea was formalized by Clive Granger, who shared the 2003 economics prize for it with Robert Engle. The most common method for a single pair is the Engle-Granger two-step test.
The Engle-Granger two-step test for a pair
- Regress one price on the other. Use log prices over a formation window and fit log A = alpha + beta x log B. The slope, beta, is the hedge ratio.
- Test the leftovers. Take the residuals from that regression, which is the spread, and run a unit-root test such as the augmented Dickey-Fuller test on them. If the test rejects a unit root, the spread is stationary and the pair is cointegrated over that window.
Two details catch people. The critical values for a residual test are stricter than the textbook Dickey-Fuller values, because the hedge ratio was estimated from the same data. And the result depends on which leg you put on the left side, so test both orders. When a pair has more than two related legs, the Johansen test handles several series at once.
Half-life and the data a pair test needs
A cointegration test says whether the gap returns. The half-life says how fast. Regress the daily change in the spread on the prior day's spread; a negative slope gives a half-life of ln(2) divided by that slope's absolute value, measured in sessions.
Half-life is the practical number. In the six-pair study, half-lives on the latest 252-session window ran from 11 sessions on the 10-year note against bond futures to 41 on E-mini S&P against Nasdaq-100. If the typical divergence takes 41 sessions to halve, a trader who wants to be out in a week is using the wrong pair.
Data requirements are modest but strict:
- Clean daily closes for both legs on the same dates, with splits handled for stocks and contract rolls handled for futures.
- At least one full formation window, commonly 252 sessions (about a year), plus a separate period to test on.
- A rule for refitting. Testing on the same data you fitted is look-ahead bias, the most common way a pair looks better on paper than it trades.
Related lesson: Statistical arbitrage
Calculating the pairs trading spread and z-score
The pairs trading spread is the gap between two instruments after the hedge ratio is applied. With log prices it is:
Spread = log(price A) - hedge ratio x log(price B) - alpha
Log prices make the spread scale-free, so a $40 fund and a $500 stock can share one formula. The hedge ratio and alpha come from the regression in the cointegration step.
A raw spread value means little by itself. The z-score turns it into a reading of how unusual today's gap is compared with the lookback window:
Z-score = (today's spread - average spread over the window) / standard deviation of the spread over the window
Take an illustrative case. The spread is -0.050, the window average is 0.010 and the standard deviation is 0.025. The z-score is (-0.050 - 0.010) / 0.025 = -2.4. Leg A is 2.4 standard deviations cheap relative to leg B, which is the setup for buying A and shorting B.
Choosing z-score thresholds for a pair
Common entry thresholds sit between 1.5 and 2.5 standard deviations, with an exit at or near zero. Lower thresholds trade more often and need a higher hit rate. Higher thresholds trade less and leave less room before the stop.
Bollinger Bands on the spread do the same job visually: a two standard deviation band around a moving average of the spread is a z-score threshold of 2.0 drawn on the chart. The math is identical; the z-score just makes it easier to compare pairs.
One choice has a big effect. If the mean and standard deviation update every day, the z-score can move toward zero simply because the window absorbed the divergence, not because the gap closed. The study in this guide freezes the hedge and the window statistics at entry, so a close means the actual spread came back.
Pairs trading entry and exit signals
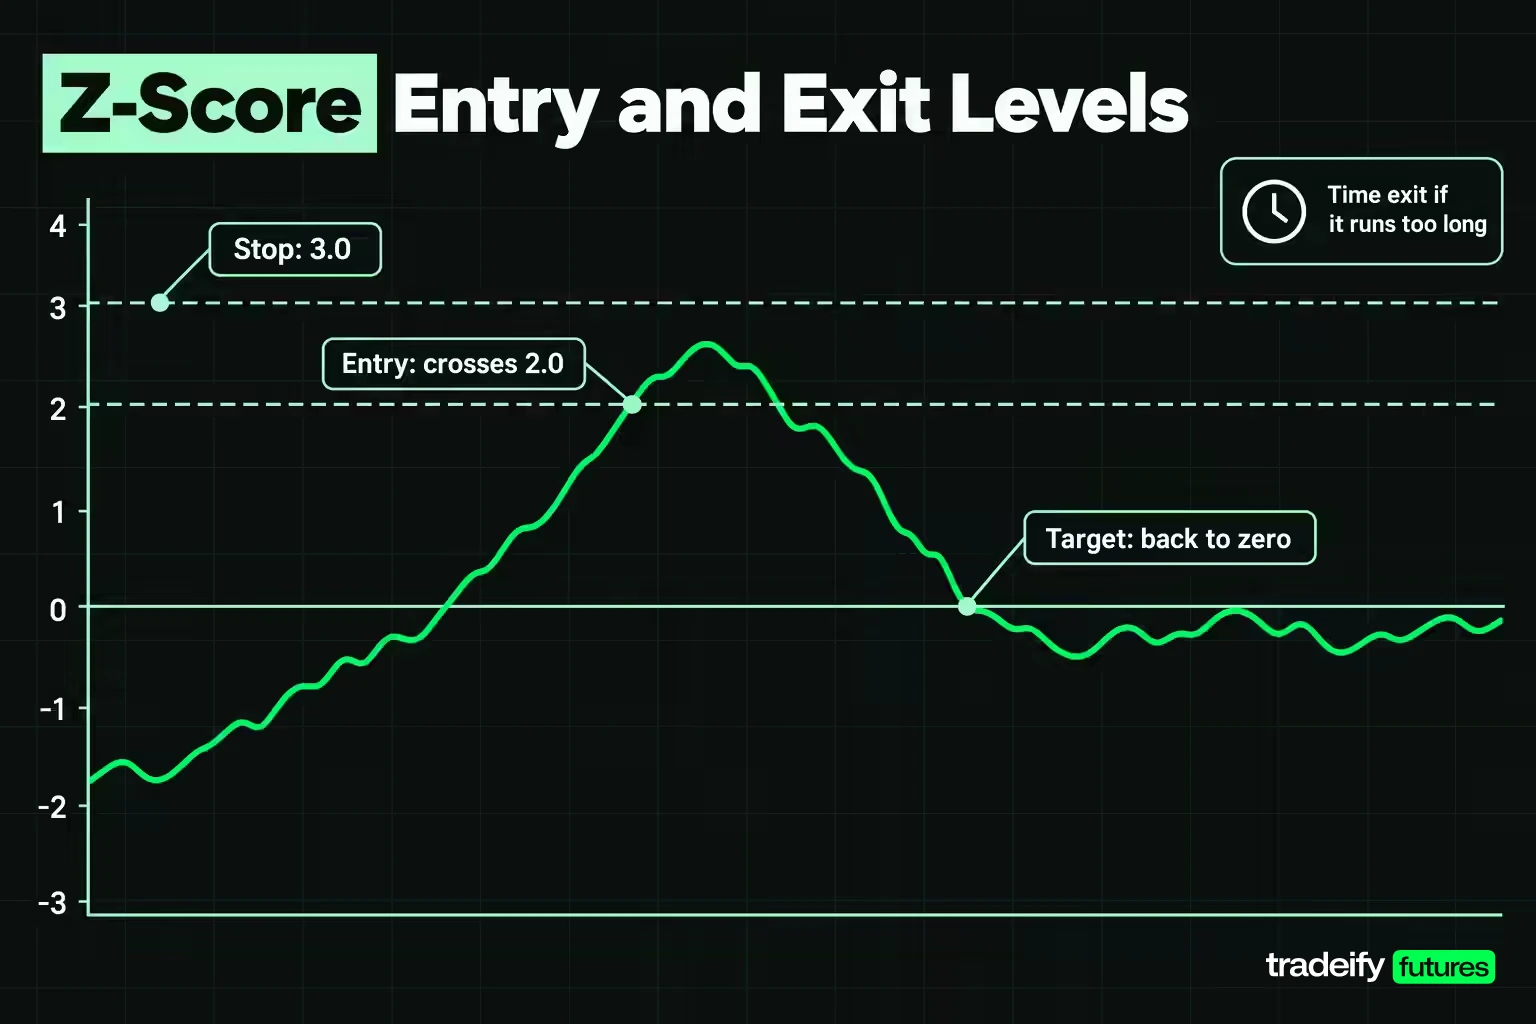
A complete pairs trading rule has four exits for every entry, and they have to be decided before the trade, not during it.
- Entry. The z-score crosses a threshold, such as 2.0, after being below it.
- Target. The z-score returns to zero, meaning the spread is back at its average.
- Stop. The z-score keeps stretching to a level that says the relationship may have changed, such as 3.0.
- Time exit. The trade has run longer than the pair's half-life justifies, so it is closed whatever the z-score says.
The entry and the stop together fix the hit rate a rule needs. With the target at the mean and the stop at 3.0, a 2.0 entry wins about 2.0 standard deviations when it works and loses about 1.0 when it fails, a 2 to 1 ratio. That math sets the break-even closure rate:
| Entry z-score | Win at the mean | Loss at a 3.0 stop | Break-even closure rate |
|---|---|---|---|
| 1.0 | 1.0 SD | 2.0 SD | 66.7% |
| 1.5 | 1.5 SD | 1.5 SD | 50.0% |
| 2.0 | 2.0 SD | 1.0 SD | 33.3% |
| 2.5 | 2.5 SD | 0.5 SD | 16.7% |
The table ignores time exits and costs, so treat it as a floor. It explains why a wide entry feels safer on paper: the bar to clear is lower. It also shows why a wide entry is fragile. A 2.5 entry leaves only half a standard deviation before the stop, and one bad session can take it out.
Missing the entry does not make the next reading a good entry. If the z-score jumped from 1.8 to 2.7 overnight, that is a different trade: closer to the stop, with less room and a different break-even rate.
Related lesson: Pairs and spread trading
How often a pair divergence closes in six measured pairs
The divergence rate is the number this guide is named for: when a pair stretches to an entry threshold, how often does the gap actually close? The six-pair study below measures it.
How the pairs divergence rate was measured
- Data. Daily closes from Yahoo Finance, five years to November 4, 2026. Futures use Yahoo's front-month continuous series, which is not back-adjusted for rolls.
- Pairs. Visa vs Mastercard, GDX vs GDXJ (large and junior gold miner funds), XLE vs XOP (energy sector and oil exploration funds), 10-year note vs bond futures, E-mini S&P vs Nasdaq-100, and crude oil vs RBOB gasoline.
- Hedge. A regression of log A on log B over the trailing 252 sessions, refitted every session, so no trade uses data it would not have had.
- Signal. The first session the z-score reaches the threshold after being below it. Entry at that close.
- Exits. Target when the z-score crosses zero, stop at 3.0, or a 60-session time limit. The hedge and window statistics are frozen at entry.
- Scoring. Results in spread standard deviations (SD), so pairs with different volatility are comparable.
After the first 252 sessions of each pair went to the opening formation window, the study measured 6,023 sessions from November 2022 to November 4, 2026.
Divergence closure results by pair
In this guide's six-pair study, a 2.0 entry produced 137 signals. Only 34 closed at the mean, a closure rate of 24.8%, against the 33.3% the break-even table asks for. 77 hit the 3.0 stop and 26 ran out the 60-session clock.
| Pair | Signals | Closed at the mean | Stopped at 3.0 | Timed out | Closure rate | Average result | Every-day entry average |
|---|---|---|---|---|---|---|---|
| Visa vs Mastercard | 26 | 5 | 15 | 6 | 19.2% | +0.13 SD | -0.06 SD |
| GDX vs GDXJ | 19 | 5 | 13 | 1 | 26.3% | -0.08 SD | +0.20 SD |
| XLE vs XOP | 16 | 2 | 7 | 7 | 12.5% | +0.14 SD | +0.19 SD |
| 10-year note vs bond futures | 27 | 5 | 15 | 7 | 18.5% | -0.19 SD | -0.08 SD |
| E-mini S&P vs Nasdaq-100 | 32 | 10 | 19 | 3 | 31.2% | +0.17 SD | +0.56 SD |
| Crude oil vs RBOB gasoline | 17 | 7 | 8 | 2 | 41.2% | +0.63 SD | +0.70 SD |
Only crude oil against RBOB gasoline cleared break-even at 2.0. The overall result was still slightly positive, +15.09 SD across 137 signals or +0.11 per signal, for two reasons the break-even table leaves out. Closed trades overshot the mean and averaged +2.41 SD, and 20 of the 26 time exits ended in profit, averaging +0.55. Stops cost -1.05 SD on average, a little more than the planned 1.0, because a spread can gap past 3.0 between closes.
The entry threshold changes the result. At 1.5 the closure rate rose to 37.7% over 207 signals but no pair cleared its 50.0% break-even. At 2.5 it fell to 15.0% over 60 signals, and three of six pairs cleared the lower 16.7% bar. A bigger divergence closed less often, which fits the idea that the widest gaps are more likely to come from real news than from noise.
The base rate a pairs signal has to beat
A closure rate proves little on its own. The fair comparison is the same exit applied to every session where the z-score already sat between 2.0 and 3.0, with no crossing trigger at all.
That every-day population held 643 entries and averaged +0.24 SD, more than double the +0.11 for the fresh-crossing signal. In five of six pairs the every-day average beat the signal. On E-mini S&P vs Nasdaq-100, 958 of 1,000 random draws of 32 entries from the every-day population matched or beat the signal's average.
So the crossing trigger, the entry most tutorials teach, added nothing in this sample. Whatever edge existed came from the pair, the exit and the stop, not from the moment the threshold was crossed. That is uncomfortable if you have been waiting for the perfect cross, and useful if it stops you from forcing one.
How long the measured pair trades lasted
Holding time at 2.0 had a median of 23 sessions. Trades that closed at the mean took a median of 24 sessions and never fewer than 5. Only 8 of 137 signals ended the session after entry, and those were mostly stops.
Daily-bar pairs trading is a multi-week strategy. A trader who has to be flat every afternoon would need a different, intraday version, built and tested on intraday data.
Pairs trading risks the spread chart hides
The risks in pairs trading belong to the same family as all statistical arbitrage: the relationship you modeled stops describing the market. In this guide's six-pair study of daily closes from November 2022 to November 4, 2026, they showed up in five specific ways.
Hedge ratio drift in a pair
The hedge ratio is fitted from the past and it moves. Visa against Mastercard went from 0.57 on October 30, 2024 to 1.02 on November 4, 2026, a change of +80.6%, and traded between 0.56 and 1.49 inside those two years. E-mini S&P against Nasdaq-100 moved from 0.97 to 0.65, a change of -32.3%.
A position sized at the old ratio and held through that shift is no longer hedged at the ratio the spread was built from. It still looks like a pairs trade on screen. It behaves like a directional position with an unexplained partial hedge on the other side.
Regime breaks and clustered pair stops
A spread that has reverted for years can stop reverting. GDX against GDXJ had the most stable hedge ratio in the set, moving just -4.2% in two years. Even so, its five signals in 2026, entered from August 19 to October 12, all stopped out between August 21 and October 14, each within 2 to 10 sessions. Visa against Mastercard showed the same pattern: its last five signals in 2026 all stopped out.
Stops cluster because the cause is shared. Once a relationship changes, every new signal in that pair is another bet on the old one. The temptation after the second stop is to call the third signal a bargain. The data says to stand aside until the pair passes the screen again.
Gap, overlap and short-leg risks in a pair trade
- Gap risk. In this guide's study, of 77 stops at a 2.0 entry, the median exit was at a z-score of 3.18, the worst at 4.08, and 8 exited beyond 3.5. A stop on a spread works off closing prices in this study and can be jumped.
- Overlapping signals. On Visa against Mastercard, 15 of 26 signals opened while an earlier signal in the same pair was still open. Four overlapping entries are one bet, not four.
- Short-leg risk. A short stock leg needs borrowed shares, can carry borrow fees, and can be recalled. A short squeeze in one name can blow out a spread that has nothing wrong with its statistics.
- Execution and legging risk. Two legs filled at different moments can start the trade at a worse spread than the signal showed. Wide bid-ask spreads on either leg make this worse.
- Roll and data risk. Continuous futures series jump at contract rolls. A spread built on unadjusted data can show a divergence that is just a roll, which is a known limitation of the futures pairs in this study.
Sizing a pair trade and managing its risk
Risk in a pairs trade belongs to the spread, not to either leg. The size that matters is how many dollars one standard deviation of the spread is worth, multiplied by the distance from the entry to the stop.
Two dated Visa against Mastercard trades from the study show the arithmetic. Both size the first leg at about $100,000 and the second leg at the entry-day hedge ratio, using Yahoo closes and an illustrative commission of $0.005 per share per side.
A pair trade that closed. On October 7, 2024 the z-score hit -2.04 with a hedge ratio of 0.69. The trade bought 365 Visa shares at $273.79 ($99,933.35) and shorted 141 Mastercard shares at $491.30 ($69,273.30). One spread standard deviation was worth $2,109.01, so the planned risk to the 3.0 stop was $2,033.38. On October 31, 2024, after 18 sessions, the z-score reached +0.12. Visa closed at $289.85 and Mastercard at $499.59. The Visa leg made $5,861.90, the Mastercard leg lost $1,168.89, and the pair netted $4,693.01 before $5.06 of commission.
A pair trade that stopped. On February 13, 2025 the z-score hit +2.10 with a hedge ratio of 0.98. The trade shorted 281 Visa shares at $355.63 ($99,932.03) and bought 174 Mastercard shares at $566.31 ($98,537.94), with planned risk of $2,691.90. Both stocks fell in the following weeks. On April 10, 2025, after 39 sessions, the z-score closed at +3.19, past the stop. Visa was at $324.61 and Mastercard at $499.34. The short Visa leg made $8,716.62 and the long Mastercard leg lost $11,652.78, a net loss of $2,936.16 plus $4.55 of commission, more than the planned risk because the spread closed beyond 3.0.
Note what the losing trade did. Both legs fell hard together, which is the move a pair is supposed to survive, and the trade still lost because the two legs fell by different amounts. Neutral in a calm market is not neutral in a fast one.
Risk rules for pairs trading positions
- Size from the spread's own volatility, recalculated on each signal, not from either leg's volatility.
- Put the stop in spread standard deviations and convert it to dollars on the day you enter.
- Cap total open risk per pair. Treat overlapping signals in one pair as a single position.
- Cap the number of pairs that share a driver, such as two energy pairs, because they tend to fail together.
- Use a time exit tied to the pair's half-life, so capital and attention are not stuck in a relationship that has gone quiet.
Related lesson: Position sizing
How to choose pairs for pairs trading
Pair selection decides most of the result, and it is where a little skepticism pays. The screen below runs in order, and a pair has to pass each step before the next one matters.
- Shared economic driver. Same sector, same inputs, same customers or the same rate curve. A pair that only looks alike on a chart has no reason to come back together.
- Cointegration on the formation window. Run the Engle-Granger test both ways, and repeat it on a later window.
- Stable hedge ratio. Compare the current ratio with its range over the last two years. A ratio that has moved by more than about a fifth is a variable, not a constant.
- Half-life inside your holding window. If the spread takes longer to halve than you can hold, the pair does not fit your schedule.
- Liquidity and costs. Both legs need tight bid-ask spreads and, for stocks, shares available to borrow.
- Out-of-sample check. The pair should still work on data the selection never saw.
Screen readings for six measured pairs
Here is how the six pairs from this guide's study looked on that screen as of the November 4, 2026 close, using Yahoo Finance daily data:
| Pair | 1-year return correlation | Hedge ratio Oct 30, 2024 | Hedge ratio Nov 4, 2026 | Two-year change | Half-life in sessions |
|---|---|---|---|---|---|
| Visa vs Mastercard | 0.87 | 0.57 | 1.02 | +80.6% | 34 |
| GDX vs GDXJ | 0.99 | 0.95 | 0.91 | -4.2% | 29 |
| XLE vs XOP | 0.92 | 0.68 | 0.88 | +29.4% | 18 |
| 10-year note vs bond futures | 0.92 | 0.60 | 0.64 | +6.8% | 11 |
| E-mini S&P vs Nasdaq-100 | 0.92 | 0.97 | 0.65 | -32.3% | 41 |
| Crude oil vs RBOB gasoline | 0.75 | 0.54 | 0.74 | +37.3% | 16 |
No single column picked the winner. Crude against RBOB had the lowest correlation and a drifting hedge ratio, yet the best result, helped by a short 16-session half-life. GDX against GDXJ passed the correlation and stability columns and still lost. That is the honest lesson of pair selection: the screen removes bad pairs, but it cannot promise a good one.
There are two broad ways to run the screen. Distance methods (the 1999 NBER approach) rank pairs by how closely their normalized prices tracked each other. Cointegration methods test the spread directly. Both work best as filters, followed by an out-of-sample test.
Related lesson: Backtesting a trading strategy
Pairs trading across stocks, ETFs, futures and currencies
Pairs trading works in any market where two instruments share a driver, but the mechanics change from one asset class to the next.
- Stocks. The classic version: two companies in the same industry. The short leg needs borrowed shares, and company news such as earnings or a merger can break the relationship in a day.
- ETFs. Sector and size pairs, such as large against junior gold miners. ETFs hold many names, so single-company shocks matter less, but overlapping holdings can make two funds look more related than their drivers are.
- Futures. Shorting needs no borrow, and the exchange contract specifications set the multipliers. Crude oil is 1,000 barrels per contract and RBOB gasoline is 42,000 gallons, so a crude against gasoline pair has to convert both legs to the same unit before the spread means anything. The 10-year note and bond contracts both carry $100,000 of face value but very different price sensitivity, which is why their hedge ratio sits well below 1. Exchanges also list spread products for some of these relationships, and futures legs need rolling as contracts expire.
- Currencies. Currency pairs are already a ratio of two currencies, so a pairs trade in currencies usually means two related exchange rates, such as two commodity-linked currencies against the dollar.
- Crypto. "Trading pair" on a crypto exchange just means the two assets being swapped, such as a coin quoted in dollars. A pairs trade in crypto is the same long-short relationship trade, with higher volatility, round-the-clock trading and funding costs on perpetual contracts to account for.
Related lesson: Hedging risk
Algorithmic pairs trading and what it takes to run
Most serious pairs trading is algorithmic, because the work is mostly measurement and bookkeeping. A system screens many candidate pairs, refits hedge ratios, computes z-scores and places both legs at once, which is hard to do by hand on more than a few pairs.
Manual vs automated pairs trading
Manual pairs trading works for a trader who follows two or three pairs and is happy with daily signals. A spreadsheet that pulls closing prices, refits the regression and shows the z-score is enough to start. The risk is discipline: it is easy to skip a refit, move a stop, or chase an entry the rule did not give.
Automated pairs trading removes those decisions but adds new failure points. A system can place one leg and fail on the other, trade on a bad data print, or keep trading a pair after its relationship broke because nobody told it to stop.
What a pairs trading system needs
- Data. Clean, aligned price history for every candidate, with splits, dividends where relevant and futures rolls handled the same way in testing and live trading.
- Compute. Daily-bar pairs testing runs on a laptop. Screening thousands of stock pairs, or running intraday pairs on minute bars, needs more storage and processing.
- Execution. Simultaneous or tightly linked orders on both legs, with a plan for a partial fill on one side.
- Monitoring. Alerts when a hedge ratio moves outside its range, when a pair's stops cluster, or when total open spread risk passes a cap.
- Testing discipline. Walk-forward refitting, so the test never uses the future, and a held-back period to confirm results.
Machine learning in pairs trading
Machine learning shows up in two places in pairs trading: clustering instruments to find candidate pairs, and models that try to predict whether a divergence will close. Both are research tools rather than shortcuts. More parameters make it easier to fit the past, so the out-of-sample test matters even more than it does for a simple z-score rule.
Pairs trading rules in funded futures accounts
Pairs trading and prop-firm accounts collide in two places. Many firms prohibit holding opposing positions in correlated products, which is exactly what a pair is. And many funded futures programs require traders to be flat at the end of each session, while the daily-bar pairs trades in this guide's six-pair study held for a median of 23 sessions.
If you trade through a prop or funded account, read its hedging and holding-time rules before you design any long-short idea. A rule that treats a correlated long and short as a hedge can turn a textbook pair into an account violation.
On our accounts, pairs trading in futures is effectively off the table. Holding opposing positions in two products from the same Product Group, such as long ES and short NQ, is a hedging violation whether the legs sit in one account or across several, and we may treat any other offsetting position as a hedge too. Every position also has to be closed by 4:45 PM ET, with no overnight or swing holds, and our funded accounts are simulated. Use pairs analysis as market context, such as reading whether ES or NQ is leading, rather than as a two-legged trade.
Pairs trading FAQ
Is pairs trading still profitable?
It can be, but the edge is thin and depends on the pair. In this guide's six-pair study, a 2.0 entry averaged +0.11 spread standard deviations per signal before costs, and only one of six pairs beat its break-even closure rate. Published research, such as the 1999 NBER study of US stocks, found stronger results in earlier decades.
What are the best pairs for pairs trading?
The best pairs share a real economic driver, pass a cointegration test on more than one window, keep a stable hedge ratio, and have a half-life that fits your holding time. Classic examples are two companies in one industry or two funds tracking related sectors. Correlation alone is a weak screen: in this guide's six-pair study, GDX against GDXJ had the highest correlation, 0.99, and still posted a negative result.
Is pairs trading the same as statistical arbitrage?
Pairs trading is the simplest form of statistical arbitrage. Statistical arbitrage is the wider family, which includes baskets of many instruments, factor-neutral portfolios and higher-frequency models. Both rely on a relationship that has to keep holding.
How long does a pairs trade last?
On daily bars, usually weeks. In this guide's six-pair study of Yahoo Finance daily closes from November 2022 to November 2026, the median holding time at a 2.0 entry was 23 sessions, and trades that closed at the mean took at least 5 sessions. Intraday pairs trading exists, but it needs its own intraday testing.
What z-score should you use to enter a pairs trade?
Most pairs trading rules use 1.5 to 2.5, with an exit at zero. The entry you pick sets the hit rate you need: with the target at the spread's mean and a 3.0 stop, a 2.0 entry needs 33.3% of trades to close at the mean, and a 1.5 entry needs 50.0%. Measure your pair's actual closure rate before choosing.
This guide is educational and is not investment advice or a recommendation to trade any pair. The study results are historical, come from one sample of six pairs and one rule, and do not predict future results. Pairs trading holds two positions, so both legs can lose at once, and a short leg can lose more than the capital committed to it. Futures are leveraged and can lose more than expected. Results in simulated accounts, including prop-firm evaluation and funded accounts, do not guarantee live outcomes.


