



TL;DR: ROC indicator readings measure the percent change in price over a set lookback, so the lookback decides what counts as a big move. On a year of E-mini S&P 500 closes, the 12-session zero line flipped 43 times. Those crossings netted 438.31 points against 722.75 for simply holding. Use ROC to describe speed and confirm a trend, not as a standalone entry signal.
The line pokes up through zero, the chart looks like it has turned, and the temptation is to take the trade before the move gets away. That moment is where most rate of change mistakes start.
The rate of change (ROC) indicator is one of the simplest tools on most charts. It compares today's close with a close from a fixed number of bars ago and prints the gap as a percentage. That is the whole calculation. The hard part is everything traders do with the number afterwards. A reading of minus 2 can be ordinary on one market and rare on another. A zero line cross can be the start of a move or the fourth flip in a week. This guide covers the ROC indicator formula, the settings, how to read the line, and then tests the most common ROC rule on 252 real sessions of E-mini S&P 500 futures so you can see what a zero line signal was actually worth after costs.
What the ROC Indicator Measures
The ROC indicator (rate of change) measures how fast price is changing. It takes the current close, compares it with the close n periods earlier, and expresses the difference as a percentage of that older close. StockCharts' ChartSchool calls it a pure momentum oscillator, and that description fits, because nothing in it is averaged or smoothed.
When price is higher than it was n bars ago, the ROC indicator is positive. When price is lower, ROC is negative. When the two closes match, ROC sits exactly on zero. The further price has travelled over the lookback, the further the line moves from zero.
TrendSpider attributes the indicator to Fred G. Schutzman and dates it to the 1950s. The idea is older than most of the oscillators traders now stack on top of it, and many of those later tools are, underneath, smoothed or bounded versions of the same comparison.
ROC Percent, Momentum and Ratio Versions
Platforms show the same ROC indicator comparison in three forms:
- Percent ROC, the default: (close / close n bars ago, minus 1) x 100.
- Momentum, the raw version: close minus close n bars ago, in the chart's own price units.
- Ratio: close / close n bars ago, with no subtraction and no scaling.
The percent version is the one you can compare across instruments and price levels. The momentum version is the one your profit and loss is measured in, because a futures contract pays per point, not per percent. Keep those two straight, because a percent threshold and a point stop are not the same thing.
The ROC indicator also has a lopsided scale. ChartSchool points out that a security can only fall 100%, to zero, while there is no ceiling on an advance. So a big positive reading and a big negative reading of the same size are not mirror images of each other.
What ROC does not tell you is just as important. It says nothing about why price moved, whether the move will continue, or where a stop belongs. It is a measurement of the past n bars. Every use beyond that is interpretation you add on top.
Related lesson: Momentum trading
ROC Formula and How to Calculate It
The ROC indicator formula needs two closing prices and one division:
ROC = ((Current close - Close n periods ago) / Close n periods ago) x 100
A round-number check makes it concrete. A close of 12 against a close of 10 five periods earlier is plus 20.00%. Change the older close to 8 and the identical 4-point gain reads plus 50.00%. The same move in points gives a different ROC depending on where it started, which is exactly why the percentage is useful when comparing markets.
A Worked ROC Calculation on E-mini S&P 500 Closes
Here is a 12-session ROC on the E-mini S&P 500 (ES) futures, computed from daily closes in the Yahoo Finance continuous front-month series for the 13 sessions ending November 3, 2026. Every row can be checked by hand from the two closes it shows. These are historical closes used as an illustration.
| Date | ES close | Base date | Base close | Change in points | Ratio | ROC(12) |
|---|---|---|---|---|---|---|
| 2026-10-16 | 7,704.25 | 2026-09-30 | 7,715.50 | -11.25 | 0.998542 | -0.1458% |
| 2026-10-19 | 7,734.50 | 2026-10-01 | 7,724.00 | 10.50 | 1.001359 | 0.1359% |
| 2026-10-20 | 7,755.25 | 2026-10-02 | 7,777.25 | -22.00 | 0.997171 | -0.2829% |
| 2026-10-21 | 7,800.25 | 2026-10-05 | 7,826.25 | -26.00 | 0.996678 | -0.3322% |
| 2026-10-22 | 7,704.50 | 2026-10-06 | 7,874.00 | -169.50 | 0.978473 | -2.1527% |
| 2026-10-23 | 7,659.75 | 2026-10-07 | 7,852.75 | -193.00 | 0.975423 | -2.4577% |
| 2026-10-26 | 7,714.50 | 2026-10-08 | 7,816.25 | -101.75 | 0.986982 | -1.3018% |
| 2026-10-27 | 7,758.25 | 2026-10-09 | 7,859.75 | -101.50 | 0.987086 | -1.2914% |
| 2026-10-28 | 7,783.25 | 2026-10-12 | 7,858.00 | -74.75 | 0.990487 | -0.9513% |
| 2026-10-29 | 7,754.25 | 2026-10-13 | 7,855.75 | -101.50 | 0.987080 | -1.2920% |
| 2026-10-30 | 7,614.00 | 2026-10-14 | 7,770.25 | -156.25 | 0.979891 | -2.0109% |
| 2026-11-02 | 7,574.50 | 2026-10-15 | 7,791.00 | -216.50 | 0.972212 | -2.7788% |
| 2026-11-03 | 7,596.75 | 2026-10-16 | 7,704.25 | -107.50 | 0.986047 | -1.3953% |
What the Worked ROC Chain Shows
In the ROC chain for the 13 sessions ending November 3, 2026, read the last row first. On November 3, 2026, ES closed at 7,596.75. Twelve sessions earlier it closed at 7,704.25. The difference is minus 107.50 points, the ratio is 0.986047, and the ROC(12) reading is minus 1.3953%.
Now look at what the ROC column does across those 13 sessions. On October 21, 2026, ES closed at 7,800.25, its highest close in the 13 sessions, yet ROC(12) was negative at minus 0.3322%, because the base close twelve sessions earlier was higher still. A rising close and a falling ROC can sit on the same bar. ROC is always a comparison with a moving base, so the line can turn because the old close dropped out of the window, not because anything happened today.
Why Two Platforms Show Different ROC Values
The lookback has an off-by-one that catches traders out. ChartSchool notes that a 12-day ROC actually spans 13 trading days, because the first close is only the starting point. Some platforms and scripts count the offset differently, and the cost of that difference is measurable.
On the same 252 ES sessions, a 12-session ROC and a 13-session ROC differed by 0.6172 percentage points on average, and by as much as 3.1137 on a single session. They were on opposite sides of zero on 27 of 252 sessions. The 12-session line crossed zero 43 times over the year and the 13-session line 49 times.
So if a chart you were shown disagrees with your own, check three things in this order: the lookback count, the price source (close, typical price or something else), and the contract or continuous series being charted. Only then question the data.
The ROC indicator also needs no warm-up. Because it uses two closes and nothing else, a fresh chart with 13 bars of history prints exactly the same ROC(12) as a chart with years of history. Smoothed indicators such as MACD do not behave that way, so when a short chart and a long chart disagree, the smoothed tool is the usual suspect.
ROC Settings and Lookback Periods
The lookback is the only real ROC indicator setting, and it works more like a unit of time than a sensitivity dial. A 2% move over 5 sessions and a 2% move over 50 sessions describe two very different markets. Until you fix the lookback, there is no answer to the question of how much ROC is a lot.
ROC indicator defaults differ by platform. TradingView's built-in ROC uses a length of 9 with close as the source. Much of the older stock literature, including ChartSchool's worked examples, uses 12. Neither is correct in any general sense. They are starting points.
ROC Threshold Frequency by Lookback Period
This table, from this guide's own calculation on Yahoo Finance's daily ES closes, shows how often ES's ROC cleared fixed thresholds over the 252 sessions from November 3, 2025 to November 3, 2026, at four lookbacks. SD is the standard deviation of the readings over the same window.
| ROC lookback | Highest | Lowest | SD | Above 5% | Above 3% | Above 2% | Above 1% | Below -1% | Below -2% | Below -3% | Below -5% |
|---|---|---|---|---|---|---|---|---|---|---|---|
| 5 sessions | 5.4174% | -3.8729% | 1.7173 | 0.79% | 7.94% | 13.89% | 30.56% | 25.79% | 7.94% | 1.98% | 0.00% |
| 12 sessions | 10.7815% | -5.4171% | 2.5490 | 3.97% | 16.27% | 25.79% | 37.30% | 25.79% | 13.49% | 5.16% | 0.40% |
| 20 sessions | 12.3787% | -7.2587% | 3.1993 | 9.92% | 20.24% | 32.94% | 45.63% | 25.40% | 14.29% | 7.14% | 1.19% |
| 50 sessions | 15.6054% | -8.5007% | 4.3439 | 25.00% | 44.84% | 57.94% | 70.63% | 11.90% | 10.32% | 6.35% | 3.17% |
Follow the "Above 2%" column down. A 2% reading showed up on 13.89% of sessions at a 5-session lookback, 25.79% at 12 sessions, 32.94% at 20 and 57.94% at 50. A level that sounds stretched on a short lookback becomes the normal state of the market on a long one. At TradingView's default of 9, the 2% line was cleared on 21.03% of sessions, with an SD of 2.2317.
The 50-session row also shows a lean to the upside. ES rose over the window, so long-lookback readings spent most of their time positive, with only 11.90% of sessions below minus 1%. A lookback long enough to span the trend picks up the trend's direction along with its speed.
Choosing a ROC Setting for Your Holding Period
A practical way to choose: match the lookback to the length of move you are trying to measure, then measure it on your own market.
- If you hold for minutes inside one session, a short ROC on a short intraday chart measures the swings you actually trade. A 12-bar ROC on a 5-minute chart compares price with one hour ago.
- If you hold for days, a 10 to 20 session ROC on a daily chart matches a two to four week view.
- If you want a slow trend backdrop, 50 sessions or more on a daily chart works, but expect it to stay on one side of zero for long stretches.
Then keep the setting fixed. After a losing streak, switching to whichever lookback would have caught the last move feels like learning. It is curve fitting in real time, and ROC threshold frequencies show the cost: on ES, a 2% reading went from 13.89% of sessions at a 5-session lookback to 57.94% at 50, so every change of lookback also changes what every threshold means.
Related lesson: Backtesting a trading strategy
How to Read ROC Indicator Signals

Reading the ROC indicator comes down to four questions, asked in order. Each one adds information the previous one could not.
- Which side of zero? Positive means price is above where it was n bars ago. Negative means below. This is a description, not a forecast.
- Which way is the line moving? A rising ROC means the recent gain is getting larger, or the recent loss smaller. A falling ROC means the opposite. Slope tells you whether momentum is building or fading.
- How far from zero? Distance shows how fast price has moved over the lookback.
- How unusual is that distance? This needs history: the reading's percentile within its own past year on that instrument and that lookback.
A Worked ROC Indicator Reading on ES
Take the November 3, 2026 ES reading as a worked example of the four questions. ES's ROC(12) printed minus 1.3953%, after minus 2.7788% the session before. Side: negative, so price was below its level twelve sessions earlier. Slope: rising, because the loss over the window shrank in one day. Distance: about 1.4% under the base. Rarity: ES's ROC(12) had a 25th percentile of minus 1.02% over the past year, so the reading was in the lower quarter but nowhere near an extreme. The 5th percentile was minus 2.93%.
The same day's ROC(9), TradingView's default, printed minus 2.6089%. Same market, same close, a different story about how stretched the move was. That is why the lookback has to travel with any ROC number you quote.
Notice what the read does not produce: a trade. It is an observation, and treating an observation as confirmation is how traders end up chasing a bar that has already moved. A signal needs a rule that says what confirms it and what invalidates it, and for ROC that rule usually comes from price itself (a break of a swing level, a reclaim of a moving average) or from another tool that measures something ROC does not.
The ROC Zero Line Test on 252 Sessions
The ROC zero line crossover is the ROC indicator rule most guides teach first. When ROC crosses from negative to positive, buy. When it crosses from positive to negative, sell. The logic is that price has moved from below its level n bars ago to above it, so the short-term trend has turned.
ChartSchool itself warns that centerline crossovers are prone to whipsaw, especially on short lookbacks. It does not say how often. So this guide counted.
How the ROC Zero Line Test Was Run
The method, so anyone can repeat it:
- Data: Yahoo Finance's continuous front-month daily series for E-mini S&P 500 futures (ES=F), downloaded November 4, 2026.
- Window: 252 completed sessions from November 3, 2025 to November 3, 2026.
- Signal: ROC(12) on daily closes crossing zero. Up through zero is a long; down through zero is a short.
- Entry and exit: enter at the close of the crossing session, exit at the close 10 sessions later, whatever happens in between. No stops, no targets, no overlap rules.
- Costs: a modelled $29 round turn per ES contract, which is two ticks of slippage ($25 at $12.50 a tick) plus $4 of commission. That is 0.58 points per trade. This is an assumption, not any firm's fee schedule.
- Benchmark: buying one ES contract at the close before the window started (6,874.00) and holding to November 3, 2026 (7,596.75), a gain of 722.75 points, or 10.51%.
Because a 10-session hold runs past the next crossing more often than not, this is a test of what the crossing said about the next two weeks, not a tradeable system. That is the honest way to grade a signal before adding anything to it.
ROC Zero Line Results
| ROC(12) zero line measure | Result |
|---|---|
| Crossings in 252 sessions | 43 (21 long, 22 short) |
| Trades with a full 10-session hold | 43 |
| Gross result | 463.25 points |
| Net result after the modelled cost | 438.31 points ($21,915.50 on one ES) |
| Win rate | 46.51% (20 of 43) |
| Average winner and average loser | 137.48 and -100.49 points |
| Best and worst trade | 496.42 and -250.58 points |
| Net by side | long 55.07, short 383.24 points |
| Buy and hold over the same window | 722.75 points ($36,137.50 on one ES) |
The rule made money in this sample: 438.31 net points, or $21,915.50 on one ES contract. It also made 284.44 points less than simply holding the contract, and it took 43 decisions to get there. Forty-three times, a trader following it had to act on a flip that felt like a fresh signal, and fewer than half of those trades won.
The result also leans on a few trades. The best two, 496.42 and 241.92 points, carried the year. Without them, the other 41 trades netted minus 300.03 points. The worst three lost 660.99 points between them. A rule whose year depends on two trades is a rule whose next year depends on whether those two trades show up again.
ROC Zero Line Crossings From November 2025 to March 2026
Here is each ROC(12) zero line crossing in the test window, from this guide's calculation on Yahoo Finance's ES closes, with entry and exit closes. Net points subtract the 0.58-point modelled cost.
| Crossing date (Nov 2025 to Mar 2026) | Side | Entry close | Exit close | Gross points | Net points |
|---|---|---|---|---|---|
| 2025-11-06 | Short | 6,747.50 | 6,557.50 | 190.00 | 189.42 |
| 2025-11-07 | Long | 6,753.75 | 6,620.25 | -133.50 | -134.08 |
| 2025-11-12 | Short | 6,875.75 | 6,828.00 | 47.75 | 47.17 |
| 2025-11-25 | Long | 6,781.50 | 6,891.75 | 110.25 | 109.67 |
| 2025-11-26 | Short | 6,828.00 | 6,907.25 | -79.25 | -79.83 |
| 2025-12-02 | Long | 6,840.25 | 6,801.00 | -39.25 | -39.83 |
| 2025-12-15 | Short | 6,823.00 | 6,944.25 | -121.25 | -121.83 |
| 2025-12-22 | Long | 6,930.25 | 6,963.25 | 33.00 | 32.42 |
| 2026-01-14 | Short | 6,966.25 | 6,992.75 | -26.50 | -27.08 |
| 2026-01-15 | Long | 6,981.75 | 6,965.75 | -16.00 | -16.58 |
| 2026-01-20 | Short | 6,829.50 | 6,941.75 | -112.25 | -112.83 |
| 2026-01-21 | Long | 6,910.00 | 6,906.25 | -3.75 | -4.33 |
| 2026-01-23 | Short | 6,945.75 | 6,952.75 | -7.00 | -7.58 |
| 2026-01-26 | Long | 6,981.25 | 6,983.25 | 2.00 | 1.42 |
| 2026-01-29 | Short | 6,992.75 | 6,851.00 | 141.75 | 141.17 |
| 2026-02-02 | Long | 7,002.50 | 6,860.50 | -142.00 | -142.58 |
| 2026-02-03 | Short | 6,941.75 | 6,894.25 | 47.50 | 46.92 |
| 2026-02-06 | Long | 6,952.75 | 6,851.50 | -101.25 | -101.83 |
| 2026-02-11 | Short | 6,960.50 | 6,920.00 | 40.50 | 39.92 |
| 2026-02-24 | Long | 6,903.75 | 6,787.25 | -116.50 | -117.08 |
| 2026-02-26 | Short | 6,920.00 | 6,677.50 | 242.50 | 241.92 |
| 2026-03-04 | Long | 6,876.00 | 6,626.00 | -250.00 | -250.58 |
| 2026-03-05 | Short | 6,835.25 | 6,609.25 | 226.00 | 225.42 |
ROC Zero Line Crossings From April to October 2026
The second half of the ES ROC(12) zero line ledger, from this guide's calculation on Yahoo Finance's ES closes, uses the same 10-session hold and 0.58-point modelled cost.
| Crossing date (Apr to Oct 2026) | Side | Entry close | Exit close | Gross points | Net points |
|---|---|---|---|---|---|
| 2026-04-06 | Long | 6,651.00 | 7,148.00 | 497.00 | 496.42 |
| 2026-06-08 | Short | 7,416.00 | 7,437.50 | -21.50 | -22.08 |
| 2026-06-24 | Long | 7,428.25 | 7,588.75 | 160.50 | 159.92 |
| 2026-07-02 | Short | 7,528.25 | 7,497.75 | 30.50 | 29.92 |
| 2026-07-06 | Long | 7,591.50 | 7,484.25 | -107.25 | -107.83 |
| 2026-07-17 | Short | 7,497.75 | 7,519.25 | -21.50 | -22.08 |
| 2026-07-21 | Long | 7,545.75 | 7,765.50 | 219.75 | 219.17 |
| 2026-07-22 | Short | 7,540.25 | 7,749.50 | -209.25 | -209.83 |
| 2026-08-03 | Long | 7,628.25 | 7,768.75 | 140.50 | 139.92 |
| 2026-08-20 | Short | 7,662.50 | 7,754.75 | -92.25 | -92.83 |
| 2026-09-03 | Long | 7,754.75 | 7,657.35 | -97.40 | -97.98 |
| 2026-09-04 | Short | 7,722.00 | 7,833.50 | -111.50 | -112.08 |
| 2026-09-08 | Long | 7,680.50 | 7,831.75 | 151.25 | 150.67 |
| 2026-09-09 | Short | 7,643.75 | 7,772.50 | -128.75 | -129.33 |
| 2026-09-18 | Long | 7,657.35 | 7,777.25 | 119.90 | 119.32 |
| 2026-10-08 | Short | 7,816.25 | 7,704.50 | 111.75 | 111.17 |
| 2026-10-09 | Long | 7,859.75 | 7,659.75 | -200.00 | -200.58 |
| 2026-10-16 | Short | 7,704.25 | 7,614.00 | 90.25 | 89.67 |
| 2026-10-19 | Long | 7,734.50 | 7,574.50 | -160.00 | -160.58 |
| 2026-10-20 | Short | 7,755.25 | 7,596.75 | 158.50 | 157.92 |
Three things stand out across the full ROC zero line ledger. The single best trade, the April 6, 2026 long at 6,651.00, came after a sharp sell-off and caught a rebound that ran 497.00 points in ten sessions. ROC(12) then stayed positive from April 6 to June 8, 2026, with no crossing at all, which is the trend the zero line is meant to catch. And the busiest stretches, mid-January and October 2026, produced back-to-back crossings one session apart, where the market flipped sides and flipped straight back.
One data note: the September 18, 2026 close of 7,657.35 is the expiration-day print of the September contract in Yahoo's continuous series, which then switches to the December contract without adjustment. Roll jumps like that one are a known distortion in continuous futures data.
ROC Zero Line Result Against Random Entries
The ROC zero line rule's positive result on 43 ES trades proves very little until you compare it with chance. So, in this guide's own calculation, the same 43 trades were rerun 4,000 times with random entry sessions drawn from the same window, keeping the same sides, the same 10-session hold and the same 0.58-point cost.
The random draws averaged minus 36.50 points, and the middle 90% of draws ran from minus 1,783.44 to plus 1,765.18 points. The zero line rule's 438.31 points sat at the 67.4th percentile. It beat about two in three random draws, which sounds encouraging until you see how wide the luck band is. A result that would come from random timing one time in three is not evidence of an edge.
The holding period changes the grade, too:
| ROC(12) hold | Closed trades | Net points | Win rate | Random-entry mean | Percentile vs 4,000 draws |
|---|---|---|---|---|---|
| 5 sessions | 43 | 604.71 | 51.16% | -13.98 | 78.2th |
| 10 sessions | 43 | 438.31 | 46.51% | -36.50 | 67.4th |
| 20 sessions | 38 | 196.01 | 55.26% | 8.20 | 55.3th |
| 50 sessions | 33 | 458.86 | 48.48% | not run | not run |
At a 20-session hold the rule sat at the 55.3th percentile, close to the middle of the noise. The 20 and 50 session rows also leave 5 and 10 trades still open at the end of the window, so their totals rest on fewer closed trades.
Why ROC Zero Line Crossings Whipsaw
The reason the ROC zero line struggles is timing. In this guide's calculation on Yahoo Finance's ES closes, on ES's ROC(12) the median gap between crossings was 3 sessions, and 20 of the 43 crossings came within two sessions of the crossing before them. Nearly half the signals were the market announcing the same indecision twice, in opposite directions.
Changing the ROC lookback does not fix it, as this guide's own lookback sweep on the same Yahoo Finance ES data shows:
| ES ROC lookback (this guide's calculation) | Crossings | Median sessions between crossings | Within two sessions of the previous | Closed 10-session trades | Net points | Win rate |
|---|---|---|---|---|---|---|
| 5 sessions | 55 | 4.5 | 19 | 49 | -291.72 | 42.86% |
| 12 sessions | 43 | 3 | 20 | 43 | 438.31 | 46.51% |
| 20 sessions | 31 | 4.5 | 11 | 27 | -92.56 | 37.04% |
| 50 sessions | 19 | 3 | 8 | 15 | 246.38 | 60.00% |
In that sweep, two of the four lookbacks lost money and none beat holding the contract. Even the 50-session line, which crossed only 19 times, still had a median gap of 3 sessions, because its crossings came in clusters around the turns.
Nasdaq-100 futures (NQ) over the same window, in this guide's calculation on Yahoo Finance's NQ closes, told the same story at a larger scale. NQ's ROC(12) crossed zero 47 times with a median gap of 2 sessions, and 24 crossings came within two sessions of the previous one. With a modelled 0.70-point cost, the rule netted 1,702.14 points against 2,301.75 for holding, at the 59.8th percentile of 4,000 matched random draws.
Costs add up, too. Forty-three round turns at $29 is $1,247, or 24.94 points on one ES contract, before a single bad fill in a fast market.
ROC Overbought and Oversold Levels
Many guides treat the ROC indicator like RSI: pick a high level for overbought and a low level for oversold, then fade the extremes. ChartSchool's own examples use plus 10% and minus 10% on a 12-day or 20-day ROC for individual stocks, and it states that the right level depends on the volatility of the security. TradingView makes the same point: ROC is not range bound, so thresholds are less straightforward than on a bounded oscillator.
That caveat matters more than the levels. A fixed ROC threshold sits at a different point in the distribution on every market. Here are the ROC percentiles for ES and NQ over the same 252 sessions:
| Instrument and ROC lookback | 5th percentile | 25th | Median | 75th | 95th percentile | SD | Sessions above 5% |
|---|---|---|---|---|---|---|---|
| ES ROC(5) | -2.40% | -1.02% | 0.12% | 1.19% | 3.47% | 1.7173 | 0.79% |
| ES ROC(12) | -2.93% | -1.02% | 0.27% | 2.06% | 4.61% | 2.5490 | 3.97% |
| ES ROC(20) | -3.21% | -1.03% | 0.76% | 2.66% | 7.57% | 3.1993 | 9.92% |
| ES ROC(50) | -4.16% | 0.67% | 2.61% | 4.92% | 12.46% | 4.3439 | 25.00% |
| NQ ROC(5) | -4.08% | -1.65% | 0.01% | 2.18% | 5.04% | 2.7712 | 5.56% |
| NQ ROC(12) | -5.29% | -1.95% | 0.10% | 3.45% | 8.31% | 4.1377 | 15.48% |
| NQ ROC(20) | -4.72% | -2.36% | 0.36% | 4.10% | 12.08% | 5.2933 | 21.43% |
| NQ ROC(50) | -4.98% | -1.52% | 1.93% | 8.53% | 22.23% | 8.1269 | 34.52% |
A 5% reading on ROC(12) happened on 3.97% of ES sessions and 15.48% of NQ sessions, roughly 3.9 times as often, even though NQ's SD was only 1.62 times ES's. Carry a 5% "overbought" level from the S&P to the Nasdaq and you would be calling overbought four times as often for the same tool.
Measuring ROC Extremes in Standard Deviations
There is a simple fix for ROC thresholds that works well across markets. Measure each reading in standard deviations from its own past-year average instead of in raw percent. On that scale ES and NQ line up: ROC(12) readings more than one SD from the mean came on 29.76% of ES sessions and 30.16% of NQ sessions, and more than two SD on 4.37% and 4.76%. The catch is that you need about a year of history on the same instrument and lookback.
Did Extreme ROC Readings Mark Reversals
Even with a fair threshold, the bigger question is whether an extreme reading predicts a turn. So this guide's own test on Yahoo Finance's ES closes looked at what ES did over the next 10 sessions after its most extreme ROC(12) readings, scoring the 242 sessions that had a full 10 sessions after them.
| ES ROC(12) reading group (this guide's calculation) | Sessions | Mean change over the next 10 sessions | Higher 10 sessions later |
|---|---|---|---|
| Highest tenth (3.69% or more) | 26 | +103.15 points | 19 of 26 |
| Lowest tenth (-2.18% or less) | 25 | +112.66 points | 19 of 25 |
| Middle 191 sessions | 191 | +17.44 points | 95 of 191 |
| All scored sessions | 242 | +36.49 points | 133 of 242 |
In this guide's ES test, fading "overbought" would have been wrong 19 times out of 26: after the highest tenth of ROC readings, ES was higher ten sessions later on 19 of 26 occasions. Buying "oversold" looked better, with 19 of 25 higher, but in a year when the contract rose 10.51%, buying most dips worked. Both extremes were followed by bigger moves than the middle of the distribution, in this sample mostly upward.
The practical reading is that an extreme ROC marks a fast market, not a finished one. ChartSchool's own approach agrees with that in a way: in its uptrend example it uses ROC only to find short-term oversold dips in the direction of the bigger trend and ignores overbought signals altogether. Overlapping 10-session windows and one rising year also mean these counts are illustrative, not a law.
Related lesson: Relative strength index RSI
ROC Divergence and How Often It Worked
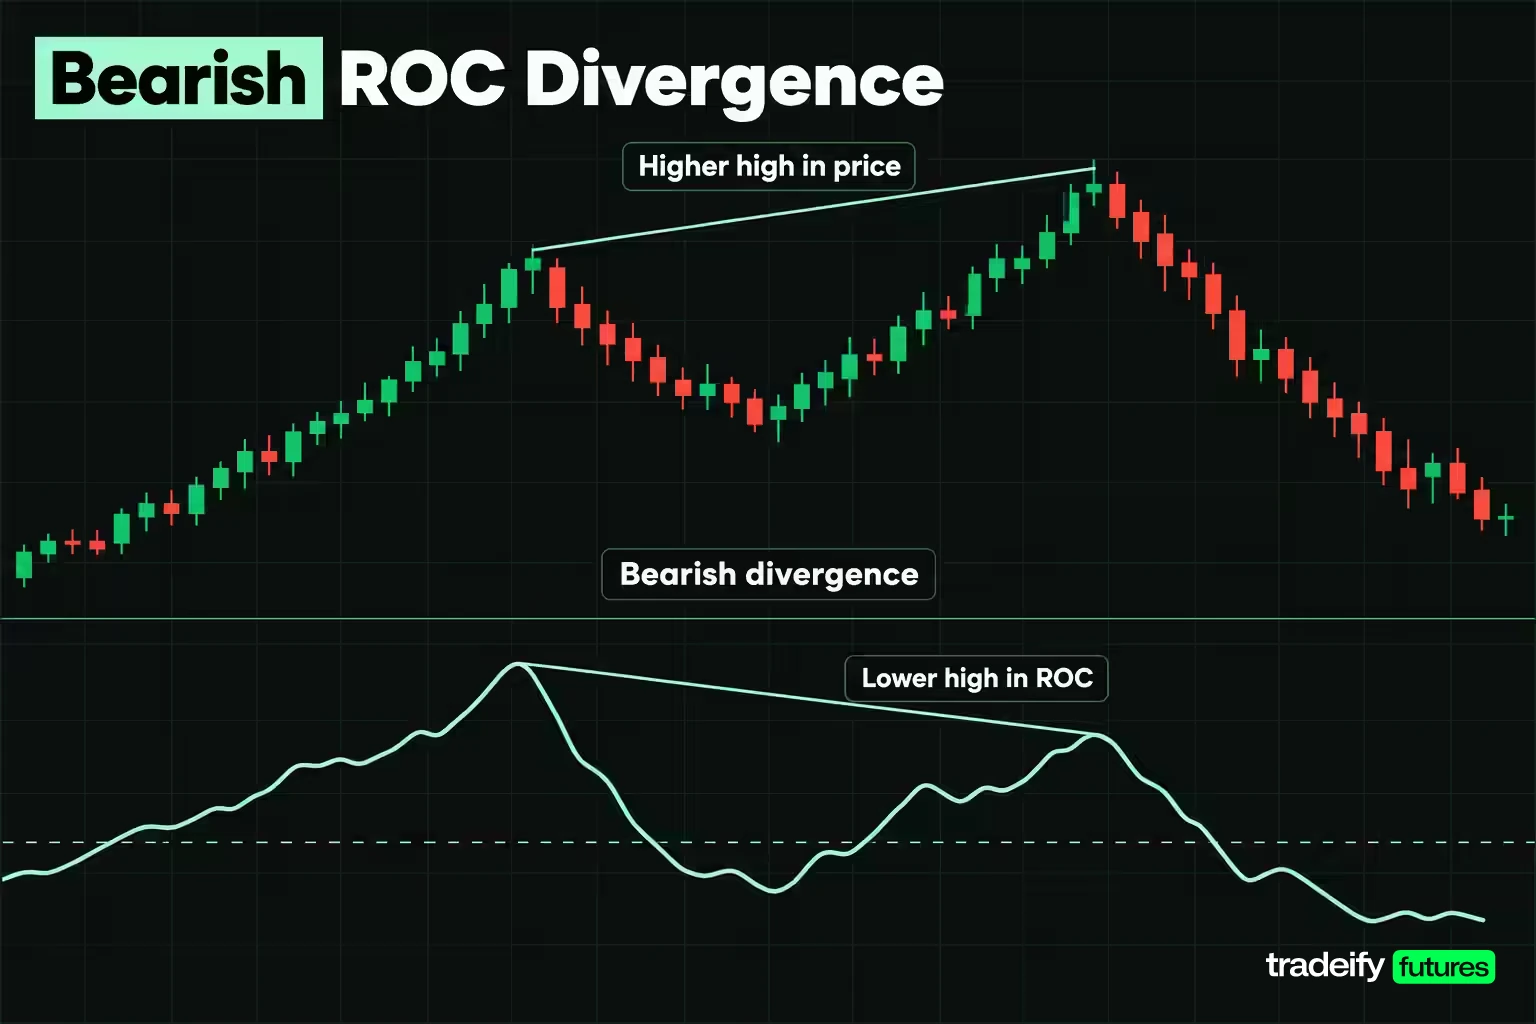
ROC divergence is a disagreement between price and the ROC indicator. A bearish divergence forms when price makes a higher high but ROC makes a lower high, which suggests the latest push came with less speed than the one before. A bullish divergence is the mirror image: a lower low in price with a higher low in ROC.
ChartSchool is unusually blunt about this signal. Its ROC page says divergences fail to foreshadow reversals more often than not, and it skips a detailed treatment for that reason.
Measured ROC Divergence on E-mini S&P 500 Futures
To measure ROC divergence, this guide's own test on Yahoo Finance's ES daily closes defined a swing high as a close that was the highest close within three sessions on either side, and a swing low the same way. A bearish divergence needed a swing-high close above the previous swing-high close with a lower ROC(12) reading. A bullish one needed a swing-low close below the previous swing-low close with a higher ROC(12) reading.
Over the 252 ES sessions from November 3, 2025 to November 3, 2026, price printed 23 swing highs and 25 swing lows, but only six divergences met the definition:
- Bearish: 3 (December 24, 2025, January 12, 2026 and June 2, 2026). Price was lower 10 sessions later in 2 of the 3, with a mean change of minus 30.25 points.
- Bullish: 3 (February 5, 2026, June 26, 2026 and October 16, 2026). Price was higher 10 sessions later in 2 of the 3, with a mean change of plus 57.83 points.
Two out of three sounds good. Three cases in a year is not a sample, though; it is an anecdote with a percentage attached. There is also a built-in lag: a swing high is only confirmed three sessions after it prints, so by the time the divergence exists, part of the move is already gone.
A workable ROC divergence rule treats it as a reason to tighten a plan, not as an entry. If you are long and a bearish divergence forms, check your stop and how much open profit you are willing to give back. If you want to trade it, wait for price to confirm with a break of the most recent swing low or high, and place the stop beyond the extreme that formed the divergence.
When the ROC Indicator Works and When It Struggles
The ROC indicator does its best work in a trending market, where it stays on one side of zero for long stretches and its slope shows whether the trend is speeding up or tiring. It does its worst work in a range, where price keeps returning to levels it held n bars ago and the line flips back and forth across zero.
This guide's ES test on Yahoo Finance's daily closes shows both sides of that. ROC(12) was positive on 140 of the 252 sessions, and on 135 of those, 96.43%, ES was also closing above its 50-session simple average. Positive ROC agreed with a rising trend almost every time. Negative ROC was a different story: it showed up on 112 sessions, but ES was below its 50-session average on only 59 of them, 52.68%. In a rising market, many negative readings were pullbacks inside the uptrend, not a new downtrend.
That asymmetry is the most useful single finding in the test. In a trend, ROC confirms what the trend filter already shows. Against a trend, a ROC reading on its own says little about whether the trend has changed.
ROC Across Futures, Stocks and Other Markets
The ROC indicator's percentage form makes it portable across markets, but the scale is not. NQ's ROC(12) SD was 4.1377 against 2.5490 for ES over the same year, so any fixed level means something different on each. Many individual stocks swing harder than a broad index, which is why ChartSchool's stock examples use 10% levels. On ES, the 12-session ROC topped out at 10.7815% across the whole year.
Continuous futures data adds one more wrinkle. A continuous chart that switches contracts at expiry without adjusting for the price gap between them can show a jump that never happened in any single contract. In Yahoo's ES series, the switch from the September 2026 to the December 2026 contract between September 18 and 21, 2026 appears as a gap. Any ROC lookback spanning a roll includes that gap. If your platform offers a back-adjusted continuous chart, use it for ROC studies, or calculate on the single contract you actually trade.
Related lesson: Trend following
Combining ROC With Other Indicators
The ROC indicator on its own measures one thing: speed. Pairing it with tools that measure something different (trend, range, volume) is how you turn a description into a rule. Pairing it with tools that measure the same thing just repeats the same signal twice.
Useful pairings:
- ROC plus a moving average trend filter. Take ROC signals only in the direction of a longer average, such as longs only when price is above its 50-session average. In this guide's ES test, positive ROC agreed with price above that average on 96.43% of sessions, so the filter costs you little in a trend and keeps you out of counter-trend shorts in a rising market.
- ROC plus RSI. RSI is bounded from 0 to 100 and smoothed, so it is calmer than ROC. A common use is to let RSI define the stretched zone and ROC show whether momentum is still building.
- ROC plus MACD. MACD measures the gap between two averages and lags more. A ROC turn ahead of a MACD turn is an early warning; a MACD crossover with ROC already well past zero is a late one.
- ROC plus volume. A strong ROC reading on rising volume suggests broad participation; the same reading on thin volume deserves less trust.
Testing Two ROC Filters on the Same Crossings
Filters sound like obvious improvements, so two were tested on the same 43 ES crossings, with the same 10-session hold and cost.
| ROC zero line filter on ES (this guide's calculation) | Trades kept | Net points | Win rate |
|---|---|---|---|
| None (raw crossing) | 43 | 438.31 | 46.51% |
| ROC also moved in the signal's direction on the bar before the crossing | 19 | 425.73 | 52.63% |
| Crossing-bar reading beyond 1% either side | 4 | -450.32 | 0 winners |
Requiring ROC to have been moving the right way one bar before the crossing cut the trade count from 43 to 19 while keeping almost the whole result, 425.73 net points against 438.31. That is fewer decisions, lower costs and a higher win rate for nearly the same total. The 1% band went the other way: it kept 4 trades and all 4 lost, for minus 450.32 points, because a crossing that jumps straight past 1% usually comes on a violent bar that then snaps back.
The caution matters as much as the result. Both filters were graded on the same bars they were chosen on, which flatters them. Before trusting either, test it on a different year or a different market.
Related lesson: Moving average crossovers
ROC vs RSI, MACD and Other Momentum Indicators
The ROC indicator, RSI, MACD, the stochastic oscillator and CCI all describe momentum, but they start from different inputs and make different trade-offs between speed and noise.
| Indicator | What it compares | Bounded | Smoothed | Default setting often used | Best at |
|---|---|---|---|---|---|
| ROC | Close vs close n bars ago, in percent | No (floor at -100%) | No | 9 on TradingView, 12 in older texts | Raw speed, scale-aware comparison |
| Momentum | Close minus close n bars ago, in points | No | No | Same lookback as ROC | Speed in the chart's price units |
| RSI | Average gains vs average losses | Yes, 0 to 100 | Yes | 14, with 70 and 30 levels | Stretch within a fixed scale |
| MACD | 12 EMA minus 26 EMA, 9 EMA signal | No | Yes | 12, 26, 9 | Trend momentum and turns |
| Stochastic | Close vs the recent high-low range | Yes, 0 to 100 | Partly | 14 periods | Position inside the recent range |
| CCI | Typical price vs its average, scaled by mean deviation | No | Yes | 20, with plus and minus 100 | Deviation from an average |
The main difference is smoothing. RSI, MACD and CCI all average their inputs, which makes them smoother and slower. ROC has no average and no ceiling, which makes it the fastest of the group and the noisiest. Its lack of bounds is why it can compare speed across markets, and also why it has no natural overbought or oversold level.
On RSI versus CCI, neither is better in general. RSI is bounded from 0 to 100, which makes its 70 and 30 levels easy to apply across markets. CCI, developed by Donald Lambert and introduced in Commodities magazine in 1980, uses a constant of .015 so that about 70 to 80 percent of readings fall between plus and minus 100, though ChartSchool notes the share depends on the lookback. CCI is more like ROC in that it is unbounded and can run far past its usual levels. Pick the one whose question matches yours, and do not run both expecting a second opinion.
Related lesson: Commodity channel index CCI
ROC Trading Applications for Day and Swing Traders
The ROC indicator applications that held up in this guide's ES test are the ones that use it to describe and confirm rather than to trigger trades on its own. Each of the setups that follow is a written rule with an invalidation point. They are illustrative frameworks, not recommendations, and each should be tested on your own market and timeframe before use.
Intraday ROC Momentum Confirmation
On an intraday chart, the ROC indicator works best as a check on a setup you already have.
- Define the setup from price first, such as a break of the opening range or a reclaim of the session VWAP.
- Check that a short ROC on your trading chart agrees in sign with the trade and is rising in that direction.
- Enter only if both agree. Place the stop beyond the level that defined the setup, not at an ROC level.
- Invalidation: price closes back inside the level. A ROC flip back through zero on its own is a warning to review, not an automatic exit.
On a 5-minute chart, a 12-bar ROC compares price with one hour earlier, so it confirms moves of about that length. If your trades last ten minutes, a shorter lookback or a faster chart fits better.
ROC Pullback in an Uptrend
This setup mirrors the way ChartSchool uses ROC on an uptrending stock: only take the dips in the direction of the bigger trend.
- Trend filter: price above its 50-session average.
- Pullback: ROC drops to a low reading for that instrument, such as its own 10th or 25th percentile.
- Trigger: ROC turns up and price closes above the prior bar's high.
- Stop beyond the pullback low. Invalidation: a close below the 50-session average.
In this guide's ES test on Yahoo Finance's daily closes, the lowest tenth of ROC(12) readings, minus 2.18% or less, was followed by a higher close 10 sessions later on 19 of 25 occasions during a rising year. That is the logic of this setup, and also its limit, because a falling year would not have treated those dips so kindly.
ROC Short Setups and ROC Scans
Short setups work the same way in reverse: trend filter down, a bounce lifts ROC to a high reading for that market, then ROC rolls over and price breaks the prior bar's low. ChartSchool also shows ROC used in scans, for example a negative long-term ROC combined with an overbought short-term ROC to find bounces inside downtrends.
On the question of a number-one intraday indicator, there isn't one. Most intraday traders use price structure first, then one tool for trend and one for momentum. ROC can be the momentum tool if you set its lookback to your holding period and measure what counts as a large reading on your market.
ROC Pros and Cons
The ROC indicator's strengths and weaknesses come from the same design choice: two closes and one division, with nothing smoothed.
| ROC pro or con | Why | Evidence from this guide's ES calculation |
|---|---|---|
| Pro: simple and transparent | Two closes, one division, easy to check by hand | Every row of the worked chain can be recomputed from its two closes |
| Pro: no warm-up | Needs only n + 1 bars | A 13-bar chart prints the same ROC(12) as a long one |
| Pro: comparable across markets | Percent form removes price level | Readings in SD terms lined up, 29.76% vs 30.16% beyond one SD |
| Pro: good trend confirmation | Positive ROC tracks rising trends | Positive ROC(12) matched price above its 50-session average 96.43% of the time |
| Con: noisy around zero | Nothing smoothed | 20 of 43 crossings came within two sessions of the previous one |
| Con: no fixed overbought or oversold level | Unbounded | 5% was cleared on 3.97% of ES sessions and 15.48% of NQ sessions |
| Con: base effects | The old close drops out of the window | ROC(12) was negative on the highest close of the worked chain |
| Con: weak standalone signals | Describes the past n bars only | Zero line rule netted 438.31 points vs 722.75 for holding |
The fair summary: ROC is a good measurement and a mediocre standalone signal. Use it where its speed helps, and lean on price or a trend filter where its noise hurts.
Common ROC Mistakes and Limitations
Most ROC indicator mistakes come from treating a description of the past as a forecast. These are the ones that show up most often:
| ROC mistake | Why it fails | What to do instead |
|---|---|---|
| Treating a big reading as a buy or sell signal | An extreme reading measures speed, not direction of the next move | Ask what price structure says, then use ROC to confirm |
| Using the zero line as a trend switch | Crossings cluster and reverse | Add a trend filter and a price trigger, and expect whipsaw |
| Copying a threshold from another market | A fixed percent sits at a different percentile on each market | Set levels from your instrument's own history or use SD terms |
| Choosing the lookback by habit | Every threshold changes with the lookback | Match the lookback to your holding period and keep it fixed |
| Ignoring the off-by-one | 12 and 13 bar lookbacks disagree | Check the platform's count before comparing charts |
| Ignoring roll gaps on continuous futures | Unadjusted roll jumps distort ROC | Use back-adjusted data or the contract you trade |
| Mixing percent and points | One percent is a different number of points at every price | Convert the reading to points and dollars before sizing |
| Judging a rule on a few big trades | Results can hinge on one or two outliers | Check the result without the best trades and against random entries |
The last row deserves a second look. In the ES zero line test, removing the two best trades turned 438.31 net points into minus 300.03. If a rule only works because of two trades, the next year's result depends on whether those two trades happen again, and no indicator can promise that.
Related lesson: Mean reversion trading
Managing Risk on ROC Trades
The ROC indicator can tell you a market is moving fast. It cannot tell you how much to risk. Risk management on a ROC trade starts by converting the reading and the stop into points and dollars before the order goes in.
Converting ROC Percent Into Points and Dollars
Because ROC is a percentage and futures pay per point, the dollar value of any ROC threshold grows as price rises. At ES's November 3, 2026 close of 7,596.75, used here as an illustration:
| ROC move | ES index points | One ES at $50 a point | One MES at $5 a point |
|---|---|---|---|
| 1% | 75.97 | $3,798.50 | $379.85 |
| 2% | 151.94 | $7,597.00 | $759.70 |
| 5% | 379.84 | $18,992.00 | $1,899.20 |
A 2% ROC move on one ES contract was worth $7,597.00 at that price. The same 2% at a lower index level would be worth less. Thresholds set in percent quietly get more expensive as markets rise, which is one more reason to size from the stop, not from the reading.
Sizing a ROC Trade From the Stop
Stops based on volatility scale with the market. ES's 14-session average true range (ATR), measured as a simple average of true range, was 96.59 points on November 3, 2026.
| Stop distance | Points | Risk on one ES | Risk on one MES |
|---|---|---|---|
| 1 ATR | 96.59 | $4,829.50 | $482.95 |
| 1.5 ATR | 144.88 | $7,244.00 | $724.40 |
| 2 ATR | 193.18 | $9,659.00 | $965.90 |
Those are daily-chart distances, and they are large. A daily ATR stop on one ES contract risked $4,829.50 before costs. For many accounts, only the micro contract or a shorter timeframe with a tighter structural stop makes the arithmetic work. As an illustrative example, a $50,000 account risking 1% has a $500 budget; a 20-point MES stop costs $100 per contract, so 5 MES fits.
Then check the break-even rate. At a 2 to 1 reward-to-risk target, the break-even win rate before costs is 1 / (1 + 2), or 33.33%. If your own record of ROC trades wins less often than that at your chosen target, no signal improvement will rescue the rule.
On the "3 5 7 rule": DayTrading.com describes it as a rule of thumb to risk no more than 3% of the account on one trade, keep total risk across open positions under 5%, and make winners at least 7% larger than losers. It notes some traders prefer 1% per trade. Many futures traders use smaller per-trade figures because leverage makes losses arrive fast.
ROC Signals When Positions Must Close Each Day
A daily ROC rule like the 10-session hold in the ES test assumes you can carry positions overnight. On our accounts, every position must be closed by 4:45 PM ET on regular trading days, with no overnight or swing holds, so a multi-day ROC trade cannot be held there; ROC would be used on intraday charts within one session. WealthCharts, one of our supported platforms, includes Chart Replay for practising on historical data. Our funded accounts are simulated.
Related lesson: Position sizing
ROC Indicator FAQ
What does ROC mean in investing?
ROC stands for rate of change. It measures the percentage change in price between the current close and a close a set number of periods earlier. Investors and traders use it to judge how fast a price is moving and whether that speed is building or fading.
What is the 3 5 7 rule in trading?
It is a risk rule of thumb. Risk no more than 3% of the account on one trade, keep total risk across open positions under 5%, and aim for winners at least 7% larger than losers. Many futures traders use smaller per-trade figures.
Which is better, RSI or CCI?
Neither is better for every market. RSI is bounded from 0 to 100 and smoothed, so its 70 and 30 levels transfer easily between markets. CCI is unbounded and measures how far price sits from its average, which suits traders looking for unusual deviation.
Which is the no. 1 indicator for intraday?
There is no single best intraday indicator. Most intraday traders start with price structure and add one trend tool and one momentum tool. ROC can serve as the momentum tool if its lookback matches your holding period.
Is the ROC indicator leading or lagging?
The ROC indicator is a lagging measure, though it reacts faster than smoothed tools such as MACD because it uses no averages. It describes what has already happened over its lookback, so it does not predict the next move. Its slope can turn before price does, which is what traders mean when they call it early.
What is a good ROC setting?
A good ROC setting is one that matches your holding period, because there is no universal best. TradingView defaults to 9 and older stock literature often uses 12. Measure what counts as a large reading on your own market before setting any threshold.
ROC Indicator Trading Risk
Trading futures involves substantial risk, and leverage means losses can exceed what you expect from a single signal. This article is general education about how the rate of change indicator works, not investment advice or a recommendation to trade any product. The E-mini S&P 500 and Nasdaq-100 figures are historical, illustrative calculations on one year of data with a modelled cost, and past indicator behaviour does not predict future results. Evaluation and funded accounts are simulated, and simulated results do not represent live trading.


