



TL;DR: Rectangles and trading ranges are one pattern, a flat box that stays neutral until price closes outside it. Draw the boundaries as zones, wait for the close, and measure the target from the box height. Then price the stop before you trade, because the honest stop beyond the far boundary is wide. In Bulkowski's sample, upward breaks met the measured target 78% of the time against 54% for downward ones.
A rectangle is the market telling you it has not decided yet. Price runs into a ceiling, falls back to a floor, and repeats until one side gives up. The hard part is not spotting the box. It is waiting for it to resolve, then pricing a stop that often looks uncomfortably wide.
This guide covers how the rectangle and trading range pattern forms, how to draw it, what the published statistics say by breakout direction, and how a breakout, target and stop work out in ticks and dollars on two illustrative micro futures examples.
What the Rectangle and Trading Range Pattern Is
A rectangle is a stretch of sideways price action between two roughly horizontal lines. The upper line is resistance, where rallies stall. The lower line is support, where declines stall. StockCharts' ChartSchool describes it as two comparable highs and two comparable lows connected by two parallel lines, and notes the same shape also goes by trading range, consolidation zone or congestion area.
The names change nothing about the mechanics. A rectangle and a trading range are the same structure: price crossing a box from side to side instead of trending.
What the rectangle represents is balance. Buyers keep absorbing selling near the floor, sellers keep absorbing buying near the ceiling, and neither side can move price beyond the box. That is information about where orders rest. It is not a forecast of which side wins.
StockCharts treats the pattern as incomplete until a breakout happens and calls its bias neutral. That is the most useful sentence about rectangles. Until price closes outside a boundary, there is no signal, only a range.
Three habits make the rectangle easier to use from day one:
- Treat each boundary as a zone a few ticks wide, not one exact price.
- Write the breakout rule down before the box resolves, because the urge to guess peaks in the middle of the range.
- Check what sits above and below the box on a slower chart, since a rectangle under heavier resistance inherits that ceiling.
Related lesson: Support and resistance
The Market Psychology Inside a Rectangle
The psychology of a rectangle is a standoff between two groups that both think they are right. StockCharts frames it as bulls stepping in near support and bears taking over near resistance, until one group exhausts itself and a breakout shows which side won.
Each test of a boundary teaches traders something. Buyers who bought the floor once and got paid buy it again. Sellers who shorted the ceiling and got paid short it again. Every successful bounce makes the next one more popular, which is why the lines tend to firm up over time instead of weakening right away.
That popularity has a cost. When many traders buy the floor with a stop just under it, those stop orders pile up in one small area. The same thing happens above the ceiling with short sellers' stops and with breakout buyers' entry orders. A rectangle is therefore a map of resting orders on both sides of the box.
Why stops cluster just beyond rectangle boundaries
Resting orders beyond a rectangle boundary are liquidity. Large participants who need to buy size can find willing sellers where short sellers' stops sit above the ceiling, and large sellers can find buyers where long holders' stops sit below the floor. A quick push through a boundary that triggers those orders and then fails is often described as a liquidity sweep or stop run.
You do not need a theory about who is behind a sweep to use the idea. What matters is the practical rule: a wick through a rectangle boundary that closes back inside is not a breakout. The close decides, and a range trader who places a stop one tick beyond an obvious line should expect it to be tested.
Boredom does its own damage. The longer the box runs, the more traders chop themselves up trading the middle, then chase the first move outside because they are tired of waiting. That chase is what many false breakouts feed on.
Drawing Rectangle Support and Resistance Lines
The two support and resistance lines define the rectangle, so drawing them well decides everything after. Bulkowski's identification guidelines for rectangle tops ask for two near horizontal trendlines, at least three touches on one line and two on the other, and distinct peaks and valleys rather than wicks that happen to line up. His rectangle bottoms page states the same five-touch minimum.
StockCharts sets a lighter floor of four points, two reaction highs and two reaction lows, and says they need to be reasonably close rather than exactly equal. It adds that alternating highs and lows are preferable. Both sources agree on the core idea: separate swings, not one messy bar counted twice.
Practical drawing rules for the support and resistance boundaries:
- Use swing highs and swing lows, not every intrabar spike. A touch is a turn.
- Draw the line through the cluster of turns, then shade a zone that covers them.
- Ignore one outlier wick if every other swing respects the zone, but note it.
- If the swings drift steadily upward or downward, you have a channel or a flag, not a rectangle.
TradingView's automatic rectangle indicator shows how a machine handles the same problem. It looks for 5/5 pivots, meaning a high or low with no higher high (or lower low) five bars on each side, and it lets the user set a permissible deviation as a percentage of the box height. Whatever tolerance you pick, write it down and keep it constant, because a moving tolerance turns any two lines into a rectangle.
A rectangle quality checklist
Before treating a range as a tradable rectangle, run it through this checklist. Every row comes from the published identification guidelines or from basic cost arithmetic.
| Rectangle check | Passes when | Fails when |
|---|---|---|
| Prior trend | A clear move leads into the box | Price was already sideways before the box began |
| Boundary touches | Three turns on one line and two on the other | One turn plus wicks that only line up |
| Flat boundaries | Turns on each line sit inside a narrow zone | Turns drift steadily higher or lower |
| Height against cost | The box is many ticks tall relative to your slippage and fees | The box is so small that costs eat the move |
| Volume | Volume fades in the box, then expands on the break | Volume is erratic with no expansion on the break |
| Higher timeframe | The slower chart leaves room in the breakout direction | The box presses into a bigger level that caps the move |
A range that fails two or more rows is two lines on a chart, not a setup. That is not a loss. It is a skipped trade you would otherwise have had to manage.
Continuation or Reversal Rectangles
Whether a rectangle continues or reverses the trend is decided by which side breaks, not by the shape. A rectangle that breaks in the direction of the move that came before it is a continuation. One that breaks the other way is a reversal.
Bulkowski names the two cases by how price enters. A rectangle top forms when price rises into the box, and in his sample its breakout was upward 63% of the time, so continuation was the more common outcome. A rectangle bottom forms when price falls into the box, and its breakout was upward 59% of the time. That means the reversal was the more common outcome for rectangle bottoms in that sample.
That second figure is worth sitting with. Many guides call the rectangle a continuation pattern and stop there. Bulkowski's direction split says a box after a decline broke upward slightly more often than it broke down, so assuming continuation would have been wrong more often than right there.
How the preceding trend changes the read
StockCharts adds a condition about the trend that leads into the box. For a continuation read, the prior trend should ideally be a few months old and not too mature, because the more mature the trend, the less chance the rectangle is just a pause. A box at the end of a long, extended run is more likely to be a turning point.
Bulkowski's data adds a location clue. His rectangle tops page says rectangles perform best when the breakout is within a third of the yearly low, and his bottoms page says breakouts near the yearly low do best. Neither tells you the direction in advance. Both tell you the context in which a break has had more room.
The practical rule is simple. Hold both outcomes as possible until the close outside a boundary, and plan the trade for each direction before it happens.
Related lesson: Trendlines and channels
Bullish Rectangle Pattern
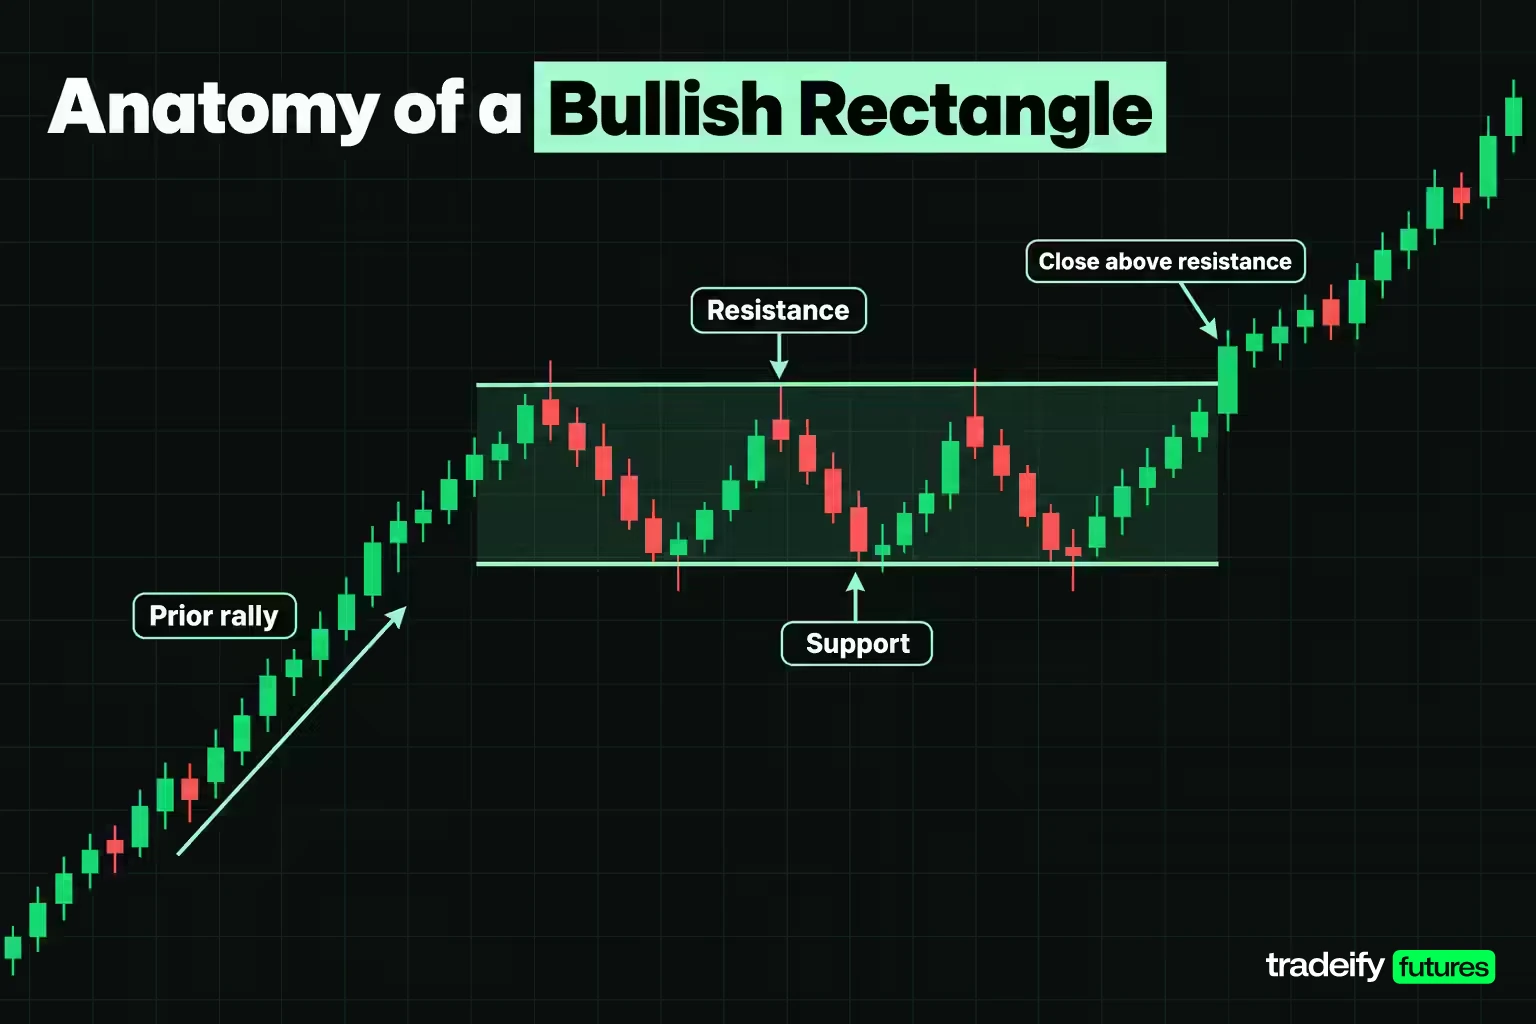
A bullish rectangle is a box that forms during an uptrend and breaks upward, continuing the advance. The sequence is a rally, a pause between flat support and resistance, then a close above the upper line.
Here is how that looks on an illustrative Micro E-mini S&P 500 (MES) chart, where one index point is worth $5 and the minimum tick of 0.25 points is worth $1.25. The prices are round illustrative levels, not a record of a real session.
- Price rallies into a ceiling and turns at 7,039.50, 7,040.00 and 7,040.25. That is three separate turns, so the upper line sits at 7,040.00.
- Price falls to a floor and turns at 7,014.50 and 7,015.00. That is two separate turns, so the lower line sits at 7,015.00.
- The box height is 25.00 points, which is 100 ticks, $125 per MES and $1,250 per full-size E-mini (ES).
- A bar closes at 7,042.00, above the upper zone. That close is the breakout signal.
The drawing is the easy part. The hard part is the wait: while price is inside the box, the temptation is to buy early because the trend was up. The bullish rectangle does not exist yet at that point. It exists only once a bar closes above 7,040.00.
What would invalidate the bullish read is a quick reversal back into the box and a close below the lower line at 7,015.00. That would make it a busted rectangle, and the long idea would be finished.
Bearish Rectangle Pattern
A bearish rectangle is a box that forms during a downtrend and breaks downward, continuing the decline. It is the mirror image of the bullish version, but the published numbers are not a mirror image, which changes how the trade should be planned.
Bulkowski's rectangle bottoms (price enters from above) met their measured target on downward breakouts 55% of the time, against 79% for upward breakouts. For rectangle tops, the downward figure was 54% against 78% upward. Bearish breakouts from rectangles reached their targets far less often in that sample.
Here is an illustrative Micro E-mini Nasdaq-100 (MNQ) bearish rectangle, where one index point is $2 and one 0.25 tick is $0.50:
- Price declines into a box between 25,400.00 and 25,320.00, with the highest turn at 25,402.00.
- The height is 80.00 points, 320 ticks, or $160 per MNQ.
- A bar closes at 25,316.00, below the lower line, which is the bearish breakout.
- The percentage-adjusted target is 80.00 times 0.55, which is 44.00 points, giving 25,276.00. The full-height target is 25,240.00.
Now price the honest stop. One tick above the highest turn is 25,402.25, which is 86.25 points of risk, or $172.50 per MNQ. The reward to 25,276.00 is 40.00 points, or $80. That is 0.46 to 1, with a breakeven win rate of 68.32%.
Moving the stop to the box midpoint at 25,360.00 cuts the risk to 44.00 points ($88) and still only gets to 0.91 to 1. On this box, a bearish rectangle breakout simply does not pay well against a stop that respects the pattern. The honest responses are a smaller size, a better entry on a retest of the broken floor, or a skip.
How Reliable Is the Rectangle Pattern
The most cited reliability data on rectangles comes from Thomas Bulkowski's long-run studies of daily stock charts in bull markets, split by how price entered the box and which way it left. The figures below are from his rectangle tops and rectangle bottoms pages.
| Rectangle statistic | Rectangle tops | Rectangle bottoms |
|---|---|---|
| Performance rank, up and down breakouts | 4 out of 39 and 32 out of 36 | 8 out of 39 and 14 out of 36 |
| Break even failure rate, up and down | 15% and 34% | 15% and 24% |
| Average rise and decline | 51% and 13% | 48% and 16% |
| Throwback and pullback rate | 66% and 64% | 64% and 66% |
| Meeting price target, up and down | 78% and 54% | 79% and 55% |
| Volume trend inside the box | Downward 70% of the time | Downward at least 71% of the time |
| Upward breakouts | 63% of the time | 59% of the time |
| Sample | More than 1,000 perfect trades | More than 900 perfect trades |
Read the first row slowly. The same shape ranked near the top on upward breakouts and near the bottom on downward breakouts from rectangle tops. Nothing about the box tells you which of those you are holding until the close outside it.
What the rectangle statistics mean and their limits
Rectangle statistics from Bulkowski rest on definitions that matter. His glossary defines the break even failure rate as the share of patterns that failed to move at least 5% after the breakout. A throwback (or pullback on a downward break) is a return to the breakout price within 30 days. Both are measured on daily stock charts.
That creates three limits worth stating plainly:
- The sample is daily stocks, not intraday futures. A 5% move on a stock over weeks has no direct equivalent on a 5-minute MES chart.
- "Perfect trades" means idealized entries without commissions or slippage, so real fills will do worse.
- The statistics describe the shape's history, not a forecast for your next box.
Used properly, the table gives you two things. It shows the asymmetry between upward and downward breaks, and it gives a historical percentage for the measure rule target. Treat both as starting assumptions you test in your own journal, not as edges you can bank.
Rectangle Volume Confirmation
Volume is a useful but weak confirmation tool for rectangles. Bulkowski found volume trending downward inside the box 70% of the time for rectangle tops and at least 71% of the time for rectangle bottoms. A fading volume trend inside the range is typical, not a requirement.
StockCharts is even more cautious. Its rectangle page says the pattern has no standard volume signature: volume sometimes declines, sometimes stays choppy, and rarely rises as the pattern matures. If volume has declined, it suggests looking for an expansion on the breakout. If volume is choppy, it suggests checking which swings (advances to resistance or declines to support) attract more volume, as a clue to the eventual break.
One finding cuts against the usual script. Bulkowski's rectangle bottoms page says rectangles with a rising volume trend outperformed regardless of breakout direction. So rising volume inside the box is not automatically a warning.
How to use volume without overrating it:
- Treat a breakout close on clearly expanded volume as stronger evidence than the same close on thin volume.
- Treat a breakout on unusually low volume as a reason for a smaller size or a wait for the retest, not as an automatic skip.
- On index futures, compare volume with the same time of day, because the open and the close always run heavier than midday.
Whatever volume says, the close still decides. A boundary break that closes back inside the box is a failed break, whatever the volume did.
Related lesson: What is volume
How to Trade a Rectangle Breakout
A rectangle breakout trade starts with a closing price outside the box. StockCharts says a valid breakout should be on a closing basis and notes that some traders add a filter, such as a price filter of 3%, a time filter of three days, or a volume expansion. Bulkowski gives the same core instruction: since the breakout can go either way, wait for price to close outside the trendline before taking a position.
On an intraday futures chart, a 3% filter on an index is far too large to be useful. The practical translation is a filter you can measure on your own timeframe, such as a close a set number of ticks beyond the zone, or two consecutive closes outside it. Pick one rule and apply it every time.
Breakout entry methods for rectangles
There are three common entry styles, each trading one risk for another:
- Close entry. Enter at or just after the first close outside the zone. You catch every real break, but also every false one.
- Retest entry. Wait for price to return to the broken boundary and hold it. StockCharts notes that broken resistance can turn into support. Bulkowski's throwback rate for upward breaks from rectangle tops was 66%, so a return was common in his sample, but he also notes throwbacks hurt post-breakout performance. You give up the breaks that never come back.
- Filtered entry. Enter only after your chosen filter confirms. You give up some distance to the target in exchange for fewer false starts.
Breakout clues inside the rectangle
Two behaviors inside the box carried real information in Bulkowski's data. A partial rise, where price heads toward the upper line and turns lower without touching it, predicted a downward breakout 75% of the time on both tops and bottoms. A partial decline, where price heads toward the lower line and turns higher without touching it, predicted an upward breakout 79% of the time on tops and 77% of the time on bottoms.
That is a clue, not an entry. Roughly one in four of those reads was wrong in Bulkowski's data, and a wrong one usually leaves you positioned against a real break.
A rectangle breakout plan in order:
- Confirm the range passes the quality checklist.
- Mark both boundaries as zones and write the breakout filter.
- Wait for the close outside a zone.
- Set the stop where the pattern is proven wrong and accept the reward to risk it produces.
- Set the target from the measured height.
- Size the position from the stop distance, not from the target.
Related lesson: Breakout trading
Measuring a Rectangle Price Target
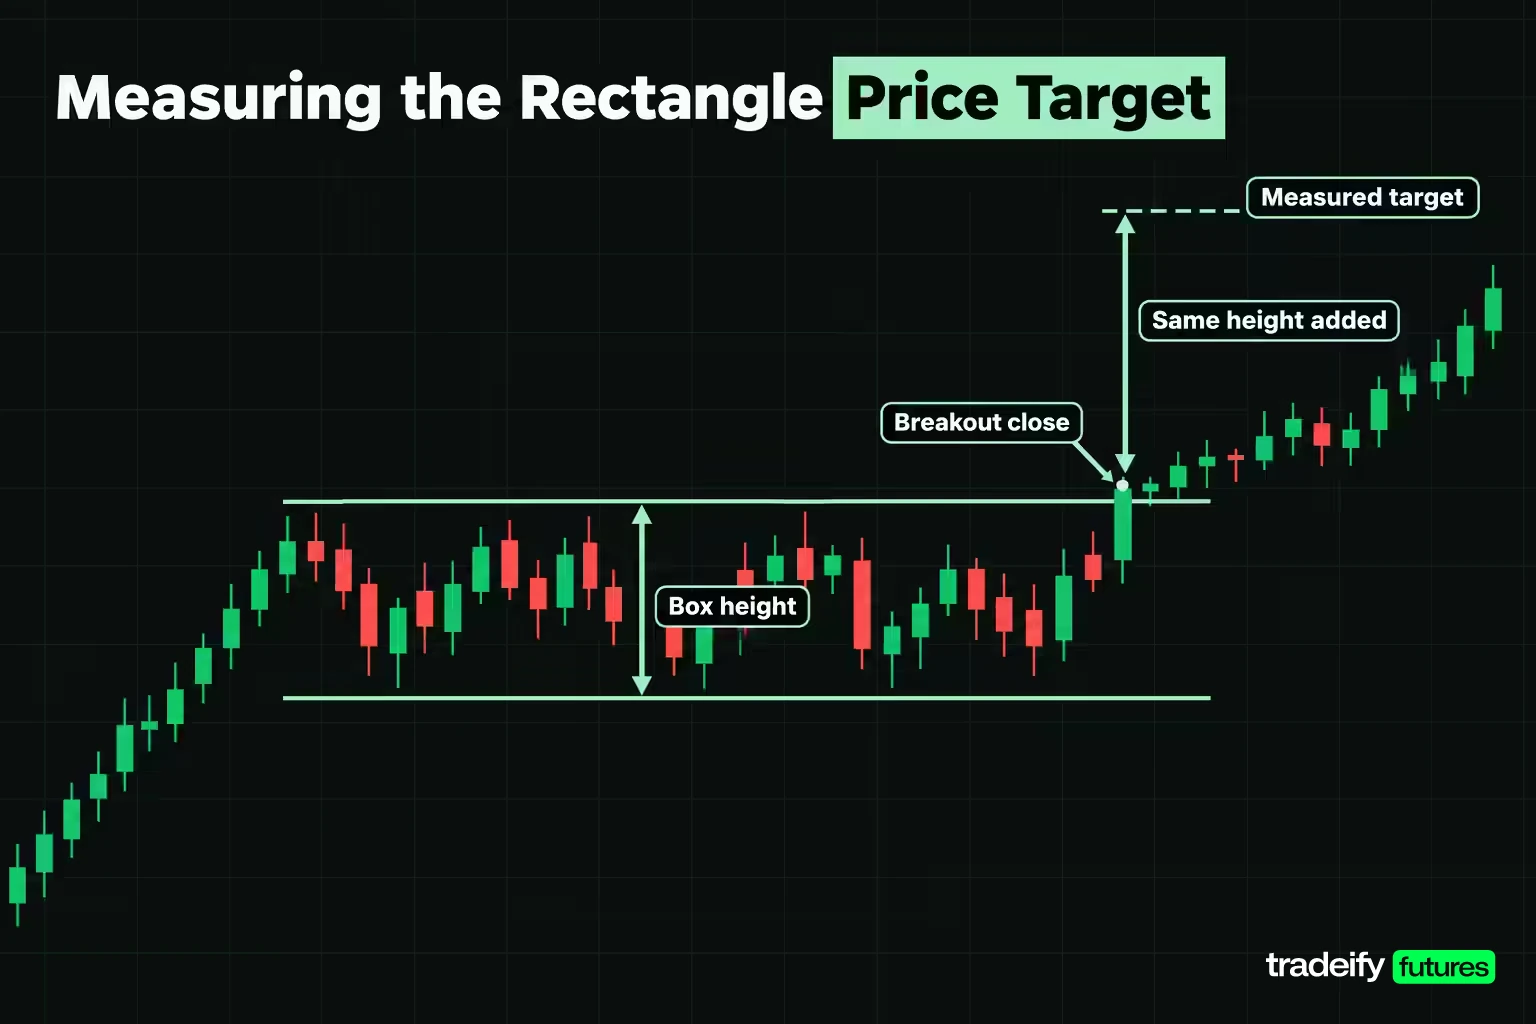
The rectangle price target comes from the box height. StockCharts applies the full height to the breakout point. Bulkowski's measure rule is more conservative: compute the height, multiply it by the percentage of patterns that met their target in his sample, then add it to the top line for upward breaks or subtract it from the bottom line for downward ones.
Using the illustrative bullish MES box with an upper line at 7,040.00 and a lower line at 7,015.00:
- Height is 25.00 points.
- The full-height target is 7,040.00 plus 25.00, which is 7,065.00.
- The percentage-adjusted target uses 78%, Bulkowski's rate for upward breakouts from rectangle tops meeting their target. 25.00 times 0.78 is 19.50 points, so the target is 7,059.50.
- From the breakout entry at 7,042.00, that is 17.50 points to the adjusted target ($87.50 per MES) and 23.00 points to the full-height target.
For a bearish box, the same rule subtracts from the lower line. On the illustrative MNQ box, Bulkowski's 55% rate for downward breaks from rectangle bottoms applied to the 80.00-point height gives 44.00 points and a target of 25,276.00.
The conservative target is the better planning number for two reasons. It reflects how often the full move happened in the study, and it sits before the obvious full-height level where many other traders will be taking profit.
StockCharts adds one more thought. Longer rectangles tend to produce more significant breakouts, and a long pattern may exceed its measured target. That is a reason to consider a partial exit at the target with a trailing stop on the rest, not a reason to raise the target before the trade.
Rectangle Stop Loss and Position Sizing
Rectangle stop placement is where most of the edge is won or lost, because a pattern-based stop on a rectangle is wide. Take an illustrative bullish MES rectangle between 7,015.00 and 7,040.00, with a breakout entry at 7,042.00 and a percentage-adjusted target of 7,059.50. Here are three stops traders commonly use.
| Rectangle stop placement | Stop price | Risk in points and ticks | Risk per MES | Risk per ES | Reward to risk | Breakeven win rate |
|---|---|---|---|---|---|---|
| One tick below the lowest turn | 7,014.25 | 27.75 points, 111 ticks | $138.75 | $1,387.50 | 0.63 | 61.33% |
| Box midpoint | 7,027.50 | 14.50 points, 58 ticks | $72.50 | $725 | 1.21 | 45.31% |
| Just under the broken upper line | 7,036.00 | 6.00 points, 24 ticks | $30 | $300 | 2.92 | 25.53% |
The tight stop looks like the professional choice. It is the one most likely to be hit for reasons unrelated to the pattern failing, because a retest of the broken line is common and 6.00 points sits inside the ordinary noise of a 25-point box. The midpoint stop sits inside the range, at a price the market visits while the pattern is still intact.
The structural stop is worst on the ratio and best on meaning. If price closes back under 7,015.00 and trades through 7,014.25, the pattern was wrong. That makes it the only stop of the three whose failures you can study in a journal as pattern failures.
Against the full-height target of 7,065.00, the same three stops pay 0.83, 1.59 and 3.83 to 1. The ratio improves, but the full move happens less often, so the breakeven math is not as kind as it looks.
How slippage changes rectangle stop math
Slippage changes the stop math on the illustrative MES rectangle (box 7,015.00 to 7,040.00, entry 7,042.00, target 7,059.50). Move the entry and the stop fill one tick worse each and the structural stop at 7,014.25 becomes 28.25 points ($141.25 per MES, 0.61 to 1, 62.09% breakeven). The midpoint stop at 7,027.50 becomes 15.00 points ($75, 1.15 to 1, 46.51%) and the tight stop at 7,036.00 becomes 6.50 points ($32.50, 2.65 to 1, 27.37%).
Cost hits tight stops hardest as a share of risk. Two ticks of slippage on MES is $2.50. That is 1.80% of the structural risk, 3.45% of the midpoint risk and 8.33% of the tight-stop risk, before any commission.
Sizing a rectangle trade from the stop
Size comes from the stop, never from the target. With an illustrative $250 risk budget per trade:
- Structural stop: 1 MES contract, risking $138.75. Zero ES contracts fit.
- Midpoint stop: 3 MES contracts, risking $217.50.
- Tight stop: 8 MES contracts, risking $240.
The dollar risk is similar in all three, but the chance of being stopped before the target is not. A wide structural stop is not a smaller opportunity. It is a larger risk per contract, and the honest answer is fewer contracts, a micro instead of a mini, or a skip.
Related lesson: Position sizing
False Breakouts and Busted Rectangles
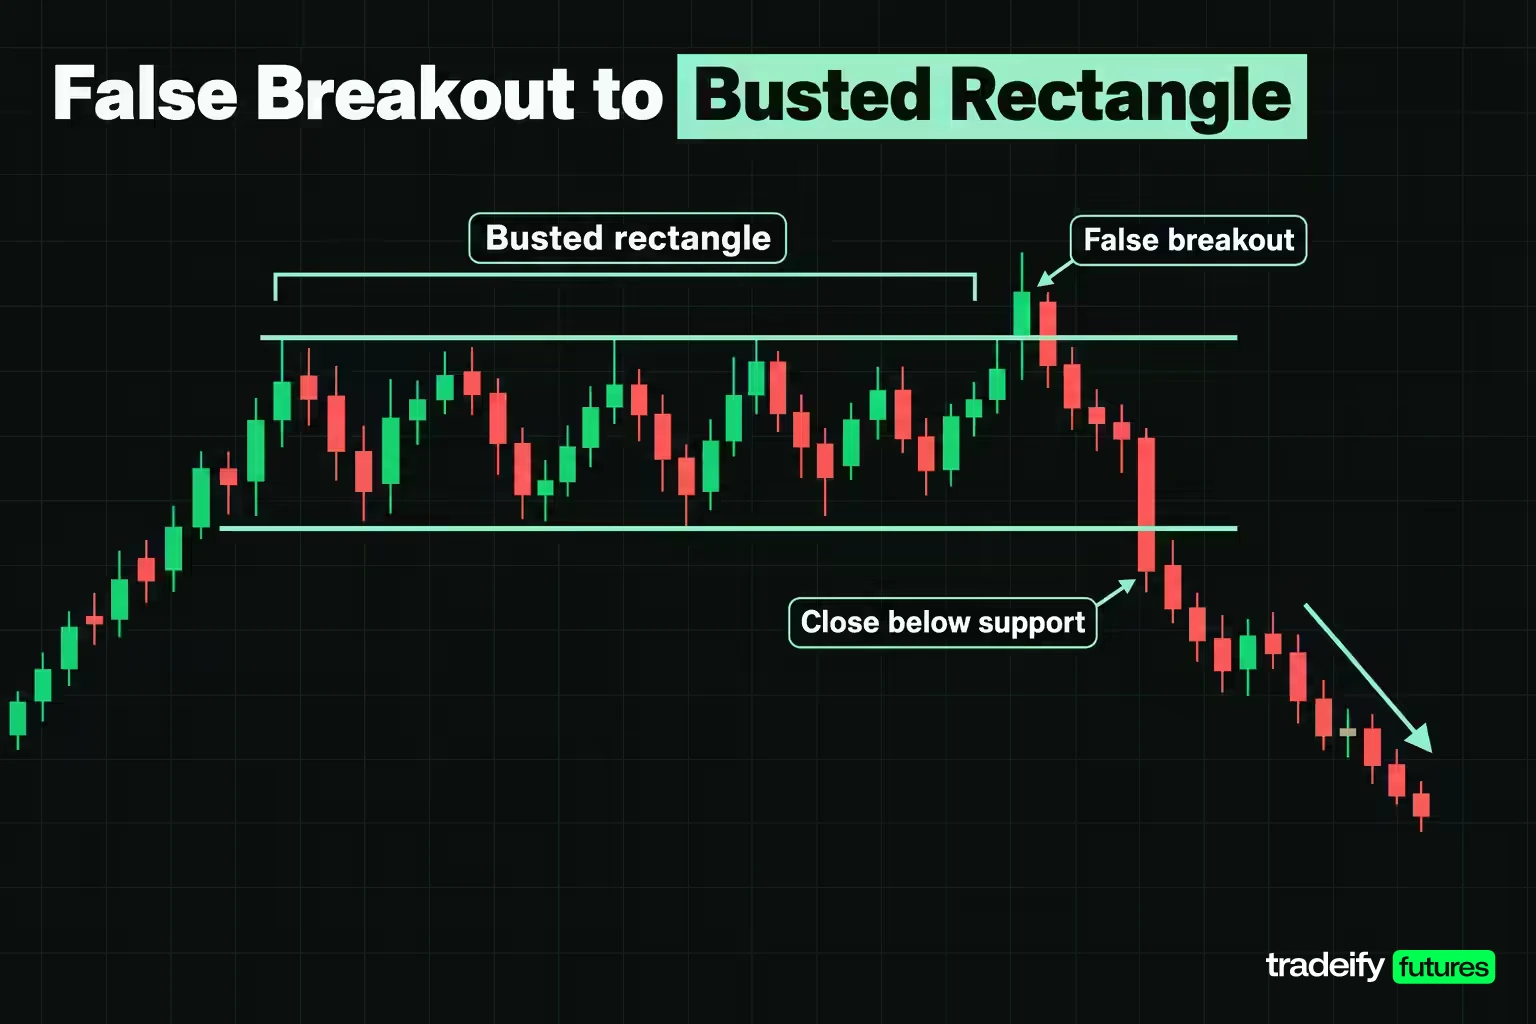
A false breakout from a rectangle is a close outside the box that fails to follow through. Bulkowski studies the extreme version as a busted rectangle: price breaks out, moves no more than 10%, reverses and closes beyond the opposite boundary.
Busts are common. In Bulkowski's rectangle tops sample, 51% of patterns busted. Of those, 66% busted once, 3% twice, and 31% three or more times.
A bust is not only bad news. Single-busted rectangle tops with downward breakouts, which then reversed and broke upward, rose 71% on average in Bulkowski's data, against 51% for rectangle tops that never busted. A failed break in one direction can set up the trade in the other.
Rules that reduce false breakouts
- Require a close outside the zone, not a wick. A spike through the line that closes back inside is a sweep of resting orders, not a breakout.
- Be careful with breakouts on a single very tall bar or gap. Bulkowski's trading lessons show tall-bar and gap breakouts that retraced and busted, because traders sell into that kind of enthusiasm.
- Be cautious when a breakout is slow to develop. His examples include delayed breakouts that went on to fail.
- Decide in advance what a failure looks like on your instrument. A 10% move on an index future is far beyond any intraday box, so measure failure against the box height, such as a close back inside and through the midpoint.
Turning a busted rectangle into a plan
A busted rectangle needs its own plan. If price breaks above the rectangle, fails, and closes below the lower line, the original long idea is finished. Exit by the rule you wrote, then treat the opposite boundary close as a new breakout with its own stop beyond the far side of the box. The bust stats suggest that second break deserves attention. They do not mean it will work, and two losses in a row on the same box are part of the deal.
Trading Inside the Range Before the Breakout
Range trading inside a rectangle means buying near support and selling near resistance while the box holds. Bulkowski lists this intrapattern trade for rectangles tall enough to allow it, and StockCharts notes that nimble traders play these bounces.
On the illustrative MES box (7,015.00 to 7,040.00), a range long might look like this:
- Buy at 7,016.00 near the lower zone.
- Stop at 7,012.00, a few points beyond the zone.
- Target at 7,038.00, short of the upper line instead of at it.
- Risk is 4.00 points ($20 per MES) and reward is 22.00 points ($110 per MES), which is 5.50 to 1 with a breakeven win rate of 15.38%.
The arithmetic looks great on paper and hides two problems. The entry exists only if price reaches the floor while you are watching, so the setup is a queue, not a menu. And the target has to sit short of the upper line, because aiming at the line means competing with the sellers who defined it.
The range trade ends when the box ends. A close outside either boundary cancels the range plan and hands control to the breakout plan, which is why both should be written before the session.
Skip the range trade when the box is short in ticks relative to your costs, or when the higher timeframe is trending hard. A rectangle in a strong trend tends to resolve in that direction, and fading its boundaries means fighting the bigger move.
Related lesson: Range trading
Rectangles Compared With Flags, Triangles and Channels
Rectangles get confused with several neighboring patterns, and the label changes the plan. StockCharts draws the line between a rectangle and a flag partly by duration, generally calling a pattern under three weeks a flag on daily charts, and describes a flag as a small rectangle that slopes against the trend.
| Pattern | Boundaries | What separates it from a rectangle |
|---|---|---|
| Rectangle | Two flat, parallel lines | Repeated tests of the same two prices |
| Flag | Two parallel lines sloping against the trend | Short and tilted, follows a sharp move |
| Pennant | Two converging lines | Small symmetrical triangle after a sharp move |
| Symmetrical triangle | Falling highs and rising lows | Range narrows instead of holding its height |
| Ascending triangle | Flat top, rising lows | Only the ceiling is flat |
| Price channel | Two parallel sloped lines | Trends while it ranges |
| Double top or bottom | Two peaks or two troughs | Fewer touches, judged as a reversal setup |
The practical difference is the target and the stop. A rectangle keeps its height, so its measured target stays the same over the life of the box. A triangle's height shrinks as it matures, so a target measured early overstates what is left.
StockCharts also points out that rectangles and symmetrical triangles share a neutral bias. Both are usually continuations, both can mark tops and bottoms, and neither is resolved until the breakout.
Related lesson: Flags and pennants
Rectangle Trading on Intraday Futures Charts
Rectangles form on intraday futures charts as well as daily ones, and the mechanics are the same: two boundaries, a close outside, a measured target and a stop beyond the far side. What changes is scale and cost.
A 25-point MES box on a 5-minute chart is 100 ticks tall, which is plenty of room. A 4-point box is 16 ticks, and two ticks of slippage plus commission becomes a large share of any trade inside it. The shorter the timeframe, the larger the share of every trade that cost takes.
Session structure matters too. Index futures can build rectangles during quieter midday hours and break them when volume returns near the close. A range drawn across the overnight session and the regular session mixes two very different volume regimes, so draw the box on the session you trade.
Test the setup before you size it up. Mark your last 20 rectangles, record which way each broke, whether it hit the adjusted target, and which of the three stops would have survived. That journal tells you more about your rectangles than any published table.
On our accounts, every position must be closed by 4:45 PM ET on regular trading days, and there are no overnight or swing holds. A rectangle on a daily chart can frame the session, but any trade from it has to finish the same day. Our 50K accounts allow up to 4 minis or 40 micros, so the structural-stop sizing math works the same way inside those limits. WealthCharts includes Chart Replay for practicing breakouts on historical data before trading them.
Related lesson: Tick size and tick value
Rectangle and Trading Range FAQ
What does the rectangle pattern represent in trading?
The rectangle pattern represents a balance between buyers and sellers at two prices. Buyers absorb selling at the lower boundary and sellers absorb buying at the upper one, so the same levels get tested repeatedly. It shows where orders rest, not which side will win.
What are trading ranges?
A trading range is price moving sideways between a floor and a ceiling. Analysts also call it a rectangle, consolidation zone or congestion area. The range ends when price closes beyond one boundary and follows through.
Is a rectangle pattern bullish or bearish?
A rectangle is neutral until it breaks. It turns bullish on a close above the upper line and bearish on a close below the lower line. In Bulkowski's sample, upward breaks from rectangle tops performed far better than downward breaks.
Is a rectangle a continuation or a reversal pattern?
A rectangle can be either. In Bulkowski's data, rectangle tops broke upward and continued the trend 63% of the time, while rectangle bottoms broke upward and reversed the trend 59% of the time. Treat the pattern as unresolved until the close outside a boundary.
How do you confirm a rectangle breakout?
Wait for a closing price beyond the boundary rather than a wick through it. Some traders add a filter, such as a set distance beyond the line, extra bars outside it or a volume expansion. Whatever filter you choose, apply it the same way every time.
Where should the stop go on a rectangle trade?
The stop belongs beyond the level that proves the pattern wrong, usually one tick past the far boundary. That stop is wide, so the answer is fewer contracts rather than a tighter stop. Stops inside the box tend to be hit by ordinary range movement.
What is a busted rectangle?
A busted rectangle is a pattern whose breakout failed. Price breaks out, travels no more than 10%, then reverses and closes beyond the opposite boundary. Bulkowski found that 51% of rectangle tops busted in his sample.
Rectangle Trading Risk
This article is general education about rectangle and trading range patterns, not investment advice or a recommendation to trade any product. Futures are leveraged, losses can exceed what you expect, and a stop order does not guarantee your exit price in a fast market. Evaluation and funded accounts are simulated, simulated results do not represent live trading, and the prices and sizes in the examples are illustrative.


