



TL;DR: A rounded bottom is a slow, U-shaped turn from a falling market to a rising one, and the real decision is where you put the stop. The pattern confirms on a close above the left lip, the high where the decline started. A stop under the valley is safe on paper but can push reward to risk below 1 to 1. Screen for symmetry and a flat trough first, then price the stop before you size the trade.
A rounded bottom, also called a saucer bottom, is one of the slowest chart patterns you will ever trade. It can take months to form, it rarely gives you a clean moment to act, and by the time it confirms, a large part of the move may already be behind you.
That slowness is the reason to study it properly. A trader who spots a curve forming tends to buy too early, set the stop too far away, or chase the breakout after waiting too long. This guide covers what the pattern is, how to tell a real one from a bounce, and how entry, stop, target and position size change the trade, using an illustrative Micro E-mini S&P 500 example.
What a Rounded Bottom Is
A rounded bottom is a chart pattern where a decline slows down, flattens into a broad trough, and then turns into an advance of similar length. On the chart it looks like a bowl or the letter U. StockCharts' ChartSchool describes it as a long-term reversal pattern best suited to weekly charts, also referred to as a saucer bottom, and as a long consolidation that turns from a bearish bias to a bullish one.
So "rounded bottom", "rounding bottom" and "saucer" all describe the same shape. Some writers keep "saucer" for shallower bowls, but the trading logic does not change with the name.
The rounded bottom is bullish. The trade it suggests is long, triggered when price closes above the high where the decline began.
Reversal or Continuation
Most descriptions call the rounded bottom a reversal pattern, and in a narrow sense it is: it turns the decline that came before it. Thomas Bulkowski's published statistics on ThePatternSite add an important detail. In his sample, price trends upward into the pattern 67% of the time, which means most rounded bottoms act as continuation patterns inside a larger uptrend.
Both statements hold at once. The bowl reverses a pullback, and that pullback often sits inside a bigger rally. If you only look for rounded bottoms at the end of long bear markets, you are hunting the minority case.
Bulkowski's bull-market results for the pattern, based on 990 perfect trades, rank it 7 out of 39 chart patterns for overall performance, with a 4% break-even failure rate and a 48% average rise. Those numbers come from his pattern database, and his examples are stocks rather than futures, so treat them as a reference point, not a forecast for your instrument.
How a Rounded Bottom Forms
A rounded bottom forms in four phases, and each one tells you something different about who is in control.
- The decline. Price falls from a reaction high, the left lip. StockCharts notes the decline can be jagged, with several reaction highs and lows, or fairly linear.
- The trough. The decline loses slope and price goes sideways near the low. StockCharts says the low can resemble a V but should not be too sharp, and should take a few weeks to form. This is the accumulation stretch, where sellers stop being in a hurry and buyers start taking the other side.
- The advance. Price starts making higher lows and climbs back toward the left lip. StockCharts says the advance should take about the same amount of time as the decline, and a sharp advance raises questions about the pattern.
- The breakout. Price closes above the left lip. That close confirms the rounded bottom.
The mechanism is simple. A falling market is one where sellers accept lower and lower prices. The rounded bottom records the stretch where that stops, the market goes quiet, and buyers start accepting higher prices. The curve is a record of urgency moving from one side to the other.
Volume Through a Rounded Bottom
Volume should follow the same shape as price. StockCharts describes the ideal: volume high at the start of the decline, low at the end of the decline, and rising during the advance, with an increase on the advance and preferably on the breakout. It also notes that volume during the decline matters less than volume on the way out.
If volume stays flat while price climbs the right side, you have a rising price with no evidence that new buyers arrived. That does not kill the rounded bottom, but it lowers how much weight you give it.
Related lesson: What is volume
How Long a Rounded Bottom Takes to Form
A rounded bottom takes weeks to months on a daily chart and longer on a weekly chart. Bulkowski says the pattern appears on daily or weekly charts but recommends concentrating on the weekly scale because the rounded nature is more apparent there, and describes the bowl as usually forming over many months.
For comparison, Bulkowski's guideline for the cup in a cup with handle, a close relative, is 7 to 65 weeks, with variations allowed. A rounded bottom of similar size is a long-horizon pattern, not a day-trading signal.
Here is how the timeframe changes what you are looking at:
| Chart timeframe | Typical rounded bottom length | What it is good for |
|---|---|---|
| Weekly | many months to more than a year | spotting the bowl clearly and setting the bias |
| Daily | several weeks to a few months | the practical compromise for swing analysis |
| Hourly | a few days to a couple of weeks | timing entries inside a daily bowl |
| 5-minute | a few hours | a compressed shape with much weaker evidence |
A saucer on a 5-minute chart has the same outline, but it lacks the long, quiet trough that gives the pattern its meaning. A few hours of sideways trading is not the same as weeks of supply drying up. If you use intraday rounded bottoms, treat them as minor structure and look for a higher-timeframe reason to trust them.
Related lesson: Multiple-timeframe analysis
How to Identify a Rounded Bottom
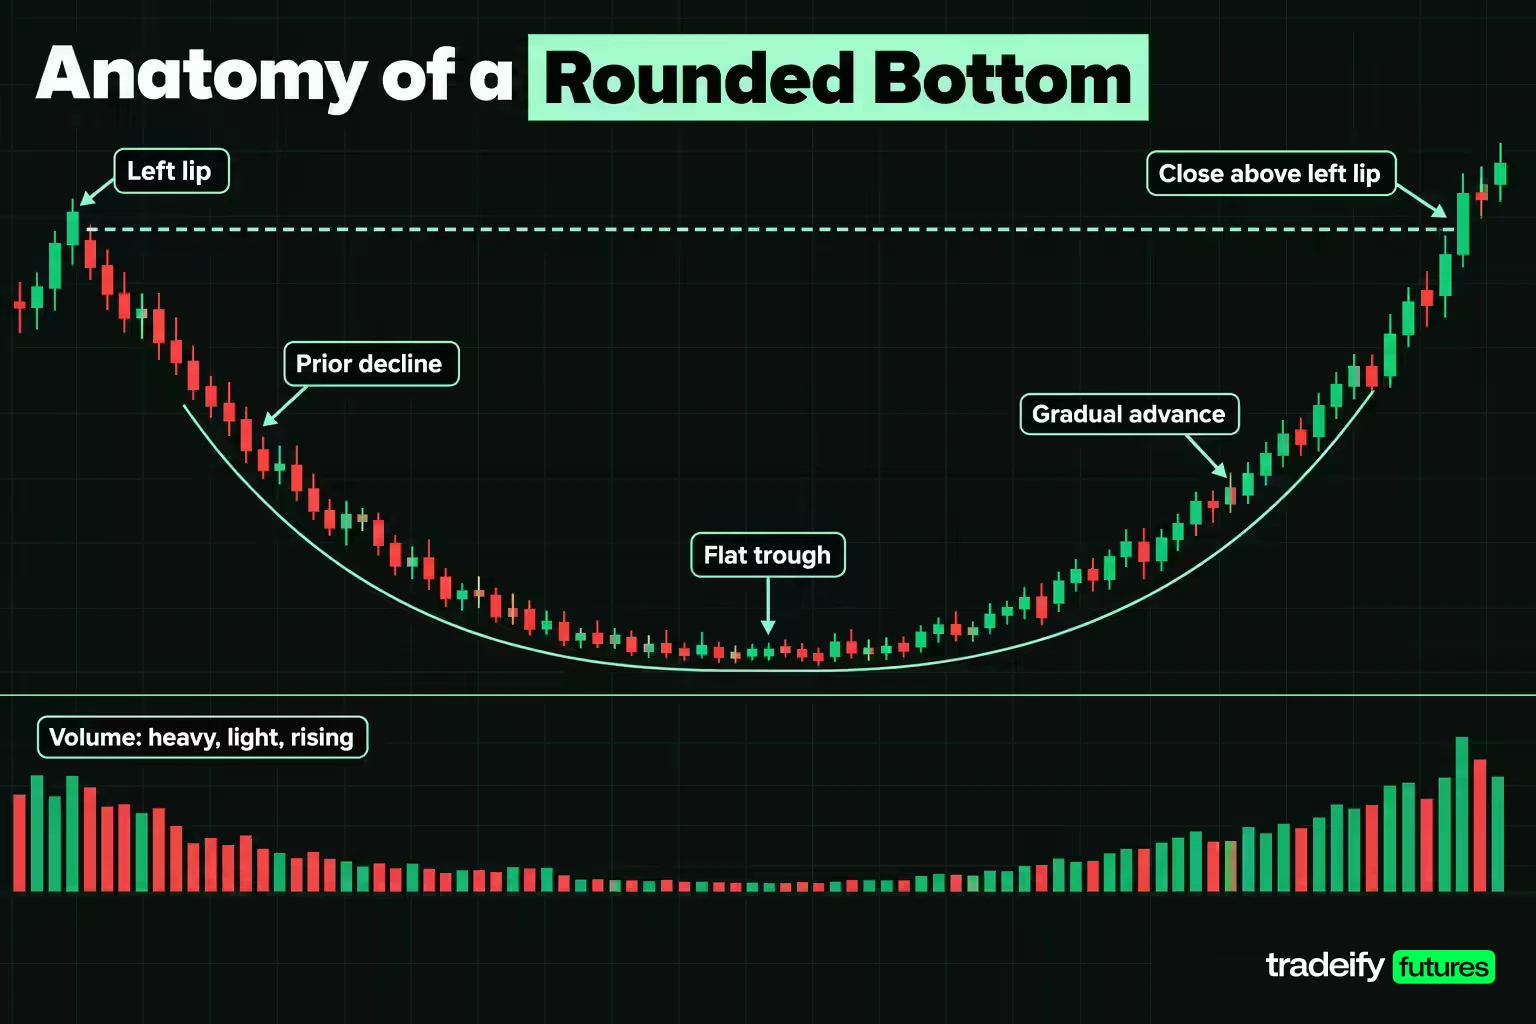
You identify a rounded bottom by checking the shape against a short list of conditions before you think about a trade. Most curves that look like saucers fail one of the first three checks.
| Check | Pass condition | Why it matters |
|---|---|---|
| Prior move | a real decline into the bowl | a turn needs something to turn from |
| Duration balance | the advance takes roughly as long as the decline | separates a bowl from a quick bounce |
| Slope balance | the advance climbs at roughly the pace of the decline | a spike up is a V, not a saucer |
| Visible scale | weeks or months on a daily chart | a small wobble is not a bowl |
| Flat trough | price spends a stretch of time near the low | the low is a period, not a single bar |
| Volume shape | heavy early, light in the trough, rising on the advance | evidence that selling dried up and buyers arrived |
| Confirmation | a close above the left lip | the level that defined the decline is cleared |
StockCharts is clear that symmetry is preferable but that the left and right sides do not have to be equal in time or slope. Published sources do not set a numeric symmetry threshold, so set your own and write it down. As a working filter, this guide treats a bowl as balanced when the right side's duration and slope are each within about 25% of the left side's. That number is a screening rule of thumb, not a published standard.
Why the Rounded Bottom Trough Must Be Flat
A V-shaped recovery and a rounded bottom can end at the same price, but they are different events. In a V, sellers are still pressing right up to the low, and buyers arrive just as fast. In a rounded bottom, the low is a period where nobody is in a hurry. That quiet stretch is where positions change hands, which is why duration matters more than depth.
Bulkowski adds that a flat base, predominantly flat over several months, leading into the rounding turn often leads to a powerful rally. A trough that is broad and dull is a feature, not a flaw.
The Mid-Turn Bump Trap
Bulkowski warns that price sometimes shoots up midway through the turn, near the bottom, and then retraces most, but not all, of the way back to where it started. He calls it a bump. To a trader watching the bowl, a bump looks exactly like the breakout arriving early.
It is not. The bump happens far below the left lip, so it confirms nothing. Buying the bump means buying a move that the pattern itself expects to give back. Bulkowski notes that swing traders can sell into the bump and buy back near where it started, and that price usually re-enters the turn a little higher than the bump's starting point.
Confirming a Rounded Bottom Breakout
A rounded bottom is confirmed when price closes above the left lip, the reaction high where the decline began. Bulkowski uses a close above the left peak because price on the right side might not pause at a minor high. A trade through the level that fails to close above it is not a confirmation.
Three pieces of evidence make a breakout more believable:
- A close, not a touch. Decide in advance which bar's close counts: the daily close for a daily bowl, the weekly close for a weekly bowl.
- Volume on the way out. StockCharts looks for rising volume on the advance and preferably on the breakout itself.
- No immediate rejection. Bulkowski notes price often pauses at the level of the left saucer lip. A pause is normal. A fast close back inside the bowl is a warning.
Throwbacks After a Rounded Bottom Breakout
Expect price to come back. Bulkowski defines a throwback as price breaking out upward, climbing, and returning to the breakout price within 30 days, and he reports a 64% throwback rate for rounded bottoms. He also says throwbacks hurt post-breakout performance.
CentralCharts' statistics on saucer patterns point the same way: in 40% of cases price pulls back to the neckline after the break. The practical takeaway is that a stop placed just under the left lip sits right where the most common post-breakout move lands.
Related lesson: Breakout trading
Indicators That Support a Rounded Bottom Read
Indicators cannot create a rounded bottom, but a few can tell you whether the shape is backed by changing momentum or participation. Use them as supporting evidence and never as the trigger.
| Indicator | What to look for in a rounded bottom | Where it misleads |
|---|---|---|
| On-balance volume (OBV) | OBV flattening in the trough and making a new high with or before the breakout | a single huge volume bar can distort the line |
| RSI | RSI holding above 30 on the right side while price retests the lows | RSI can sit in the middle for months in a slow bowl |
| MACD | MACD turning up and crossing its signal line as the right side builds | lags on a slow pattern and can cross several times in the trough |
| Fibonacci retracement | how far the right side has recovered toward the left lip | the levels are reference points, not support |
OBV is the most natural fit because the rounded bottom is a volume story. Joseph Granville's OBV adds a period's volume when the close is above the prior close and subtracts it when the close is below. StockCharts' Amgen rounding bottom example notes the breakout was also confirmed with a new high in OBV.
Reading RSI, MACD and Fibonacci on a Rounded Bottom
RSI, J. Welles Wilder's momentum oscillator, runs from 0 to 100 on a 14-period default, with readings above 70 generally treated as overbought and below 30 as oversold. In a rounded bottom, the useful signal is often that RSI stops reaching oversold readings while price is still near the lows: momentum is fading before price shows it.
MACD, the difference between the 12- and 26-period exponential moving averages with a 9-period signal line, can confirm that the right side has real momentum. On a bowl that takes months, expect several false crosses in the trough.
Fibonacci retracement levels (23.6%, 38.2%, 50%, 61.8% and 78.6%) drawn from the left lip down to the valley give you a ruler for the right side. A right side that stalls below the 50% level for weeks is not yet a rounded bottom.
Related lesson: On-balance volume (OBV)
A Worked Rounded Bottom on the Micro E-mini S&P 500
This worked example uses illustrative round prices on the Micro E-mini S&P 500 (MES), not a real chart. MES is worth $5 per index point, and its minimum tick of 0.25 index points is worth $1.25.
Imagine a daily MES chart where price declines from a reaction high at 7,560.00 to a valley at 7,420.00 over 34 sessions. Price flattens near the low, then advances over 32 sessions to a right lip at 7,548.00, where it pauses. A few sessions later, price closes at 7,562.00, above the left lip. The whole bowl takes 66 sessions, about 13.2 weeks.
| Level or measure | Value | How it is derived |
|---|---|---|
| Left lip | 7,560.00 | the reaction high where the decline began |
| Valley | 7,420.00 | the lowest price in the bowl |
| Right lip | 7,548.00 | the high where the right side pauses |
| Depth | 140.00 points | 7,560.00 minus 7,420.00 |
| Depth in ticks and dollars | 560 ticks, $700.00 | 140.00 divided by 0.25, times $1.25 |
| Bowl midpoint | 7,490.00 | the left lip minus half the depth |
| Duration | 66 sessions | 34 sessions down, 32 sessions up |
| Left-side slope | 4.12 points per session | 140.00 points over 34 sessions |
| Right-side slope | 4.00 points per session | 128.00 points over 32 sessions |
| Duration ratio | 94.1% | 32 sessions divided by 34 |
| Slope ratio | 97.1% | 4.00 divided by 4.12 |
| Confirmation close | 7,562.00 | the first close above the left lip |
Both ratios sit well inside the 25% working filter, so this rounded bottom passes the balance checks. In the middle of the trough, price jumps from 7,430.00 to 7,468.00 and falls back to 7,436.00. That is the mid-turn bump: it peaks 92.00 points below the left lip and confirms nothing.
Notice what the table does not tell you. A clean, symmetric bowl says the shape is valid. It says nothing yet about whether the trade is worth taking, because that depends on where you enter, where you stop and how far you realistically expect price to go.
Rounded Bottom Price Targets
A rounded bottom target comes from the depth of the bowl, but sources disagree on how far to project it. The three common conventions give very different answers on the worked MES example, where the depth is 140.00 points.
| Target method | Calculation | Target price | Published hit rate |
|---|---|---|---|
| Full depth from the left lip | 7,560.00 plus 140.00 | 7,700.00 | 36% in CentralCharts' saucer statistics |
| Bulkowski hit-rate adjusted | 7,548.00 plus 140.00 times 0.65 | 7,639.00 | built from his 65% target-hit rate |
| Half depth from the left lip | 7,560.00 plus 70.00 | 7,630.00 | 57% in CentralCharts' saucer statistics |
Bulkowski's method measures from the left lip to the lowest valley, multiplies that height by the percentage of patterns that met the full target (65% for rounded bottoms), and adds the result to the right saucer lip, or to the left rim if there is no right lip. Here that adds 91.00 points to 7,548.00. CentralCharts says a saucer has no theoretical price objective, that the full-height objective is reached in only 36% of cases, and recommends half the depth instead, reached in 57% of cases.
The honest summary: the full measured move is the least likely outcome, and the deeper you project, the fewer trades get there. A plan that only works if price reaches 7,700.00 is a plan that relies on a minority result.
Rounded Bottom Entry Points
There are three main places to enter a rounded bottom, and each trades confirmation against price.
| Entry | Price on the worked example | Stop | Risk per MES contract |
|---|---|---|---|
| Right-side early entry | 7,505.25, a tick above the first right-side swing high at 7,505.00 | 7,477.75, under the higher low at 7,478.00 | 27.50 points, 110 ticks, $137.50 |
| Confirmation close | 7,562.00 | 7,489.75, under the bowl midpoint | 72.25 points, 289 ticks, $361.25 |
| Throwback entry | 7,570.00, a close back up after a throwback | 7,547.75, under the right lip | 22.25 points, 89 ticks, $111.25 |
Right-side early entry. After the valley, price makes its first right-side swing high at 7,505.00 and then a higher low at 7,478.00. Buying a break of that swing high gets you in 54.75 points below the left lip, before confirmation. What makes it defensible is a clear invalidation: a rounded bottom's right side should make higher lows, so a new low under 7,478.00 breaks the shape. The cost is that many of these entries happen in bowls that never confirm.
Confirmation close. Buying the first close above the left lip is the textbook entry. You get the strongest evidence and the worst price. The hard part is the session where price trades through the lip early and you have to wait for the close anyway; buying the touch is how traders end up owning the bars that close back inside the bowl.
Throwback entry. Bulkowski reports a 64% throwback rate for rounded bottoms, so waiting for price to return to the lip and close back up is often available. The catch is that, by his figure, about 36% of breakouts never come back, and you miss those entirely.
The Cost of Chasing a Rounded Bottom Breakout
Missing the breakout bar does not make the next price a good entry. It makes it a different trade. In this table, the stop is one illustrative ATR of 40.00 points below each entry, and the target stays at the full-depth 7,700.00.
| Entry above the lip | Entry | Stop | Risk in points and dollars | Reward to 7,700.00 | Reward to risk | Break-even win rate | Depth already used |
|---|---|---|---|---|---|---|---|
| 0 ATR | 7,562.00 | 7,522.00 | 40.00 points, $200.00 | 138.00 points | 3.45 to 1 | 22.47% | 1.4% |
| 0.5 ATR | 7,582.00 | 7,542.00 | 40.00 points, $200.00 | 118.00 points | 2.95 to 1 | 25.32% | 15.7% |
| 1 ATR | 7,602.00 | 7,562.00 | 40.00 points, $200.00 | 98.00 points | 2.45 to 1 | 28.99% | 30.0% |
| 2 ATR | 7,642.00 | 7,602.00 | 40.00 points, $200.00 | 58.00 points | 1.45 to 1 | 40.82% | 58.6% |
| 3 ATR | 7,682.00 | 7,642.00 | 40.00 points, $200.00 | 18.00 points | 0.45 to 1 | 68.97% | 87.1% |
Break-even win rate is risk divided by risk plus reward. Every ATR you pay above the lip raises the win rate you need, and at 3 ATR you need to win 68.97% of the time against a target that CentralCharts' saucer statistics show being reached in only 36% of cases.
Related lesson: Average true range (ATR)
Where to Place the Stop on a Saucer Pattern
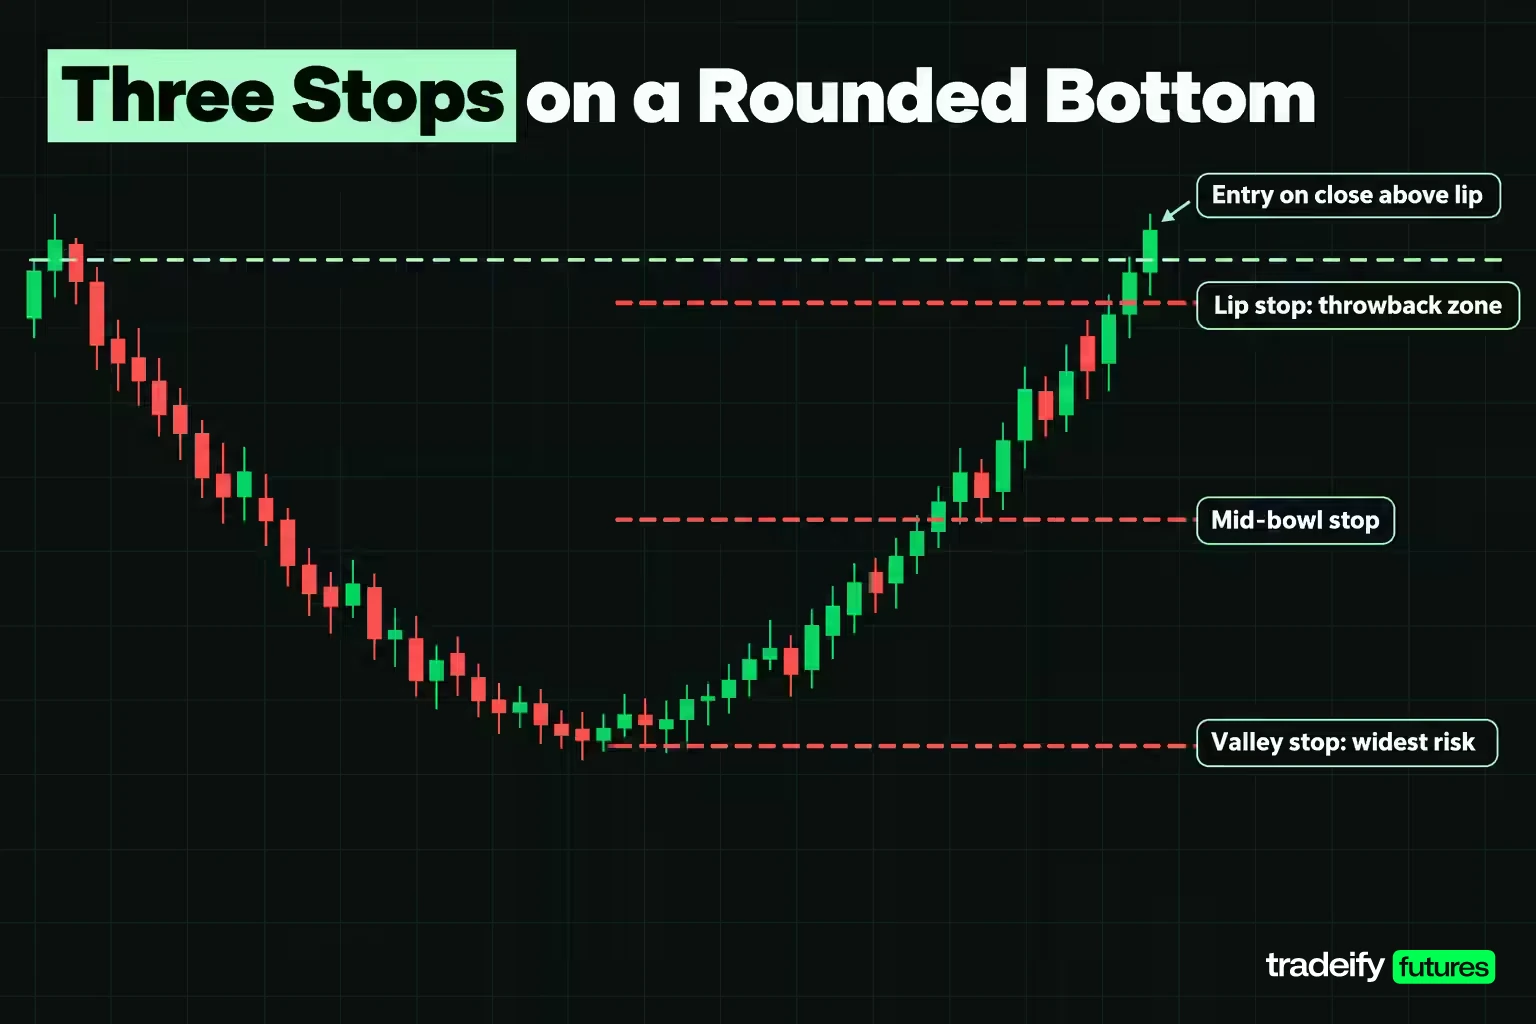
The stop decides whether a rounded bottom trade makes sense at all. Using the confirmation close at 7,562.00, here are the two common structural stops priced against all three targets.
| Stop | Risk per contract | Target | Reward | Reward to risk | Break-even win rate |
|---|---|---|---|---|---|
| Valley stop 7,419.75 | 142.25 points, 569 ticks, $711.25 | 7,700.00 | 138.00 points, $690.00 | 0.97 to 1 | 50.76% |
| Valley stop 7,419.75 | 142.25 points, 569 ticks, $711.25 | 7,639.00 | 77.00 points, $385.00 | 0.54 to 1 | 64.88% |
| Valley stop 7,419.75 | 142.25 points, 569 ticks, $711.25 | 7,630.00 | 68.00 points, $340.00 | 0.48 to 1 | 67.66% |
| Mid-bowl stop 7,489.75 | 72.25 points, 289 ticks, $361.25 | 7,700.00 | 138.00 points, $690.00 | 1.91 to 1 | 34.36% |
| Mid-bowl stop 7,489.75 | 72.25 points, 289 ticks, $361.25 | 7,639.00 | 77.00 points, $385.00 | 1.07 to 1 | 48.41% |
| Mid-bowl stop 7,489.75 | 72.25 points, 289 ticks, $361.25 | 7,630.00 | 68.00 points, $340.00 | 0.94 to 1 | 51.52% |
Valley, Mid-Bowl and Lip Stops Compared
The valley stop. On a rounded bottom, a stop a tick under the valley is the most defensible on structure, because a new low means the bowl has failed. It is also the most expensive. Against the full target it pays 0.97 to 1, and against the two more realistic targets it pays about half a point for every point risked.
The mid-bowl stop. A stop under the bowl's midpoint halves the risk and nearly doubles the ratio against the full target. The trade-off is honest: the stop now sits inside the pattern, so a deep throwback can take you out of a rounded bottom that later works.
The lip stop. A stop a tick under the right lip at 7,547.75 risks only 14.25 points, $71.25 per contract, and shows 9.68 to 1 against the full target on paper. With Bulkowski's 64% throwback rate, that stop sits where price most often returns. A ratio that looks this good usually means the stop is inside normal noise.
There is no rounded bottom stop that is both tight and safe. The right-side early entry and the throwback entry earn better ratios because they move the entry closer to a real invalidation level, not because they move the stop closer to price.
Related lesson: Stop-loss orders and placement
Sizing a Rounded Bottom Trade
Position size on a rounded bottom is an output of the stop, never an input. Pick the dollar amount you can afford to lose on one attempt, then divide it by the per-contract risk of the stop you chose and round down.
| Risk budget | Setup | Risk per MES contract | Raw size | Contracts | Risk taken | Budget unused |
|---|---|---|---|---|---|---|
| $500 | right-side entry, stop 7,477.75 | $137.50 | 3.64 | 3 | $412.50 | $87.50 |
| $500 | confirmation close, valley stop | $711.25 | 0.70 | 0 | $0.00 | $500.00 |
| $500 | confirmation close, mid-bowl stop | $361.25 | 1.38 | 1 | $361.25 | $138.75 |
| $500 | throwback entry, stop 7,547.75 | $111.25 | 4.49 | 4 | $445.00 | $55.00 |
| $1,000 | right-side entry, stop 7,477.75 | $137.50 | 7.27 | 7 | $962.50 | $37.50 |
| $1,000 | confirmation close, valley stop | $711.25 | 1.41 | 1 | $711.25 | $288.75 |
| $1,000 | confirmation close, mid-bowl stop | $361.25 | 2.77 | 2 | $722.50 | $277.50 |
| $1,000 | throwback entry, stop 7,547.75 | $111.25 | 8.99 | 8 | $890.00 | $110.00 |
Look at the $500 budget with the valley stop: the raw size is 0.70 contracts, which rounds down to zero. The rounded bottom can be perfectly valid and the correct position on that budget is still no position. That leaves three honest options: use a tighter structural stop, accept a different entry, or skip the trade.
Related lesson: Position sizing
Execution Cost and the Rounded Bottom Stop
Slippage matters more as the stop gets tighter. Assume an illustrative two ticks of slippage, one on entry and one on the stop exit, which is 0.50 points or $2.50 per MES contract.
| Setup | Risk before cost | Risk after cost | Break-even to 7,700.00 after cost | Cost as share of risk |
|---|---|---|---|---|
| Right-side entry | 27.50 points | 28.00 points, $140.00 | 12.57% | 1.82% |
| Throwback entry | 22.25 points | 22.75 points, $113.75 | 14.89% | 2.25% |
| Mid-bowl stop | 72.25 points | 72.75 points, $363.75 | 34.52% | 0.69% |
| Valley stop | 142.25 points | 142.75 points, $713.75 | 50.85% | 0.35% |
Cost is a bigger share of a tight stop, but that is no reason to avoid one. Paying 1.82% of risk on a trade that needs a 12.57% win rate is cheaper than paying 0.35% on a trade that needs 50.85%. Commissions come on top of slippage and vary by broker, so add your own.
A Step-by-Step Rounded Bottom Trading Plan
A rounded bottom trading plan works best when every decision is made before the breakout. The pattern is slow enough that you will have weeks to talk yourself into a better entry, a wider stop or a bigger target, so write the plan while you are still calm.
Before the Rounded Bottom Breakout
- Find the bowl on the higher timeframe. Weekly or daily, with a real decline into it.
- Run the identification checks. Duration and slope balance within your written filter, a flat trough, and a volume shape that fits.
- Mark the levels. Left lip, valley, midpoint, right lip and any mid-turn bump.
- Choose the target you will actually use. Half depth or the hit-rate-adjusted target unless you have your own data supporting the full move.
- Choose the entry and stop together. Right-side early entry, confirmation close or throwback, each with its own invalidation level.
Executing and Managing the Rounded Bottom Trade
- Size from the stop. Dollar risk divided by per-contract risk, rounded down, including slippage.
- Place the orders and write down what cancels the idea. For example, a close back below the right lip, or a new low under the right-side higher low.
- Manage the trade by rule. Some traders take partial profit at the half-depth target and trail the rest under new higher lows. Decide which before entry.
- Journal the result. Record the two balance ratios, the entry type and the outcome, so your own sample of rounded bottoms builds over time.
How to Tell a Market Has Bottomed
Telling whether a market has actually bottomed is the question every rounded bottom raises, and the honest answer is that you do not know at the low. You get evidence in stages: the decline loses slope, price makes a higher low, volume rises on the advance, and finally price closes above the left lip. Until that close, a "bottom" is a hypothesis with a defined invalidation level.
Holding Periods and Intraday Trading Rules
Rounded bottoms on daily and weekly charts play out over weeks, so your holding period has to match the rules of the account you trade. On our accounts, all positions must be closed by 4:45 PM ET on regular trading days, and no overnight, weekend or swing holds are allowed, so a multi-week rounded bottom target cannot be carried as one position. If you trade the pattern with us, the daily bowl works as directional context for intraday trades in its direction, sized within the account's contract limits (for example, 4 minis or 40 micros on a 50K account).
Rounded Bottom Pros and Cons
The rounded bottom's main strength is its statistics on weekly and daily charts; its main weakness is the time and stop width it demands before it pays.
| Pros | Cons |
|---|---|
| Bulkowski's statistics show a low 4% break-even failure rate and a 48% average rise | the pattern is slow and can take months to confirm |
| the confirmation level is objective: a close above the left lip | the confirmation entry often comes with a wide structural stop |
| the volume shape gives a second, independent check | it is easy to see a bowl in hindsight and hard to see one in real time |
| it works on weekly and daily charts where noise is lower | the full measured target is reached only a minority of the time |
| the right side gives a defined early entry with a clear invalidation | throwbacks are common and can stop out tight entries |
Common Rounded Bottom Mistakes
| Failure mode | What you see | What it costs | The check that catches it |
|---|---|---|---|
| Calling a bounce a bowl | a two-week right side after an eight-week decline | stop-outs near the left lip | duration balance |
| Buying the mid-turn bump | a spike midway through the trough | a move the pattern expects to give back | flat trough |
| Stopping under the valley by habit | a 142.25-point stop on the worked example | 0.97 to 1 against the full target | the stop matrix |
| Chasing the breakout | an entry several ATR above the lip | a 68.97% break-even win rate at 3 ATR | the chase table |
| Ignoring volume | flat volume on the advance | no evidence buyers arrived | volume shape |
| Reading the wrong timeframe | a neat curve on a 5-minute chart | noise through the trough | visible scale |
Rounded Bottom vs Similar Chart Patterns
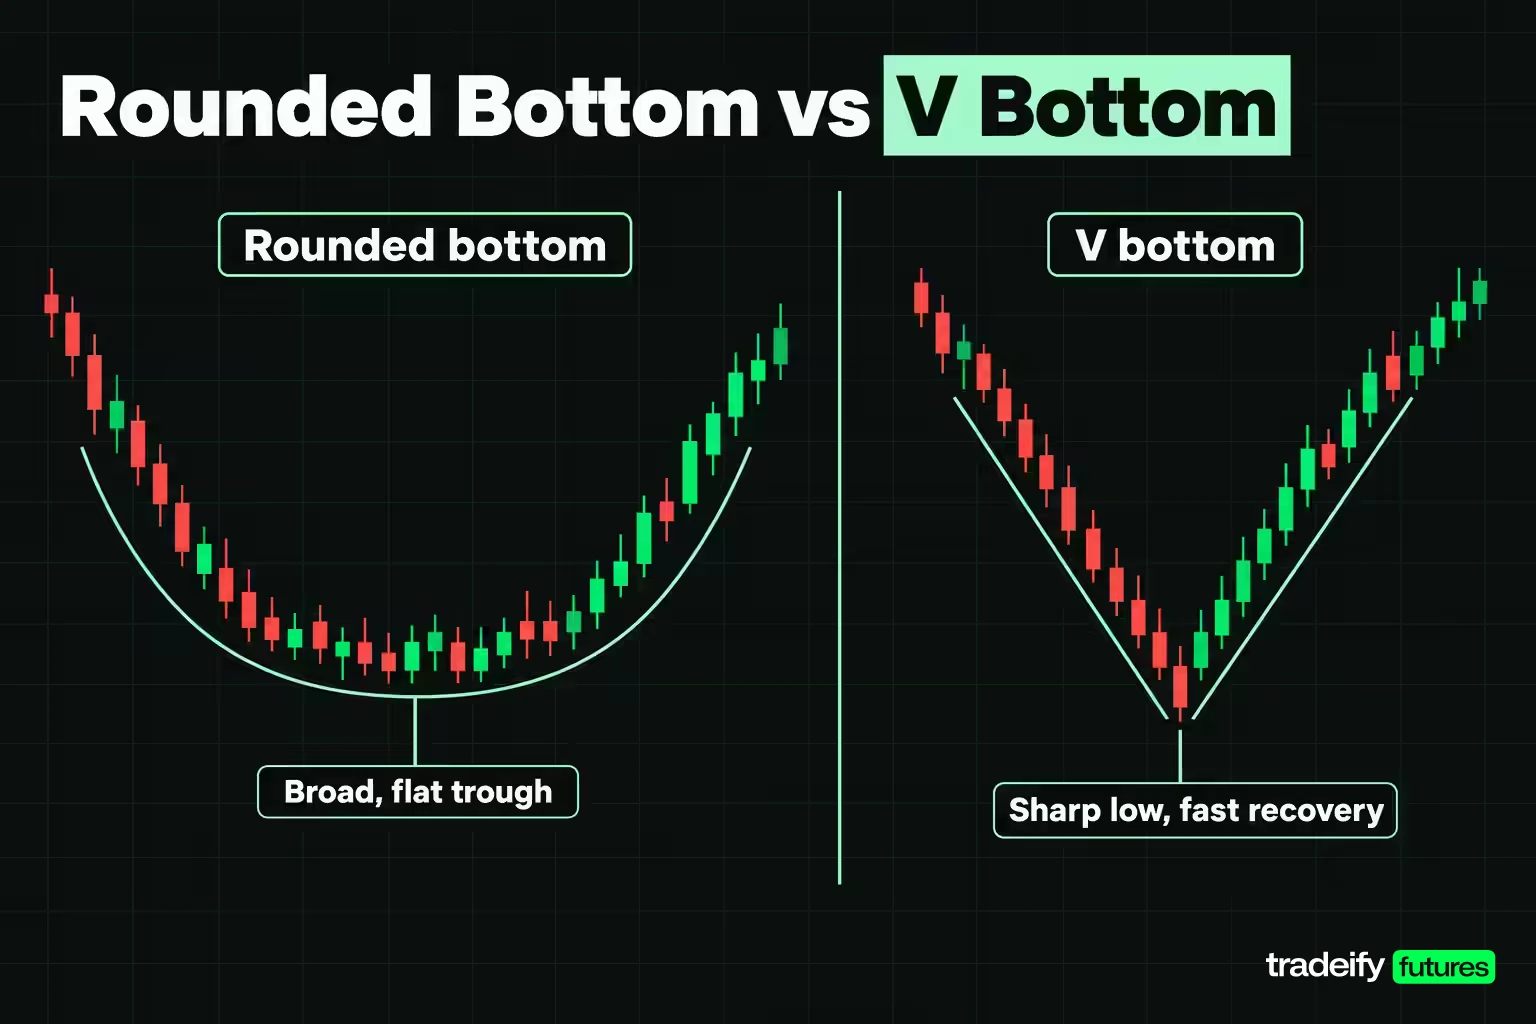
Most misidentified rounded bottoms are one of a few other shapes, and the wrong label gives you the wrong stop.
| Pattern | What it looks like | The difference from a rounded bottom |
|---|---|---|
| Double bottom | two distinct lows with a rally between them | a rounded bottom has no second test of the low; its trough is a stretch of time |
| Triple bottom | three distinct valleys near the same price | three tests of a level rather than one broad curve |
| Cup and handle | the same bowl plus a small pullback near the rim | the handle adds a second, tighter invalidation level |
| Rounding top | the same curve upside down after an advance | it signals the opposite direction |
| V bottom | a sharp low and a fast recovery | duration and slope balance both fail |
| Rectangle or range | a flat band with repeated touches of both edges | a range runs sideways; a bowl's sides slope into the trough |
The cup and handle is the closest relative. Bulkowski calls it a popular variation of the rounding bottom and reports a 61% target-hit rate for it, based on 913 perfect trades, with a cup that should be U-shaped rather than V-shaped. If a handle forms at the right lip, Bulkowski suggests drawing a trendline from the left lip to the right lip and buying a close above it, as long as that line does not slope upward.
The rounding top deserves a note because it causes confusion. It forms after an upward trend, and its breakout can go either way. Bulkowski confirms an upward breakout with a close above the highest high and a downward breakout with a close below the lower of the two rims. In his statistics, 58% of upward breakouts and 14% of downward breakouts met the price target.
Related lesson: Cup and handle pattern
Rounded Bottom FAQ
What is a rounding bottom?
A rounding bottom is the same pattern as a rounded bottom or saucer bottom: a slow, U-shaped turn from a decline to an advance. It is confirmed when price closes above the high where the decline began. It is most visible on weekly and daily charts.
Is a rounded bottom bullish or bearish?
A rounded bottom is bullish. It signals that selling pressure has faded and buyers have taken control, and the trade it suggests is long after a close above the left lip. It often appears as a pullback inside a larger uptrend rather than at the end of a bear market.
Is a rounding top bullish or bearish?
A rounding top is usually read as bearish, because it is a slow, inverted-U turn after an advance. Bulkowski's data shows its breakout can go either way, so wait for the close: below the lower rim is bearish, above the highest high is bullish.
Is a double bottom pattern bullish?
Yes. A double bottom is a bullish reversal pattern with two lows near the same price separated by a rally. It confirms when price closes above the high of that rally. Unlike a rounded bottom, it tests the low twice instead of forming one broad trough.
Is a triple bottom bullish or bearish?
A triple bottom is bullish. It shows three distinct valleys near the same price, and Bulkowski confirms it once price closes above the highest peak between the valleys. Before that close, it is only a support zone that has held three times.
How can you tell if a market has bottomed?
You tell a market has bottomed when price closes above a prior reaction high after making a higher low, not at the low itself. The evidence builds in stages: the decline slows, price makes a higher low, volume rises on up moves, and then that close arrives. Treat any bottom as unconfirmed until it does.
What is the difference between a rounded bottom and a cup and handle?
The handle. Both share the same rounded base, but a cup and handle adds a short pullback near the rim before the breakout. That handle gives a closer invalidation level and often a better stop than a plain rounded bottom.
Rounded Bottom Trading Risks and Disclaimer
This article is education, not investment advice, and nothing in it recommends buying or selling any instrument. The Micro E-mini S&P 500 example uses illustrative prices, not market data, and published pattern statistics describe past samples, not future results. Futures are leveraged, losses can exceed what you planned to risk, and stop orders can fill at worse prices in fast markets. Evaluation and funded accounts at prop firms run in a simulated setting, and simulated results do not guarantee live results. Size every position from your own risk plan.


