



TL;DR: The cup and handle pattern is a bullish continuation setup, and the decision is whether the shape actually qualifies. Look for a U-shaped cup that gives back a third or less of the prior advance and a handle in the upper half of the cup. The usual trigger is a close above the right rim, with a stop under the handle low and a target near 61% of the cup height. Price the entry before the breakout, because chasing it can wipe out the reward to risk.
You found a rounded bowl on the chart, price is pressing the old high, and a small pullback has formed on the right. The question is not whether it looks like a cup and handle pattern. The question is whether it qualifies, where you are wrong, and how much you can pay for the breakout before the trade stops being worth taking.
Those are three separate decisions, and traders tend to collapse them into one feeling: the chart looks good. This guide pulls them apart using the published rules, the published statistics and fully worked prices.
What a Cup and Handle Pattern Is
A cup and handle pattern is a bullish continuation pattern: a rounded consolidation (the cup) followed by a short, shallow pullback near the old high (the handle), which resolves with a breakout that resumes the prior advance. William O'Neil developed it and introduced it in his 1988 book How to Make Money in Stocks, according to StockCharts' ChartSchool.
The pattern makes a specific claim. Price was rising, paused, rounded back to where it started, and the small drift that follows is profit-taking rather than distribution. If that reading is right, the breakout above the right rim is the market telling you the pause is over.
So is a cup and handle bullish? In its normal form, yes. It is classed as bullish because it is expected to resolve in the direction of the uptrend that came before it. Bullish describes the geometry, though, not the outcome. The pattern can and does break down through the handle, which is why the handle low becomes the stop rather than a vague support zone.
The pattern also has a record behind it. Thomas Bulkowski, who tracks chart pattern statistics, ranks the cup with handle 3 out of 39 patterns for overall performance in bull markets. That ranking is about the pattern on average across stocks, not about the one you are looking at, which is why the rest of this guide is about qualifying the specific chart in front of you.
Related lesson: Support and resistance
How to Identify a Cup and Handle Pattern
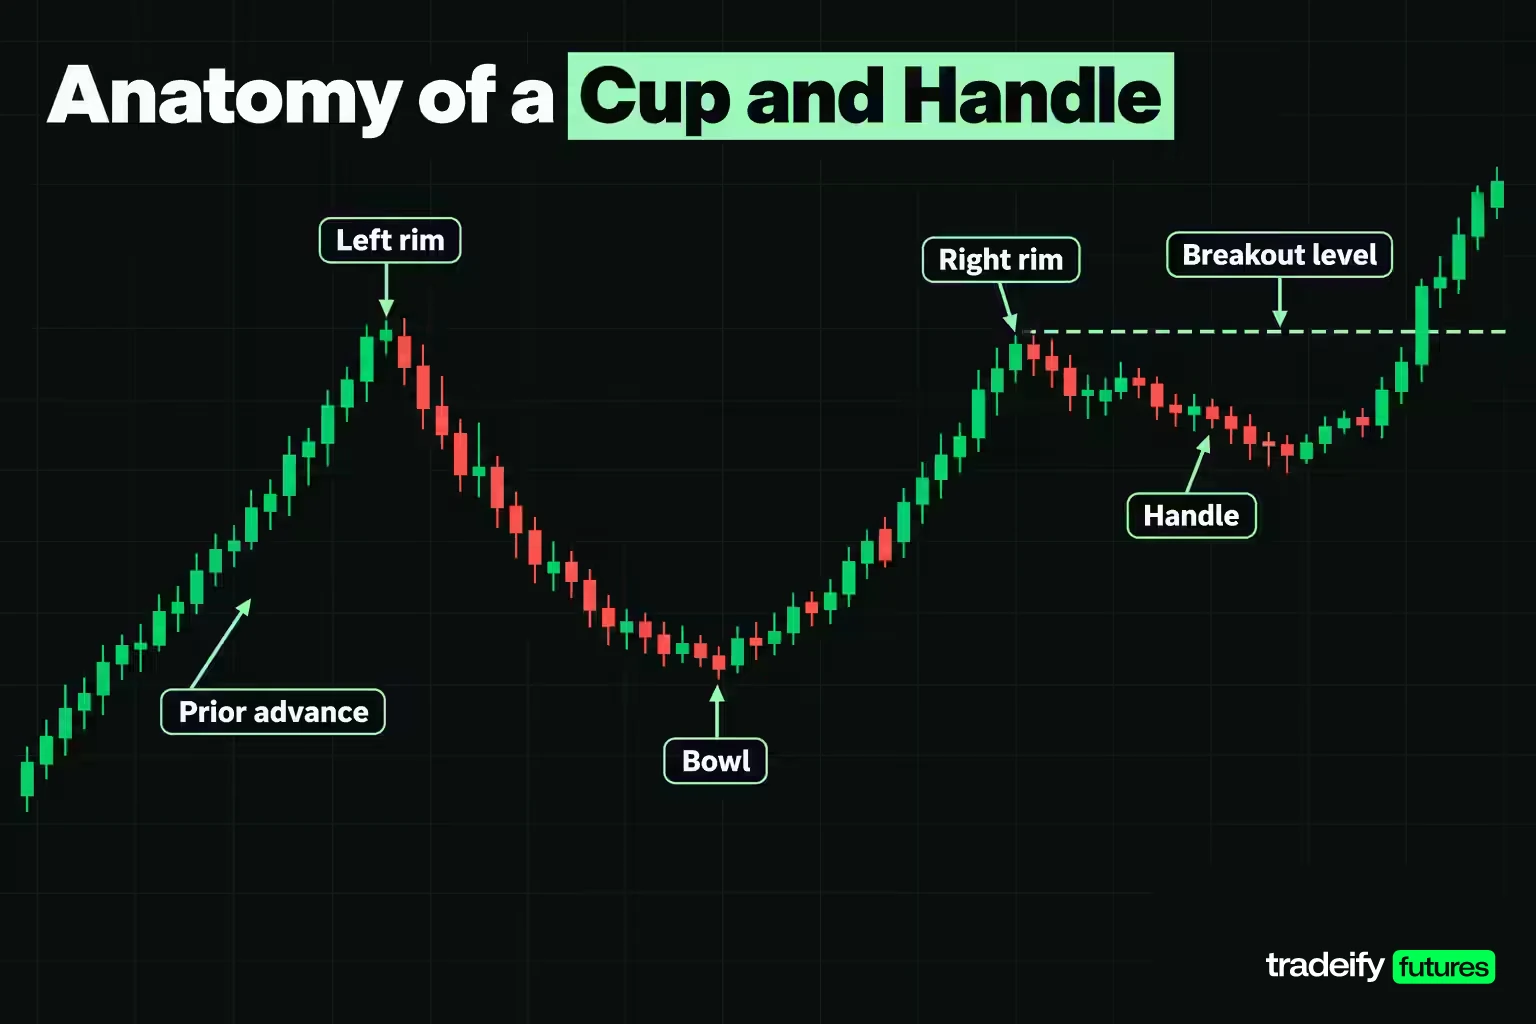
A cup and handle pattern has six parts you can mark on any chart before you think about an order:
- Prior advance. A genuine uptrend leading into the left side of the cup.
- Left rim. The high where the advance stalls and the cup begins.
- Bowl. The rounded decline and recovery that forms the cup, with its lowest point (the valley).
- Right rim. The high where price returns near the left rim.
- Handle. A short pullback or sideways drift after the right rim, often sloping slightly down like a small flag.
- Breakout level. The right rim price, which the handle has to clear.
Cup and Handle Qualification Tests
Once the parts of a cup and handle are marked, run the qualification tests in order. Each one exists because it filters out a specific way the pattern goes wrong.
| Test | Pass condition | Why the test exists |
|---|---|---|
| Prior trend | An uptrend precedes the cup, ideally a few months old on a daily chart | A continuation pattern needs a trend to continue |
| Cup shape | A rounded U, not a sharp V | A U shows a real consolidation with support at the base, while a V is a fast reversal |
| Rim symmetry | Left and right rims near the same price | Buyers met the same supply twice |
| Cup depth | A third or less of the prior advance, up to half in volatile markets | A deeper bowl looks more like a downtrend with a bounce |
| Handle position | Handle low in the upper half of the cup | Buyers who took over the bowl still control the range |
| Handle depth | No more than about a third of the cup's height | A shallow handle reads as profit-taking, a deep one as selling |
| Volume | Quieter in the handle, expanding on the breakout | Supply dries up, then demand arrives |
| Trigger | A close above the right rim | The pattern is not confirmed until price clears the rim |
The two tests that disqualify most charts are cup depth and handle position. Bulkowski's identification guidelines put the handle in the upper half of the cup, and ChartSchool says a V-shaped bottom is too sharp a reversal to qualify. If either test fails, stop scoring. Nothing later in the checklist rescues a bowl that gave back most of the advance.
Why the Handle Position Matters in a Cup and Handle
The bowl of a cup is where contracts change hands from sellers to buyers. By the time price climbs back to the right rim, many of the sellers who wanted out have sold.
The handle is the last test of that transfer. If the pullback holds in the upper half of the cup, the buyers who absorbed the selling are still defending their entries. If it cuts through the middle of the bowl, the transfer did not finish, and the rim is likely to reject price again. That is also why the handle low makes a better stop than an arbitrary percentage: it is the price where the reading you traded is wrong.
Cup and Handle Dimensions and Timing
The cup and handle has published proportions, and checking them takes a calculator, not intuition.
Cup depth. ChartSchool's guideline is that the cup ideally retraces 1/3 or less of the previous advance. A retracement of 1/3 to 1/2 is acceptable in volatile markets, and 2/3 is the extreme maximum, which ChartSchool notes conforms with Dow Theory. Measure it as the left rim minus the valley, divided by the advance that led into the left rim.
Handle depth. The handle can retrace up to 1/3 of the cup's advance (the climb from the valley to the right rim), but usually not more. ChartSchool adds that the smaller the retracement, the more bullish the formation.
Midpoint test. Bulkowski's guideline is stricter in a different way: the handle forms in the upper half of the cup. Compute the cup midpoint as the right rim plus the valley, divided by two. A handle low above that number passes.
Duration. Published durations come from daily and weekly stock charts:
| Measure | ChartSchool guideline | Bulkowski guideline |
|---|---|---|
| Cup length | One to six months, sometimes longer on weekly charts | From 7 to 65 weeks, allowing variations |
| Handle length | One week to many weeks, ideally one to four weeks | 1 week minimum, no maximum |
| Handle finding | Smaller handle retracement is more bullish | Handles shorter than the median 22 days performed better after the breakout |
Duration is the least portable rule. The same rounded shape appears on a 5-minute futures chart and completes in a morning. What carries across timeframes is the geometry: depth ratios, the midpoint test and volume behavior apply the same way whether the cup took ten weeks or ninety minutes. What changes is noise, and on short charts noise is high enough that the volume and close-above-the-rim tests do more of the work.
Measuring a Cup and Handle in Practice
Imagine an illustrative daily chart where price advances from 6,600 to 7,100, rounds into a bowl with a valley at 6,940, and recovers to a right rim at 7,092. A handle then pulls back to 7,046.
- Advance: 7,100 minus 6,600 is 500 points.
- Cup depth: 7,100 minus 6,940 is 160 points, which is 32% of the advance. That passes the one-third guideline.
- Cup height for targets: 7,092 minus 6,940 is 152 points.
- Cup midpoint: 7,092 plus 6,940, divided by two, is 7,016.
- Handle position: the handle low at 7,046 sits 30 points above the midpoint, so it passes.
- Handle depth: 7,092 minus 7,046 is 46 points, which is 30.26% of the height, inside the one-third ceiling.
Every number there is something you can compute before the breakout bar prints. If you cannot, the pattern is not ready to trade.
Related lesson: Multiple-timeframe analysis
Trend Context Before a Cup and Handle
A cup and handle is a continuation pattern, so the first thing to check is what it is continuing. ChartSchool says a prior trend should exist and should ideally be a few months old, and warns that the more mature the trend, the less upside potential the pattern tends to have.
The common mistake is drawing a cup in the middle of a downtrend. Price falls, bounces, drifts, and a bowl appears if you squint. Without a prior advance there is no measure for cup depth, no trend to resume, and the right rim is just a lower high.
Here is a practical way to check the trend before you score the cup:
- Higher-timeframe structure. On the chart one level above your trading timeframe, price should be making higher highs and higher lows into the left rim.
- Where the cup sits. A cup that forms just under a major prior high or a well-tested resistance level has a ceiling above it that the measured target ignores.
- How old the trend is. A cup after a short, fresh advance has room to work. A cup after a long, extended run may be a distribution top dressed as a pause.
Bulkowski is candid that he does not pay much attention to the price-trend guideline in his own identification rules. That is worth knowing: the statistical record does not depend heavily on it. The reason to check it anyway is practical. A trend on the higher timeframe changes what a failed breakout costs you, because a break that fails against the bigger trend tends to fail fast.
Volume Confirmation in a Cup and Handle
Volume is how the cup and handle shows its reasoning. The shape says buyers absorbed the selling. Volume is the evidence.
The textbook volume profile has three phases:
- The bowl. Volume tends to shrink as price declines into the valley and through the rounded base, as selling pressure dries up.
- The handle. Volume stays light. A handle on rising volume is a warning that the drift is real selling, not a rest.
- The breakout. ChartSchool calls for a substantial increase in volume on the breakout above the handle's resistance.
To make "substantial" measurable, compare the breakout bar's volume with an average. Bulkowski's glossary measures breakout volume against the average of the prior 3 months on daily charts. On an intraday chart, compare the breakout bar with the average of the same time window on recent sessions, because futures volume follows the clock: the opening hour of the US cash session is usually busier than the middle of the day, so a midday breakout on "average" volume and an opening breakout on "average" volume are not the same event.
Volume Caveats on Futures Charts
Futures volume has two quirks that matter for a cup and handle:
- Contract months. Volume shifts from the expiring contract to the next one around each roll. A cup drawn across a roll on a single contract month can show a volume drop that is really traders moving to the next month. Use a continuous chart for the pattern and check volume on the contract you actually trade.
- Session timing. Breakouts in thin overnight trading often print on volume that would be ignored during the day session.
If the breakout bar does not show expanding volume, you have two choices that keep the plan honest: skip it, or wait for a retest of the rim that holds. What you should not do is upgrade a quiet breakout to a confirmed one because the shape looks clean.
Related lesson: What is volume
Breakout Validation and False Breakouts
A breakout is a decision, not a print. A valid cup and handle breakout needs three things:
- A close above the right rim, not just a wick through it. Bulkowski's buy rule is a close above the right cup rim, and his trendline rule is also based on a close.
- Expanding volume on the breakout bar relative to the handle.
- No immediate rejection back inside the handle range on the next bars.
A gap over the rim counts as a breakout only if price closes above the rim. A gap that fills back into the handle on the same session has told you something different.
Throwbacks Are Normal After a Breakout
Bulkowski defines a throwback as price breaking out upward, climbing, then returning to the breakout price within 30 days. His published throwback rate for the cup with handle is 62%, and he notes that throwbacks hurt performance.
That number reframes a lot of frustration. Getting stopped out on a pullback to the rim, then watching the trade work without you, is one of the most common ways traders lose faith in a valid setup. Price coming back to the rim after a breakout is the common case, not a sign the pattern failed. A trader who expects it can plan for it: either with a stop that sits under the handle low rather than just under the rim, or by planning the retest itself as a second, lower-risk entry.
What a Failed Breakout Looks Like
A failed breakout is different from a throwback. The throwback holds the rim area and turns back up. The failure closes back inside the handle and keeps going, then takes out the handle low.
Bulkowski's study of 300 cup with handle patterns from 1990 to March 2024 found that 47% dropped substantially within two months of the upward breakout, and 23% rose no more than 15% before dropping. Those figures do not mean the pattern fails half the time. They mean a breakout that works does not keep working forever, and a plan needs both an invalidation price and a way to take profit.
The practical rule: decide in advance what a failed breakout is (a close back below the handle low, or below the rim by a fixed amount on the timeframe you trade) and act on it without renegotiating.
Related lesson: Breakout trading
How to Trade the Cup and Handle Step by Step
Trading the cup and handle is mostly arithmetic done before the breakout. The process below runs in order, and each step can end the trade before it starts. Ending a trade at step two is not a missed opportunity. It is the checklist doing its job.
Cup and Handle Steps Before the Breakout
- Qualify the trend. Confirm a prior advance on the higher timeframe.
- Score the shape. Check the U shape, rim symmetry, cup depth against the advance, handle position against the midpoint and handle depth against the height.
- Check volume. Quieter handle, then a plan to measure breakout volume against an average.
- Fix the stop. One tick below the handle low.
- Fix the target. The cup height projected from the breakout price, scaled to the published hit rate.
- Price the entry window. Find the highest entry where the reward to the target still pays for the risk to the stop.
Cup and Handle Steps at the Breakout
- Size the position. Divide the dollar risk budget by the dollar risk per contract and round down.
- Place the orders. Entry (a buy stop above the rim, or a limit for a retest), stop, and target or trailing plan.
- Manage and review. Raise the stop as price advances, exit on invalidation, and log which test passed or failed.
Worked Cup and Handle on the E-mini S&P 500
Here is an illustrative daily E-mini S&P 500 chart with round prices. It is a teaching example, not a historical chart or a forecast.
| Level or measure | Value | How it is derived |
|---|---|---|
| Prior advance | 500 points | Left rim 7,100 minus advance start 6,600 |
| Cup depth | 160 points, 32% of the advance | Left rim 7,100 minus valley 6,940 |
| Cup height | 152 points | Right rim 7,092 minus valley 6,940 |
| Cup midpoint | 7,016 | (7,092 plus 6,940) divided by 2 |
| Handle low | 7,046, 30 points above the midpoint | Lowest price of the handle |
| Handle depth | 46 points, 30.26% of the height | 7,092 minus 7,046 |
| Breakout trigger | Close above 7,092 | Right rim |
| Stop | 7,045.75 | One 0.25 tick below 7,046 |
| Full measured target | 7,244 | 7,092 plus 152 |
| Adjusted target | 7,184.50 | 7,092 plus 152 times 0.61 (92.72), rounded down to the tick |
The cup passes on depth, the handle passes on position and depth, and the trigger, stop and targets are fixed before the breakout. What is not fixed is the price you pay to get in, and that is where most of the outcome is decided.
Cup and Handle Entry Rules and Timing
There are three standard ways to enter a cup and handle, and each trades confirmation against price.
- Handle trendline entry. Bulkowski suggests drawing a down-sloping trendline along the handle peaks; a close above it signals an early buy. You get in lower, with a tighter stop, before the rim is cleared.
- Rim breakout entry. If no trendline entry is available, Bulkowski's rule is to buy when price closes above the right cup rim. This is the standard confirmation entry.
- Retest entry. Wait for the common throwback to the rim and buy when it holds. You may miss the move if it never comes back, but you pay less when it does.
The Cup and Handle Entry Window
The stop and the target in the illustrative E-mini S&P 500 example do not move: stop 7,045.75, adjusted target 7,184.50. What changes with each entry route is your reward to risk, and it changes fast.
| Entry price | Risk to stop (points) | Reward to adjusted target (points) | Reward to risk | Break-even win rate |
|---|---|---|---|---|
| 7,070 handle trendline | 24.25 | 114.50 | 4.72 to 1 | 17.48% |
| 7,092.25 rim breakout | 46.50 | 92.25 | 1.98 to 1 | 33.51% |
| 7,095 | 49.25 | 89.50 | 1.82 to 1 | 35.50% |
| 7,100 | 54.25 | 84.50 | 1.56 to 1 | 39.10% |
| 7,110 | 64.25 | 74.50 | 1.16 to 1 | 46.31% |
| 7,120 | 74.25 | 64.50 | 0.87 to 1 | 53.51% |
| 7,130 | 84.25 | 54.50 | 0.65 to 1 | 60.72% |
Read the last rows carefully. Chasing to 7,120 means risking more than you can make, and the trade now needs to win more than half the time just to break even, before costs.
Highest Cup and Handle Entry for Each Reward to Risk
In the illustrative E-mini S&P 500 cup (stop 7,045.75, adjusted target 7,184.50), the highest entry that still offers a given reward to risk comes from one formula: the target plus R times the stop, divided by one plus R. For this example, 2 to 1 is available only up to 7,092.00, the rim itself. 1.5 to 1 runs out at 7,101.25, and 1 to 1 at 7,115.12. So on this geometry, a one-tick-over-the-rim buy stop gets you close to 2 to 1, and anything above about 7,101 is a lower-quality trade than the one you planned.
That is the real choice at the breakout bar. A strong green candle through the rim pulls hard, and the urge is to get in at any price before it leaves without you. Missing the rim entry does not make 7,115 a good entry. It makes it a different trade, with different math. Decide which entries you will take before the candle closes, not after.
Related lesson: Trendlines and channels
Cup and Handle Exit Rules and Price Targets
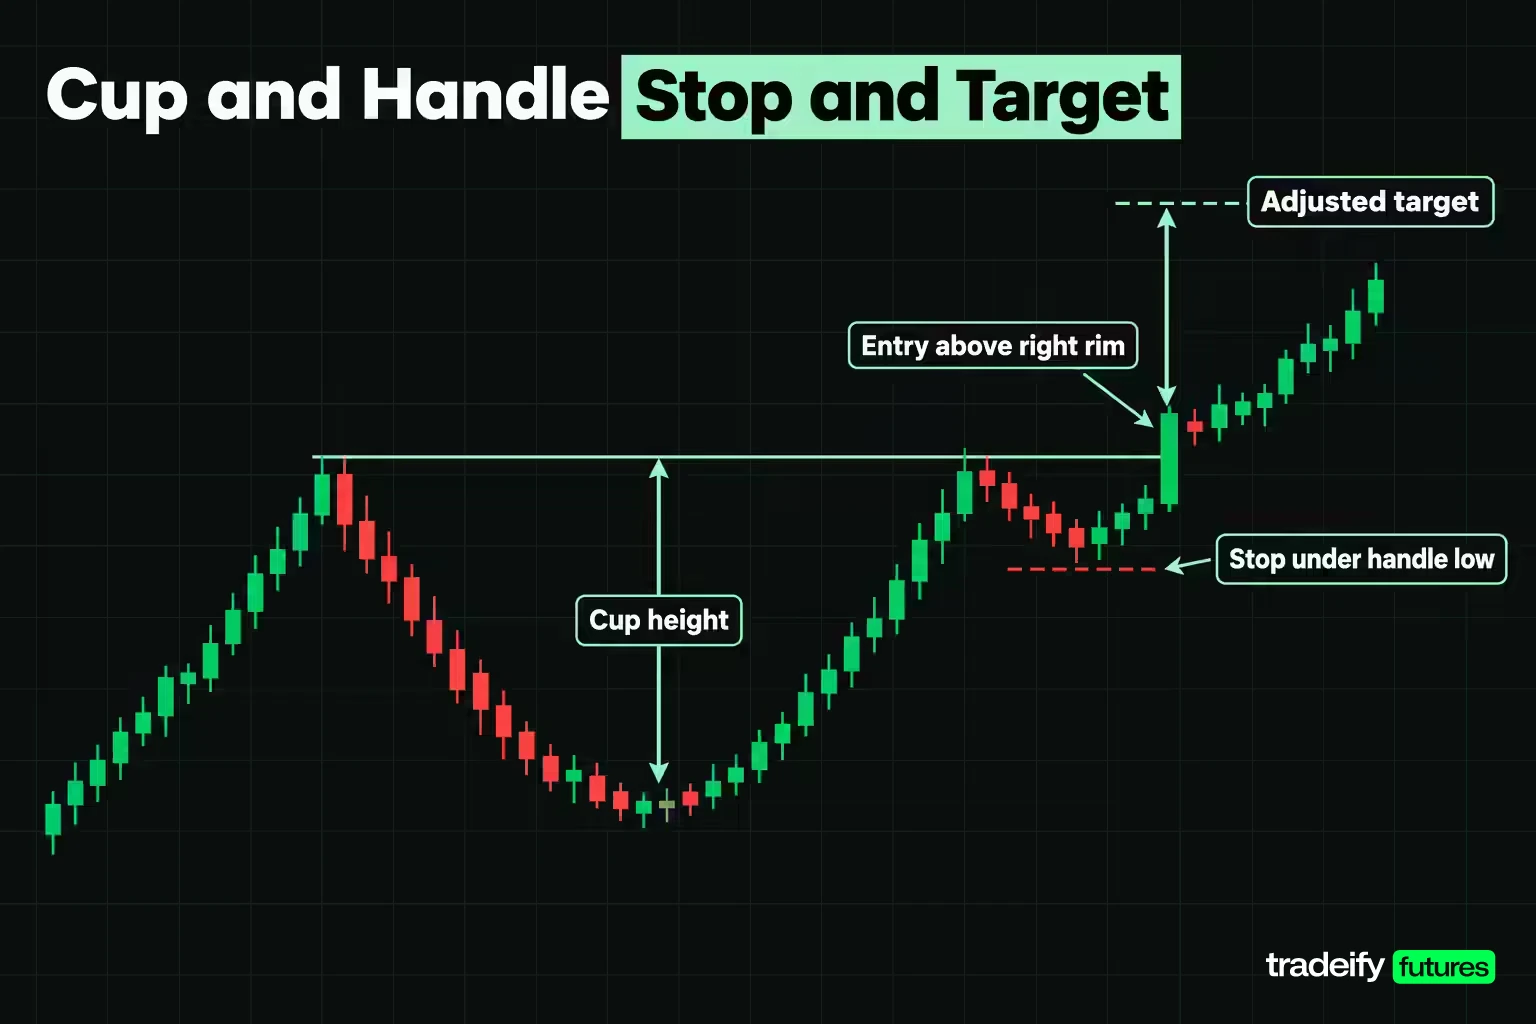
A cup and handle trade needs three exits planned before entry: where you are wrong, where you take profit, and how you protect an open gain.
The Measure Rule and the 61% Adjustment
The standard target is the cup height projected from the breakout. ChartSchool measures from the right peak of the cup to the bottom of the cup. Bulkowski uses the same height but multiplies it by his percentage meeting price target, 61% for the cup with handle across 913 perfect trades, then adds the result to the breakout price.
In the illustrative E-mini S&P 500 example, the height is 152 points:
- Full projection: 7,092 plus 152 gives 7,244.
- Adjusted target: 152 times 0.61 is 92.72 points, added to 7,092 gives 7,184.72, which rounds down to 7,184.50 on a 0.25 tick.
From a 7,092.25 entry, the full target offers 151.75 points (3.26 to 1), while the adjusted one offers 92.25 points (1.98 to 1). Planning against the full number makes every setup look better than its record. Plan against the adjusted one and treat anything beyond it as a bonus.
Partial Exits and Trailing the Stop
Bulkowski's study of 300 cup with handle patterns found 47% dropped substantially within two months of the breakout, so a common structure on a cup and handle trade is to take part of the position at the adjusted target and trail the rest. Bulkowski's own tip is to raise the stop as price rises.
Practical trailing references for a cup and handle:
- Under the rim after a clean breakout. Once price has held above the rim through the throwback window, the rim area becomes the logical support.
- Under each new swing low on the trading timeframe.
- An ATR multiple below the highest close, sized so normal noise does not stop you out.
Invalidation and Time Exits
The hard exit is the stop one tick under the handle low. Two softer exits are worth writing into the plan:
- Failed breakout. A close back inside the handle after a breakout, on volume, says the breakout did not hold. Some traders exit there rather than waiting for the handle low.
- Time stop. A breakout that stalls for many bars without progress ties up risk. Decide in advance how long you will give it.
Related lesson: Trailing stops
Cup and Handle Risk Management and Position Sizing
Every cup and handle trade has the same risk anchor: the handle low. The stop goes one tick beyond it. If that stop is too far away for your account, the answer is a smaller contract or no trade, never a tighter stop inside the handle.
Dollar Risk on Micro and E-mini Contracts
The illustrative E-mini S&P 500 example enters at 7,092.25 with a stop at 7,045.75, a risk of 46.50 points. The point value decides what that means in dollars.
| Contract | Point value | Tick value | Risk at the stop | Reward at the adjusted target | Contracts inside $500 risk | Risk as a share of $50,000 |
|---|---|---|---|---|---|---|
| Micro E-mini S&P 500 (MES) | $5 | $1.25 | $232.50 | $461.25 | 2 | 0.93% for 2 contracts |
| E-mini S&P 500 (ES) | $50 | $12.50 | $2,325 | $4,612.50 | 0 | 4.65% for 1 contract |
On a $50,000 account risking 1% per trade, a $500 budget, two MES contracts risk $465 and fit. One ES risks 4.65% of the same account, so the correct ES position at that risk level is zero. The pattern is not untradeable. The instrument is the wrong size for the stop, and that is a sizing decision, not a reason to move the stop closer.
The sizing formula is simple and should be done before entry: risk budget divided by (stop distance in points times point value), rounded down to a whole contract. Rounding up is how a 1% plan becomes a 2% loss.
Checking the Stop Against Normal Noise
A handle-low stop that sits inside normal bar-to-bar movement will be hit by noise as often as by a real failure. Average True Range (ATR), which J. Welles Wilder introduced in his 1978 book alongside RSI, measures that typical range. If the distance from entry to the handle low is smaller than about one ATR on your trading timeframe, the handle is probably too shallow to hold a meaningful stop, and the trade deserves a second look.
Costs and Slippage on Cup and Handle Trades
Commissions and slippage come out of every trade, and they matter more on tight intraday cups because the stop is small in ticks while the costs per contract stay fixed. A stop order becomes a market order when triggered, so a fast break through the handle low can fill below the stop price.
Related lesson: Position sizing
Real-World Cup and Handle Examples
Two published sources show what the cup and handle looks like on real charts, including the parts that did not go to plan.
The EMC Cup With Handle in 2000
ChartSchool walks through a cup with handle on EMC, a stock, that is useful precisely because it is not perfect:
- Trend. EMC advanced from around $10 to above $30 in about five months before peaking in March.
- Cup. The April decline was sharp, but the lows extended over two months to form the bowl, with support near the February 1999 lows.
- Depth. The cup low retraced 42% of the previous advance, inside the volatile-market range rather than the ideal third. The stock peaked at $32.69 to complete the cup.
- Handle. A sharp August decline briefly retraced more than 1/3 of the cup's advance, then recovered within a week.
- Duration. The cup lasted about three months and the handle about six weeks.
- Breakout. In early September 2000, EMC broke handle resistance on a gap up with volume expansion, and Chaikin Money Flow rose above +20%.
- Target. The projected advance was about nine points from a breakout near $32, which the stock met over the following months.
Read through the checklist, this example breaks two ideal guidelines (a 42% cup and a handle that briefly went too deep) and still worked. ChartSchool's point is that the essence matters more than the particulars. The opposite reading also holds: a chart that breaks guidelines needs stronger confirmation elsewhere, which EMC had in its gap, its volume and its money flow.
Cup and Handle Breakouts That Gave It Back
Bulkowski's trading lesson on 300 cup with handle patterns shows the other side. Among his examples:
- Valaris (VAL). The cup with handle confirmed, then the stock plunged and busted the upward breakout.
- Williams-Sonoma (WSM). On the daily chart, the breakout rose and then retraced 15%, which does not look dramatic on the chart but is a large giveback for a swing position.
- Alarm.com Holdings. A 2023 example of a drop after the upward breakout.
- Allstate. Price rose for a while after the breakout before plunging, showing that the drop can come after the trade looks like a winner.
Together these examples make one argument: the pattern can be right at the breakout and the trade can still give back the gain. Reading the direction correctly and keeping the profit are two different jobs. The adjusted target, the partial exit and the trailing stop handle the second one.
Indicators That Pair With a Cup and Handle
Indicators do not create a cup and handle, but a few of them answer questions the shape cannot.
| Indicator | Question it answers | How to read it on a cup and handle | What it cannot do |
|---|---|---|---|
| Volume bars | Is selling drying up and buying arriving | Lighter handle volume, heavier breakout volume | Explain why volume changed |
| On-Balance Volume (OBV) | Is volume accumulating on up days | OBV making a high near or before the price breakout | Confirm a breakout on its own |
| Relative Strength Index (RSI) | How stretched is momentum | RSI holding up through the handle shows a shallow pullback | Time the breakout |
| Moving averages | What is the higher-timeframe trend | Price above a rising average into the left rim | Replace the prior-trend check |
| Average True Range (ATR) | Is the stop outside normal noise | Entry to handle-low distance compared with ATR | Tell you direction |
| Chaikin Money Flow (CMF) | Is money flowing in on the breakout | Positive and rising into the breakout | Validate a bad shape |
A few reading notes:
- RSI. ChartSchool describes RSI as oscillating between zero and 100, with readings above 70 generally treated as overbought and below 30 as oversold, on Wilder's default of 14 periods. A breakout with RSI already above 70 is not automatically wrong, but it often means the entry window is narrower than the chart suggests.
- OBV. On-Balance Volume is a running total that adds volume on up days and subtracts it on down days. A rising OBV through the handle supports the reading that the drift is light selling.
- One extra filter at a time. Each indicator should remove a failure you have seen in your own log. Stacking five of them does not create a better cup. It just gives you more reasons to agree with a trade you already wanted.
Related lesson: On-balance volume
The Inverted Cup and Handle
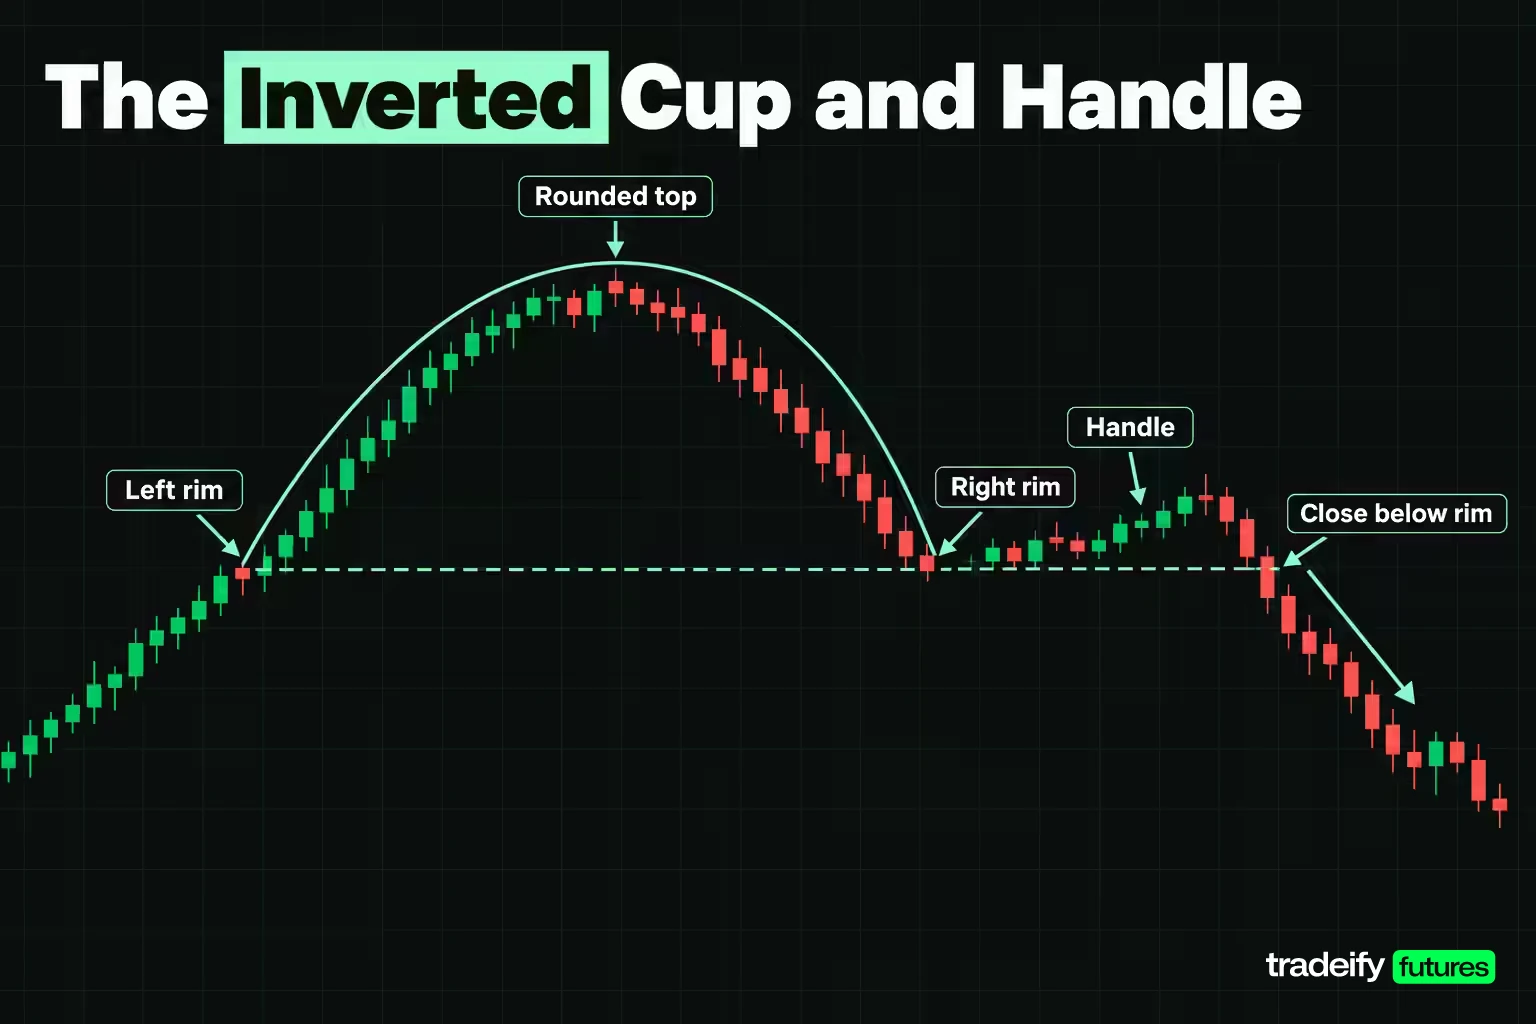
The inverted cup and handle is the bearish version: a rounded top (an upside-down cup), followed by a small upward drift (the handle), then a break below the right rim low.
Bulkowski's identification guidelines for the inverted cup with handle:
- A smooth, rounded turn, allowing exceptions.
- The two cup rims bottom near the same price.
- A handle to the right that does not rise above the cup top and often retraces 30% to 60% up the height of the cup.
- Confirmation on a close below the right cup lip.
Bulkowski's bull-market statistics for the inverted version are weaker than for the bullish one: rank 6 out of 36, a break even failure rate of 18%, an average decline of 17% and a pullback rate of 67%, with 62% meeting his price target, across 556 perfect trades. He also notes it performs best when the breakout is near the yearly low, and that even rims perform better than uneven ones.
Inverted Cup and Handle Trade Math
Bulkowski's measure rule for the inverted cup is smaller than the cup height: compute the handle height and subtract it from the right rim low. That changes the trade math.
Take an illustrative MES chart with a right rim low of 6,980, a cup top of 7,060 and a handle that rallies to 7,010. The cup height is 80 points. The handle height is 30 points, which is 37.5% of the cup height and inside Bulkowski's 30% to 60% range.
- Short entry: 6,979.75, one tick under the rim.
- Stop: 7,010.25, one tick above the handle top. Risk is 30.50 points.
- Target: 6,980 minus 30 gives 6,950. Reward is 29.75 points.
- Reward to risk is about 0.98 to 1, and the break-even win rate is 50.62%.
That is the honest result: with a handle-height target and a handle-top stop, the inverted cup offers roughly even money at the trigger. To make it worth taking you need an earlier entry (a close below a rising trendline under the handle), a context that supports a bigger move such as a break near the yearly low, or a pass.
Related lesson: Head and shoulders patterns
Cup and Handle Patterns in Futures, Forex and Crypto
The cup and handle pattern is a shape made by buyers and sellers, so it appears on any liquid chart: stock indexes, equity index futures, energy and metal futures, currency futures and crypto. The rules transfer. The statistics do not transfer automatically.
O'Neil developed the pattern on stocks, and Bulkowski's published figures come from stock charts. There is no comparable published base rate for E-mini futures, currency futures or crypto in the sources used here. Treat the 61% target figure as a reasonable planning assumption, not a measured property of the market you trade, and track your own results.
Market-by-market differences worth knowing:
- Equity index futures trade nearly around the clock, so a cup can form across sessions and the breakout can happen in thin overnight hours.
- Currency futures carry real exchange volume, unlike spot forex, where reported volume is often a broker's own tick count.
- Crypto trades every day without a close, so daily candles depend on the venue's chosen cutoff and weekend volume is thin.
Intraday Cup and Handle on the Micro Nasdaq-100
Shorter timeframes compress the pattern without changing the math. Here is an illustrative 5-minute Micro E-mini Nasdaq-100 (MNQ) cup, with round prices:
- Morning advance from 27,800 to 28,000, 200 points.
- Cup valley at 27,940, a depth of 60 points (30% of the advance).
- Right rim at 27,996, giving a height of 56 points and a midpoint of 27,968.
- Handle low at 27,978, 10 points above the midpoint, and 18 points deep (32.14% of the height).
- Entry 27,996.25, stop 27,977.75, risk 18.50 points (74 ticks), or $37 per MNQ at $2 per point.
- Adjusted target 56 times 0.61 is 34.16 points, giving 28,030.16 and 28,030.00 on the tick. Reward is 33.75 points, or $67.50 per contract, 1.82 to 1, with a 35.41% break-even win rate. The full projection is 28,052.
With a $250 risk budget (0.5% of $50,000), six MNQ contracts risk $222 and target $405. The handle here is only 18 points deep, so costs and slippage take a larger bite than on a daily chart, and the volume test should compare the breakout bar with the same time of day on recent sessions.
On our accounts, every position has to be closed by 4:45 PM ET and there are no overnight, weekend or swing holds, so a daily or weekly cup and handle is context for the session, not a position to carry for weeks. Intraday cups fit that rule. On a 50K account the limit is 4 minis or 40 micros (10 micros count as 1 mini), which is why micro contracts are the practical way to size a cup with a wide handle. Funded accounts are simulated.
Cup and Handle Mistakes and Limitations
Most cup and handle losses trace back to a small set of mistakes. Almost all of them start the same way: the trader decided the chart was a cup first and checked the rules second. Each mistake below has a rule that prevents it.
| Mistake | How it shows up | What it costs | Preventive rule |
|---|---|---|---|
| Deep or V-shaped cup | The bowl gives back more than half the advance, or reverses sharply | A long trade in a downtrend with a bounce | Fail the depth or shape test and skip it |
| Handle below the cup midpoint | The handle cuts through the middle of the bowl | A wider stop and a rim that may reject again | Fail the handle-position test and skip it |
| Handle on rising volume | Volume expands as the handle drifts down | The drift is real selling | Compare handle and cup volume before the break |
| Quiet breakout | Price closes over the rim on average volume | Higher odds of falling back into the handle | Require expanding volume or wait for a retest |
| Chasing the breakout | Entry well above the rim | Reward to risk below 1.5 to 1 and a break-even near half | Fix the highest acceptable entry before the bar closes |
| Full-target planning | Sizing to the full cup height | Targets that the record says many trades miss | Plan to the 61% adjusted target |
| Tight stop inside the handle | Stop placed above the handle low to fit a size | Stopped out by normal noise | Use the handle low; shrink size instead |
| Ignoring the trend | A cup drawn inside a downtrend | Trading a lower high as a breakout | Check the higher-timeframe trend first |
Limits of the Published Cup and Handle Statistics
The cup and handle statistics are useful, but they come with conditions that are easy to drop when they get quoted.
- Break even failure is not a win rate. Bulkowski's 5% break even failure rate counts patterns that failed to rise at least 5% after an upward breakout, the share that fail to cover the cost of trading. It does not tell you how often a trade with your stop and target wins.
- Perfect trades are selected examples. Bulkowski's 54% average rise is measured from the open after the breakout to the ultimate high on patterns that qualified as perfect trades. Real-time charts are messier.
- Stocks, not futures. The samples come from stocks. Equity index futures have different volatility, hours and participants.
- The shape is subjective. Two traders can mark different rims and valleys on the same chart, which changes every number downstream. Writing down the levels before the breakout is the only defense.
Related lesson: Risk-reward ratio
Cup and Handle FAQ
Is a cup and handle pattern bullish?
Yes, the standard cup and handle is a bullish continuation pattern. It is expected to resolve upward in the direction of the prior advance. It can still fail, which is why the handle low serves as the stop. The inverted cup and handle is the bearish version.
What are the rules for a cup and handle pattern?
The core rules are a prior uptrend, a U-shaped cup that retraces a third or less of the advance (up to half in volatile markets), rims near the same price, and a handle in the upper half of the cup. The handle should be quiet on volume, and the breakout is a close above the right rim on expanding volume. The stop goes under the handle low.
What is the success rate of the cup and handle pattern?
Bulkowski reports a 5% break even failure rate and 61% of patterns meeting his price target, from 913 perfect trades in stocks. The first figure is the share that failed to rise 5%, not a win rate. His separate study of 300 patterns found 47% dropped substantially within two months of the breakout.
How long should a cup and handle take to form?
ChartSchool suggests a cup of one to six months and a handle ideally finished within one to four weeks on daily charts. Bulkowski gives a cup range of 7 to 65 weeks and found handles shorter than the median 22 days performed better. On intraday futures charts the shape can complete within a session, and the depth and volume tests matter more than duration.
What is the opposite of a cup and handle pattern?
The opposite is the inverted cup and handle, a rounded top followed by a small upward handle and a break below the right rim low. Bulkowski reports 62% of 556 perfect trades meeting his target for it. Its measure rule uses the handle height, so its reward to risk at the trigger is often thin.
What is the most powerful pattern in trading?
No single pattern is the most powerful in every market and timeframe. Bulkowski ranks the cup with handle 3 out of 39 for overall performance in bull markets on stocks, which places it among the stronger patterns in his data. How well any pattern works for you depends on your rules, your market and your execution.
What is the most successful pattern in forex?
No chart pattern has a published, proven edge as the most successful in forex. The widely quoted pattern statistics, including those for the cup and handle, come from stock charts. Forex traders who use the cup and handle should judge it by its rules and their own logged results, and currency futures give them exchange-reported volume to check the breakout.
Does the cup and handle work on intraday charts?
The shape forms on intraday charts and the arithmetic is identical. What changes is noise: handles can be a few bars made by a handful of large orders, and breakouts in thin hours are less reliable. Compare breakout volume with the same time of day on recent sessions.
This article is for education only and is not investment advice or a recommendation to trade any instrument. Futures are leveraged, and losses can exceed what you expect, including more than a single stop distance when prices gap or slip. The worked examples use illustrative prices, and the published statistics come from stock charts and do not predict future results. Evaluation and funded accounts at prop firms are simulated and do not reflect live-market fills.


