



TL;DR: Price action trading means deciding from the bars themselves, not from indicators built out of them. Start with market state (trend or range), then the level, then the bar that forms there. Write the stop at the price that proves the read wrong and size from that distance. In the worked ES example, waiting one tick past the signal bar adds 13% more risk and lifts the break-even win rate to 37.68%. Judge a setup over a defined sample of trades, never on the last one.
Price action trading is a way of making trading decisions from the movement of price itself. You read where each bar opened and closed, how far it travelled, what it gave back, and how the sequence of highs and lows is developing. Then you make three calls: is there a trade, where is it wrong, and how much is it worth risking?
Simple to describe. Harder to do. Two traders can look at the same chart and see different things, and the market only tells you who was right after the money is at risk. This guide covers how to read a bar, market structure, levels, patterns and the main setups, then carries one illustrative futures setup all the way to an entry, a stop, a target and a position size.
What Price Action Trading Is
Price action trading is a branch of technical analysis that uses the raw price record as its main input. Every bar on a chart carries four numbers: the open (the first trade of the period), the high, the low and the close (the last trade of the period). The distance between open and close is the body. The lines beyond it are the tails, or wicks, and they show prices that traded and were then rejected.
A price action trader reads those four numbers, compares them with the bars that came before, and asks what buyers and sellers just did. The output is a description, not a forecast. "Sellers pushed below the prior low and could not hold it" is a price action read. "The market will rally now" is a hope.
Why price action traders use naked charts
Moving averages, oscillators and bands are all calculated from past prices. Stack three of them on a chart and you are looking at the same input three times with different smoothing and different lag. Price action traders strip them off so the decision rests on the thing the indicators are measuring in the first place.
Some price action traders still keep volume, a session marker or a single moving average for context. That is allowed. The method does not ban tools; it just refuses to let a tool replace the read.
The honest limits of price action
Price cannot be revised, and every bar records transactions that actually happened. The stories traders attach to bars are a different matter. Electronic markets are anonymous, so nobody can verify what participants were thinking when a pattern formed. A reference summary of the field calls those explanations subjective rationalisations that may well be wrong, and points out that the method is exposed to survivorship bias, because traders who failed with it do not attract an audience.
So hold two ideas together. Price is the cleanest input you have. Patterns are less certain than the confident way they are usually taught. The answer is not to abandon the method. It is to write the rule down and test it as a sample, because confidence without a record is just a story.
Related lesson: The wider discipline price action sits inside
Candlestick Patterns in Price Action
Candlestick patterns are the vocabulary price action traders use to describe individual bars and short bar sequences. Before the names, learn to read one bar by its shape.
Reading one bar in price action
Here is an illustrative bar on the E-mini S&P 500 (ES), using round prices so the arithmetic can be checked. ES moves in ticks of 0.25 index points.
- Open 6,002.00, high 6,004.00, low 5,998.00, close 6,003.50.
- Range: 6,004.00 minus 5,998.00 = 6.00 points, or 24 ticks.
- Body: 6,003.50 minus 6,002.00 = 1.50 points, or 6 ticks.
- Lower tail: 6,002.00 minus 5,998.00 = 4.00 points, or 16 ticks.
- Upper tail: 6,004.00 minus 6,003.50 = 0.50 points, or 2 ticks.
- The lower tail is 66.7% of the range, and the close sits at 91.7% of the range.
What that bar says: sellers drove price 4 points under the open and could not keep it there. Buyers absorbed the selling and the bar closed near its high. That is a rejection of lower prices.
What it does not say: that price will go up. Reading the rejection correctly and having a valid entry are two separate decisions. A single bar is one observation. The same bar in the middle of a quiet range means very little. The same bar after a pullback into a level the market has respected before is a candidate setup. Location turns a shape into a signal.
The candlestick patterns worth knowing first
- Pin bar (hammer or shooting star). A long tail on one side, a small body near the other end. A hammer has the long lower tail and shows rejected selling; a shooting star has the long upper tail and shows rejected buying. The illustrative ES bar is a pin bar.
- Doji. Open and close at or near the same price, so there is almost no body. It records indecision. On its own it is weak; at a level after a strong move it can mark a pause.
- Inside bar. A bar whose high is at or below the prior bar's high and whose low is at or above the prior bar's low. It shows compression. Traders often treat a break of the inside bar's range, or the larger "mother bar" range, as the trigger.
- Outside bar and engulfing bar. An outside bar takes out both the high and the low of the prior bar. An engulfing bar is the candlestick version where the body swallows the prior body. In the middle of a range, outside bars are usually noise. After a pullback in a trend, a bar that engulfs in the trend direction is a stronger signal.
- Trend bar. A bar with a large body and small tails. A run of them in one direction shows one side in control.
Different authors use different names for the same formations, and the same name for different ones. Do not get stuck on labels. Ask three questions of any bar: who won the period, where did it close inside its range, and where on the chart did it form?
Price Action vs Indicators
Price action and indicators are not enemies. They answer different questions, and each has a cost.
| Approach | What it does well | Where it struggles | Typical use |
|---|---|---|---|
| Pure price action | Reacts to the latest bar with no lag; works the same on any market or timeframe; forces you to define levels and invalidation | Subjective; two traders can read one chart differently; hard to test without written rules | Discretionary day traders reading structure and levels |
| Indicator-based | Objective rules that can be coded and backtested; easy to follow | Lags price, because every indicator is computed from past bars; stacked indicators repeat the same information | Systematic traders and beginners who want fixed triggers |
| Hybrid | Price action decides the setup; one indicator adds context such as trend direction or volume | Easy to slide back into indicator stacking when a trade feels uncertain | Most discretionary traders in practice |
The practical difference shows up at decision time. An oscillator crossing a line tells you a calculation crossed a threshold. A bar closing back above a level after trading below it tells you sellers failed at a specific price, and gives you that price as the place your idea is wrong.
Using an indicator without losing the read
If you keep an indicator, give it one job and write that job down. "The 20-period moving average slopes up, so I only take long setups" is a filter with a reason. "RSI is oversold, the moving average is curling, and MACD is about to cross" is three ways of saying the same thing about past prices.
Here is a quick test. Remove the indicator and ask whether you would still take the trade from the bars and levels alone. If the answer is no, the indicator is making the decision, and that is fine, but then you are trading an indicator system and should test it as one.
Market Structure and Trend Phases
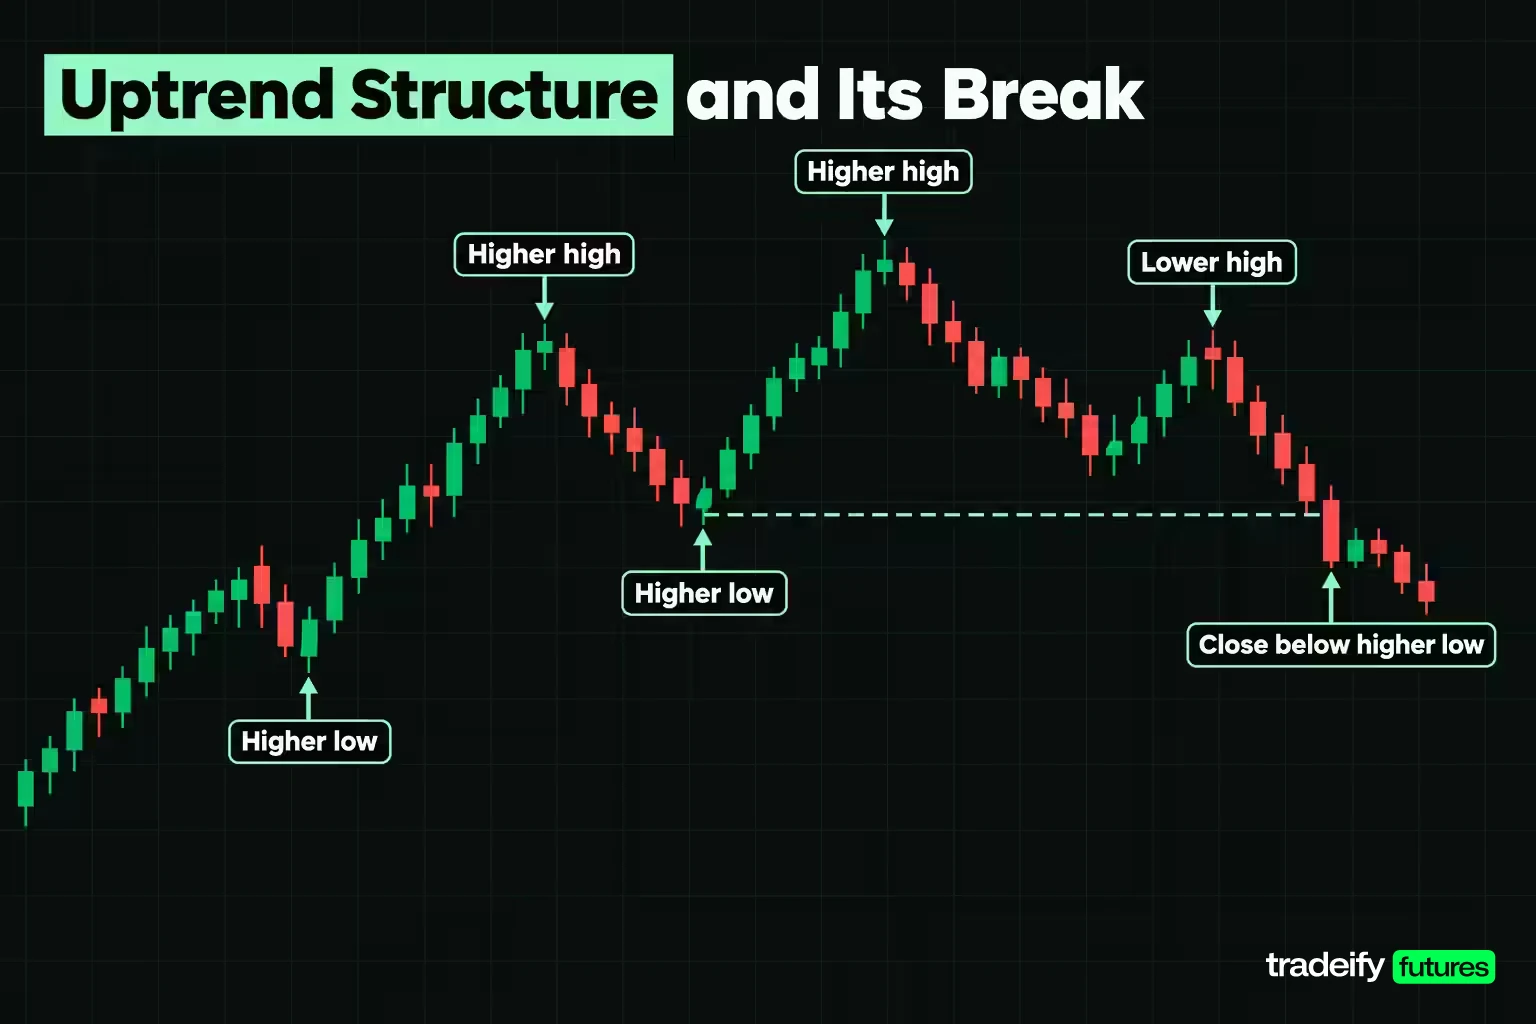
Market structure is the sequence of swing highs and swing lows, and it is the first thing a price action trader checks. Most setups depend on whether the market is trending or ranging, because a breakout rule and a fade rule are opposite instructions. Use either in the wrong state and you get a loss that looked sound on the chart.
Trend structure in highs and lows
An uptrend prints higher highs and higher lows. A downtrend prints lower highs and lower lows. That definition is measurable, which is why it beats "the line is going up".
A trend is in question when the sequence breaks. In an uptrend, the first warning is a failed attempt at a new high (a lower high). The structural break is a close below the most recent higher low. One break does not make a downtrend; it ends the uptrend reading and puts you back into "unclear" until a new sequence forms.
Ranges and market phases
A range forms when neither side is winning. Price swings between a floor and a ceiling, the highs and lows go flat, and breakouts from the middle of the range tend to fail.
Markets cycle through rough phases: a range where positions are built, a breakout and trend, pullbacks within the trend, and eventually a new range or a reversal. You do not need to name the phase perfectly. You need to know whether the current swing sequence supports trading with the move, or whether price is sitting in the middle of a box.
A two-question market structure filter
Before you look for any pattern, answer two questions:
- Is the sequence of highs and lows intact, and in which direction?
- Is price at the edge of its range or structure, or in the middle?
Setups at an edge with the sequence behind them are worth pricing. Setups in the middle of a range, against the sequence, are where most bad trades come from. If price is stuck in the middle of a box, adding another indicator does not create direction.
Related lesson: Reading highs and lows as structure
Support and Resistance Levels
Support is a price area where buying has stopped declines before. Resistance is an area where selling has capped rallies. For a price action trader, levels are where the decisions happen, because they are where a bar's shape starts to mean something.
Drawing price action levels as zones
Draw levels from swing points the market clearly reacted to: prior swing highs and lows, the edges of a range, the prior day's high and low, and areas where price stalled and consolidated. Mark them as zones a few ticks wide rather than single lines. Price rarely turns at the exact tick, and a line that is "broken" by one tick is usually still the same level.
A few properties are worth knowing:
- Role reversal. Broken resistance often acts as support on the retest, and broken support as resistance.
- Magnets. Markets often revisit prices where they reversed or consolidated. When price returns, it either turns again or goes through; the level is a decision point, not a promise.
- Round numbers. Levels ending in 00 attract orders, though with most volume now computer-generated, they are less reliable than they once were.
- Tests wear levels down. Each touch absorbs orders resting at that price. A level tested four times in an hour is often weaker on the fifth test, not stronger.
Confluence at support and resistance
Confluence means two independent reasons pointing at the same price, for example a prior swing low that lines up with the top of a range, or a level that also matches a trendline. Most price action authors say a single reason is rarely enough. Two reasons at the same place is a reasonable minimum before you look for a trigger bar.
Related lesson: How levels get built and tested
Trendlines, Channels and Fibonacci Retracements
Trendlines, channels and Fibonacci retracements are ways of marking diagonal or proportional levels when horizontal support and resistance do not tell the whole story.
Drawing trendlines and channels
An uptrend line connects two or more rising swing lows. A downtrend line connects falling swing highs. Two touches make a line; a third touch that holds makes it worth watching. A channel adds a parallel line across the opposing swings, so you can see where pullbacks and extensions have been stopping.
Trendlines are subjective. Change the anchor from a wick to a close and the line moves. Keep the rule consistent (always wicks or always bodies), and do not redraw the line every time price breaks it. A break of a well-tested trendline is information: the pace of the trend changed, even if the trend has not ended.
Fibonacci retracements as reaction zones
Fibonacci retracement levels are drawn from a swing low to a swing high (or the reverse) and mark common pullback depths. The levels most platforms print are 23.6%, 38.2%, 50%, 61.8% and 78.6%, and the 38.2%, 50% and 61.8% zones are the most watched.
Use them as candidate zones, not answers. The biggest weakness is choosing the swing points, because different anchors give different levels. They tend to work best in a clear trend, and they have no predictive power on their own. A Fibonacci level that lines up with a prior swing level is confluence. A Fibonacci level in empty space is just a number.
Related lesson: Drawing diagonal levels
Chart Patterns Built From Price Action
Classic chart patterns are larger sequences of highs and lows with names. Read them as structure, not as shapes to memorise.
| Pattern | What the highs and lows show | Typical trigger | Where the read is wrong |
|---|---|---|---|
| Double top | Two failed attempts at the same high | Close below the low between the two peaks | Price makes a new high above both peaks |
| Double bottom | Two failed pushes to the same low | Close above the high between the two troughs | Price makes a new low under both troughs |
| Head and shoulders | A higher high (head) followed by a lower high (right shoulder); the uptrend sequence breaks | Close below the neckline joining the two lows | Price rallies back above the right shoulder |
| Triangle | Highs and lows converging; range compressing | Close outside the triangle's boundary | Price closes back inside the triangle |
| Flag | A sharp move, then a small orderly pullback against it | Break of the flag in the direction of the prior move | Pullback deepens past the start of the flag |
The double bottom is a good example of why these names exist. Sellers push to a low, fail, push again and fail again. The second failure is the point where many short sellers give up, and price action traders often wait for that second attempt rather than buying the first test.
Patterns fail regularly. A head and shoulders that breaks its neckline and then closes back above it is not a pattern that "didn't work"; it is a new piece of information about who is in control.
Related lesson: The classic reversal pattern in detail
Price Action Trading Strategies
Most price action trading strategies are variations on one event: price reaches a level and is either rejected or accepted. The names differ; the logic is the same.
Trend pullback price action setup
In a trend, wait for a pullback into a level (a prior swing, a role-reversal zone or a confluence area). Look for a rejection bar or a bar that closes back in the trend direction. Stop beyond the pullback low (in an uptrend). Target the prior swing high or the next level.
This is the most common price action setup because it trades with the structure. It fails when the pullback is actually the start of a reversal, which is why the stop belongs below the swing that would break the higher-low sequence.
Rejection at support or resistance
At a range edge, a pin bar or engulfing bar that closes back inside the range can signal a fade toward the other side. Stop beyond the rejection tail. This works in ranges and fails when the range is about to break, so check whether price has been compressing into the edge with higher lows (for resistance) before fading it.
Inside bar breakout
After a strong bar, an inside bar shows compression. Trade the break of the inside bar's high or low in the trend direction, with the stop on the other side of the inside bar or the mother bar. Inside bars in the middle of a range produce many false starts; they are better at a level or within a trend.
Breakout and retest
Price breaks a level, then returns to test it from the other side. A rejection on the retest is the trigger. You give up the first part of the move in exchange for evidence that the level has switched roles.
Failed breakout reversal
Price breaks a level, fails to follow through, and closes back inside. Traders who bought the breakout are now trapped, and their stops sit just under the level. The trade is the move back into the range, with the stop beyond the extreme of the failed breakout.
Whichever strategy you use, the same four decisions apply: the level, the trigger bar, the invalidation price and the target. If you cannot write all four before the order, there is no setup yet.
Related lesson: The labelled version of the same ideas
Breakouts and Fakeouts in Price Action
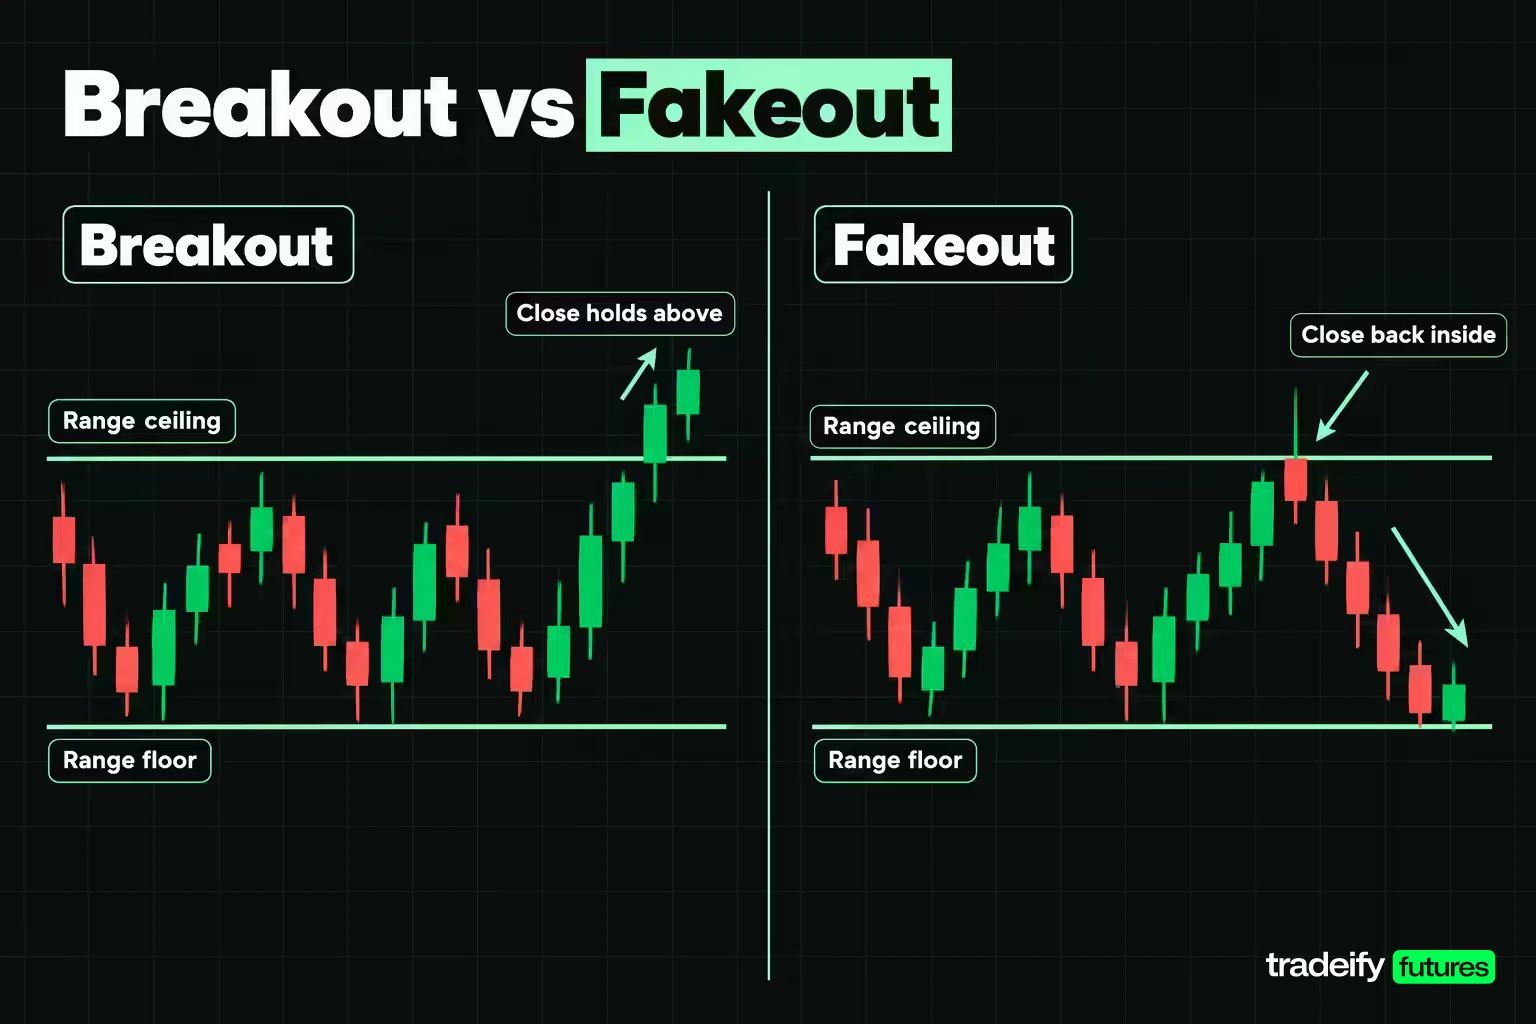
A breakout is price moving out of a range or through a level and staying out. A fakeout (a false breakout) is price poking through and then closing back inside. Breakouts are where the fastest moves start and also where a lot of accounts get hurt, because the excitement of a level breaking is exactly when patience is hardest.
An illustrative price action fakeout
Imagine ES has spent a session in a range between 5,980.00 and 6,000.00. A bar pushes through 6,000.00 and closes at 6,003.00. Breakout buyers pile in. The next bars stall, and a bar closes back at 5,996.00, inside the range.
Two groups are now in trouble. Breakout buyers above 6,000.00 are losing, and their stops are likely under the range ceiling or deeper. When those stops trigger, the selling can carry price back toward the middle of the range or the floor at 5,980.00. That is what price action traders mean by trapped traders and stops being run.
How to separate a breakout from a fakeout
No filter makes this certain, but several conditions shift the odds:
- The close matters more than the wick. A bar that trades through a level and closes back inside has not broken it.
- Look at the approach. Price that compresses into a level with rising lows (higher lows into resistance) is more likely to break it than price that slams into it after a long move.
- Watch the follow-through bar. A real breakout tends to produce a second bar that holds beyond the level. A fakeout tends to produce a stall or an immediate reversal.
- Consider the retest. Waiting for the retest costs some of the move but gives you a defined stop on the other side of the level.
- Check the higher timeframe. A breakout in the direction of the higher-timeframe trend has more behind it than one against it.
The costliest habit is buying the third or fourth bar of a breakout, far above the level, because the move "is happening". By then your stop has to sit back at the level, the risk is wide, and you are the trader who gets trapped if it fails. Missing the first entry does not make the next price a good entry. It makes it a different trade.
Related lesson: How breakout traders plan entries
Multiple Timeframe Price Action
Multiple timeframe analysis means using a higher timeframe to decide state and levels, and a lower timeframe to time the entry. It stops you from buying a beautiful 5-minute pin bar straight into daily resistance.
A common pairing is a factor of about four to six between charts. For example, a day trader might use a 1-hour chart for structure and levels and a 5-minute or 15-minute chart for the trigger bar. A swing trader might pair a daily chart with a 4-hour chart. These are illustrative pairings, not rules; the point is that each chart has one job.
A simple process:
- Higher timeframe. Mark the trend (or range), the major swing highs and lows, and the levels price is approaching.
- Trading timeframe. Wait for price to reach one of those levels.
- Trigger. Take the setup only if the lower-timeframe bar confirms in the direction the higher timeframe supports.
When timeframes disagree (the 5-minute chart is trending up into a falling 1-hour structure), either stand aside or treat the trade as a counter-trend scalp with a closer target. Do not keep adding charts until one agrees with you. That is confirmation shopping, not analysis.
Match the chart to your holding period. Take setups from the timeframe you actually hold trades on, and use the higher one only for context.
Related lesson: Pairing timeframes step by step
Price Action Entries and Exits in a Worked Example
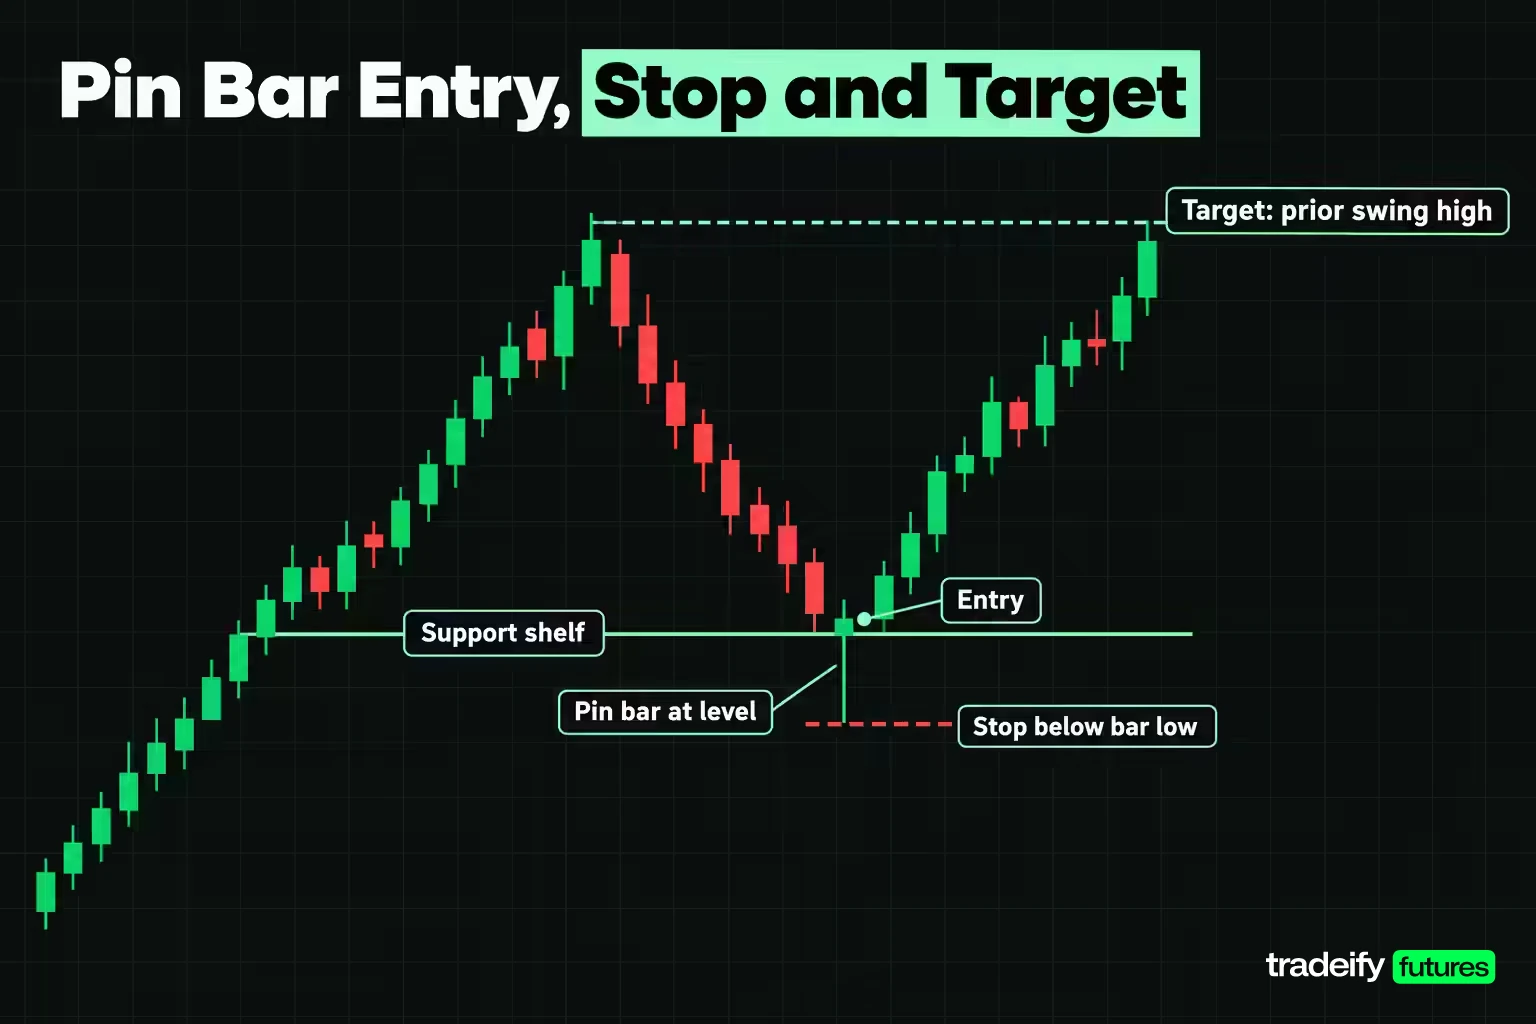
Entries and exits are where a price action read becomes a trade, and where most of the money is won or lost. This section carries one hypothetical setup from the bar to the numbers. Every price is a round illustrative level, not a real trade and not a recommendation.
The illustrative price action setup
ES has been rising. It pulls back to a support shelf around 6,000.00 that has held before, and the most recent swing high sits at 6,015.00. A bar dips to 5,998.00, two points under the shelf, and closes back above it at 6,003.50 (open 6,002.00, high 6,004.00). It is a pin bar at a level, with the trend behind it.
Three decisions follow, and each gets written down before the order goes in:
- Invalidation. The bar's low at 5,998.00 is the price that proves the rejection wrong. The stop goes one tick beneath it, at 5,997.75.
- Target. The prior swing high at 6,015.00, a level the market has already reacted to.
- Entry. The close of the trigger bar, a stop order one tick above the bar high, or later still.
Pricing three entry choices
ES is worth $50 per index point, so one 0.25-point tick is $12.50. The Micro E-mini S&P 500 (MES) is the same index at one tenth the size: $5 per point and $1.25 per tick.
| Entry choice | Entry price | Risk in ticks | Risk per ES | Risk per MES | Reward to risk | Break-even win rate |
|---|---|---|---|---|---|---|
| Close of the trigger bar | 6,003.50 | 23 | $287.50 | $28.75 | 2.00 | 33.33% |
| One tick above the bar high | 6,004.25 | 26 | $325.00 | $32.50 | 1.65 | 37.68% |
| Three ticks above the bar high | 6,004.75 | 28 | $350.00 | $35.00 | 1.46 | 40.58% |
Read across the rows. The stop never moved, because the reason for the trade never changed. Waiting one tick above the high adds 0.75 points (3 ticks) of risk, which is 13% more money on the same idea, and the reward shrinks from 46 ticks to 43. The break-even win rate (1 divided by 1 plus reward to risk) climbs from 33.33% to 37.68%.
What waiting for confirmation costs
Confirmation does buy something. An entry above the bar high only fills if buyers follow through, so setups that fail immediately never become losses. Price action signals are also not final until the bar closes, which is why entering mid-bar (an early entry) carries extra risk.
But confirmation is never free. Suppose, purely as an illustration, that this ES pullback rule (stop 5,997.75, target 6,015.00) wins 40% of the time. At the close entry, the expectancy is 0.4 x 2.00 minus 0.6 = +0.20 of the amount risked, or $57.50 per ES contract. At the one-tick entry, it drops to about +0.06R, or $20.00 per ES. Chase three ticks and it turns slightly negative, about -$5.00 per ES. Same chart, same stop, same win rate.
Which side is right depends on measured data, not opinion. The number that settles it is how often your signals fail right at the level before running. If your journal shows most failures happen in the first couple of ticks, confirmation earns its cost. If not, it is charging you for nothing.
Price action exits that follow structure
Price action exits deserve the same rules as entries. Point the target at a level the market has already respected, not a round number you like; in the illustrative ES long from 6,003.50, that is the 6,015.00 swing high. Decide in advance whether you exit in full at the target or take part off and trail the rest behind new swing lows. And if a bar closes back below the 6,000.00 shelf the trade was built on before price reaches the target, the read is weakening even if the 5,997.75 stop has not been hit yet. Many traders close the trade there rather than waiting for the full loss.
Related lesson: The ratio that makes or breaks a setup
Risk Management and Position Sizing for Price Action Setups
Risk management turns a price action read into a size that can survive being wrong several times in a row. The stop comes from the chart. The size comes from the stop.
Sizing a price action trade from the stop distance
Take the illustrative ES long at 6,003.50 with a stop at 5,997.75: 23 ticks, or $287.50 per ES and $28.75 per MES.
- A $25,000 account risking 1% has a $250 budget. One ES contract at $287.50 is 1.15% of the account, so it does not fit. Eight MES contracts risk $230.00 and do.
- At the one-tick entry (26 ticks), the same budget allows seven MES, at $227.50 of risk.
- A $50,000 account at 1% has $500. That covers one ES at $287.50, or 17 MES at $488.75.
Notice the order: the bar produced a level, the level produced a stop, the stop produced a dollar risk, and the dollar risk produced the size. If you pick the size first and then place the stop where the loss "feels okay", the stop no longer marks where the idea is wrong.
Two cautions. A risk budget can allow more contracts than your broker's margin or your account's rules permit, and the lower limit always wins. And stops are assumed to fill at the stop price, which a fast market can beat.
Break-even and trailing stops
Moving the stop to break-even protects the trade, but it also shortens the distance price can breathe. Many pullback setups retest the entry area before running, and an early break-even stop turns some of those into scratch trades. A rule many traders use is to move to break-even only after price has made a new swing in their favour, not after a set number of ticks.
Trailing stops behind each new higher low (in an uptrend) let you stay in a trend while letting structure, not emotion, decide the exit. Write the trailing rule down before the trade so the decision is not made while the P&L is moving.
What a 20-trade sample can tell you
This is the part most price action content skips, and it is why traders abandon rules that work.
Assume a price action rule genuinely wins 40% of the time at 2.00 reward to risk, such as an ES pullback long entered at the close of a pin bar with a 23-tick stop and a 46-tick target. It finishes a block of trades positive if more than one third of trades win.
- 20 trades: needs at least 7 winners against an expected 8. Probability 75.0%, so a rule with a real edge still ends a 20-trade block flat or negative 25.0% of the time.
- 50 trades: needs at least 17 winners against an expected 20. Probability 84.39%.
- 100 trades: needs at least 34 winners against an expected 40. Probability 90.87%.
Losing streaks are the same arithmetic. At a 40% win rate, six losses in a row happens on 4.67% of runs of six, and eight in a row on 1.68%. Six straight losses at eight MES and $28.75 per contract is $1,380, or 5.52% of a $25,000 account. That is the number to size against, because at some point it will happen.
Define the sample size before you start counting, and judge the rule on the block, not on today. One rough week is one line in the sample, not a verdict.
Related lesson: How a stop distance becomes a contract count
Psychology and Common Price Action Mistakes
Price action gives you a continuous stream of plausible setups. That is its strength and its trap. The supply of readings is unlimited; the number you can take with a written rule is not.
Most price action mistakes are behaviours, not chart errors. If you recognise yourself in the table, you are in good company. Each of these feels reasonable in the moment, which is exactly why they need a rule written in advance.
| Mistake | How it shows up | Why it happens | Countermeasure |
|---|---|---|---|
| Setup shopping | A clean-looking pin bar in the middle of a range | The market state was never checked | Answer the trend or range question before looking at any bar |
| Chasing the entry | Buying well above the signal bar after missing it | Fear of missing the move | Write the entry rule; a missed entry is a different trade, not a late version of the same one |
| Comfort stops | Stop set where the loss feels acceptable | Sizing came before the stop | Stop at the invalidation price, then size from that distance |
| Moving the stop | Widening the stop as price approaches it | Hope that the read will still work | Decide in writing that stops only move in your favour |
| Revenge trading | Taking the next marginal setup right after a loss | Wanting the loss back today | Set a daily stop on losses or trades, and a cooling-off break after one |
| Judging on one trade | Abandoning the method after a loss, or overconfidence after a win | One outcome carries almost no information | Fix the sample size first, then judge the block |
Price action discipline as precommitted rules
Discipline in price action is not a personality trait. It is a set of decisions made before the session, when you are calm, so they do not have to be made during it. Typical examples: a maximum number of trades per session, a daily loss level at which you stop, a list of the setups you trade and nothing else, and a rule that a missed entry is gone.
If you notice yourself drawing new lines on the chart to justify a trade you already want, that is the moment to stop. The chart has not changed. You have.
Related lesson: The habits behind consistent execution
How to Start Learning Price Action
Learning price action is mostly about narrowing down. It is tempting to study every named pattern across several markets and timeframes at once, and it is the slowest way to learn. The traders who make progress usually do the opposite: one market, one timeframe, one setup.
A practical price action learning path
- Clean the chart. Candlesticks, volume if you want it, and your levels. Nothing else for the first few weeks.
- Pick one market and one timeframe. Liquid futures such as ES or MES move in clean ticks and trade most of the day. Learn how that one market behaves at its levels.
- Mark structure daily. Before each session, mark the prior day's high and low, the major swing levels and whether the trend is up, down or sideways.
- Choose one setup. For most beginners, a trend pullback to a level is the simplest. Write its rules: the state it needs, the level, the trigger bar, the entry, the stop, the target.
- Practise on replay before risking money. Replaying historical bars one at a time forces you to decide without seeing what comes next, which is the skill that matters.
- Trade small and log everything. Micro contracts let you trade the same setups at one tenth of the dollar risk while you build the sample.
Keeping a price action trading journal
A journal turns opinions about your trading into data. For each trade, record:
- Date, market, timeframe and session.
- Market state (trend or range) and the level the setup formed at.
- The trigger bar, with a screenshot.
- Entry, stop, target, size and the planned reward to risk.
- The result in ticks and dollars, and whether you followed the written rule.
Review in blocks, not trade by trade. After 20 or more trades of one setup, look at the win rate, the average win and loss in R, and how many trades broke your own rules. Rule breaks are usually the first thing to fix, because they make the rest of the data meaningless.
A pre-trade checklist
Before any price action order goes in:
- What state is the market in, and is the sequence of highs and lows intact?
- Which level is the setup forming at, and is there a second reason at the same price?
- What price proves the read wrong?
- What level is the target?
- What is the reward to risk at the actual entry, and what win rate does it need?
- What size does that risk allow, and does it fit the account's rules?
If any answer is missing, wait.
On our accounts, you can practise this on supported platforms before you trade it: WealthCharts includes Chart Replay, which rewinds a chart to a past date and replays the bars at adjustable speeds, and Tradesea offers personal lockouts that block you from placing orders for a set time after a rough stretch. Our contract limits cap size (a 50K account can hold up to 4 minis or 40 micros), every position has to be closed by 4:45 PM ET, and evaluation and funded accounts are simulated.
Related lesson: Building the checklist into a routine
Price Action FAQ
What does price action mean in trading?
Price action is the movement of price itself, read from each bar's open, high, low and close and from the sequence of highs and lows across bars. Trading on price action means making decisions from that record rather than from indicators calculated from it.
Is price action trading profitable?
Price action trading can be profitable only when a specific written rule has a real edge after costs and the trader follows it. The method itself is a way of defining entries, stops and targets, not a source of profit. Whether it works for you depends on whether your specific rule has an edge, your sizing, your costs and whether you can follow the rule through losing streaks. Be wary of anyone who answers this with a number.
What is the best price action strategy?
The best one is the one you can write down and test. Pin bars, inside bars, failed breakouts and retests all describe a level being rejected or accepted. A strategy becomes useful when the entry, stop, target and size are fixed in advance and tracked over a defined sample.
Is price action the same as smart money concepts?
They overlap heavily. Both read structure and levels and avoid indicator stacks. Much of what is taught as order blocks, liquidity sweeps and breaks of structure is older price action vocabulary under new names, so pick one vocabulary and judge it on results.
Which timeframe is best for price action trading?
There is no single best timeframe. Use the one that matches how long you hold trades, and a higher one for structure and levels. Day traders often trigger on 5-minute or 15-minute charts with a 1-hour chart for context.
Do price action traders use indicators?
Some do. Many keep volume or one moving average for context while letting the bars and levels make the decision. The risk is drifting back into stacked indicators that repeat the same information.
Trading Risk Note
Trading futures involves substantial risk, and leverage means losses can exceed what you expect or deposit. Every price, stop, target and dollar figure in this article is a hypothetical illustration built from published contract specifications, not a quote or a record of a real trade. Evaluation and funded accounts are simulated. This is education, not investment advice.


