
Table of Contents
- Why Footprint Chart Trading Matters for Prop Traders
- Footprint Chart Tools for Retail Traders
- What Is a Footprint Chart
- Market Microstructure for Footprint Chart Trading
- Anatomy of a Footprint Chart
- Footprint Chart Types for Trading
- Best Footprint Chart Settings for Beginners
- Delta on Footprint Charts
- Footprint Chart Imbalances and Stacked Imbalances
- Point of Control on a Footprint Chart
- Tools to Use with Footprint Charts
- Common Footprint Chart Patterns
- Beginner Footprint Chart Trading Strategies
- Footprint Chart Practice Routine Before Live Trading
- Footprint Chart Trading in Tradeify Evaluations
- Tradeify Funding Models for Footprint Chart Traders
- End of Day Drawdown for Footprint Chart Traders
- Tradeify Payout Rules for Footprint Chart Traders
- Tradeify Elite Live Program
- Putting Footprint Chart Strategy and Funding Together
- Footprint Chart Trading FAQs
- Key Takeaways for Trading Footprint Charts
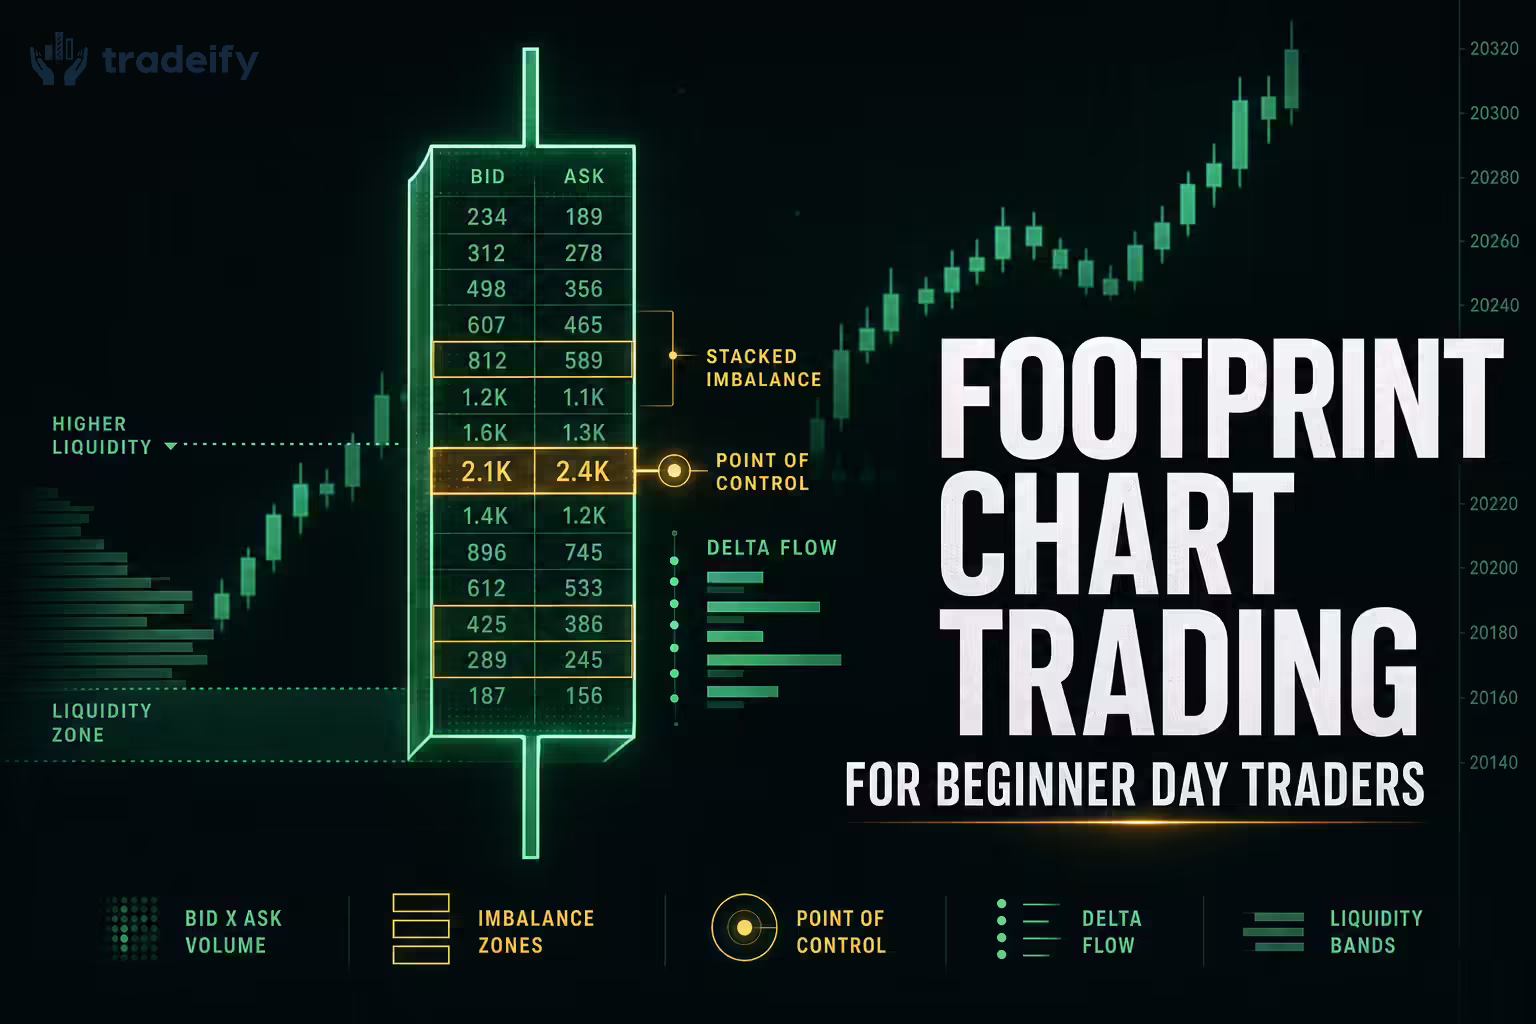
TL;DR: Footprint chart trading shows bid x ask volume at each price inside a candle so beginner day traders can read order flow, delta, 300% to 400% imbalances, stacked imbalances, POC, absorption, exhaustion, and finished or unfinished auctions with more precision than candlesticks alone. Tradeify at tradeify.co is a futures prop firm whose supported instruments include ES, NQ, Crude Oil, Gold, and Bitcoin futures, among others , with Growth, Select, and Lightning plans, end of day trailing drawdown, up to $750,000 in simulated funding across 5 accounts, $0 activation fees, and a 90/10 profit split on all Sim Funded payouts. The strongest setup is not a standalone footprint signal, but a footprint read at a clear level using volume profile, VWAP, cumulative delta, and predefined risk.
Why Footprint Chart Trading Matters for Prop Traders
The proprietary trading sector is currently undergoing a major shift. Data indicates that search volume for the prop trading sector has increased dramatically over the past several years, marking a large migration away from unregulated forex models toward regulated futures firms. As an amateur day trader stepping into this arena, securing a funded account is only the first step. Maintaining it requires a distinct analytical edge.
This guide serves as a practical introduction to footprint chart reading, specifically designed for day traders preparing to tackle a Tradeify day trading challenge. By mastering the granular data of footprint charts, you will learn to read the market's true narrative, identify precise entry and exit points, and deploy risk management strategies essential for passing evaluations and securing consistent payouts.
Footprint Chart Tools for Retail Traders
Historically, access to Level 2 order flow data and cluster analysis was restricted to institutional trading floors. Today, platforms like NinjaTrader and Tradovate, both fully supported by Tradeify, make this data available to retail traders, who acquire it directly through the platform as a paid data subscription rather than from Tradeify. The data is only as valuable as the trader's ability to interpret it. This guide will systematically deconstruct footprint charts, order flow dynamics, bid/ask imbalances, and proprietary firm risk mechanics, giving you the knowledge required to succeed as a funded Tradeify trader.
What Is a Footprint Chart
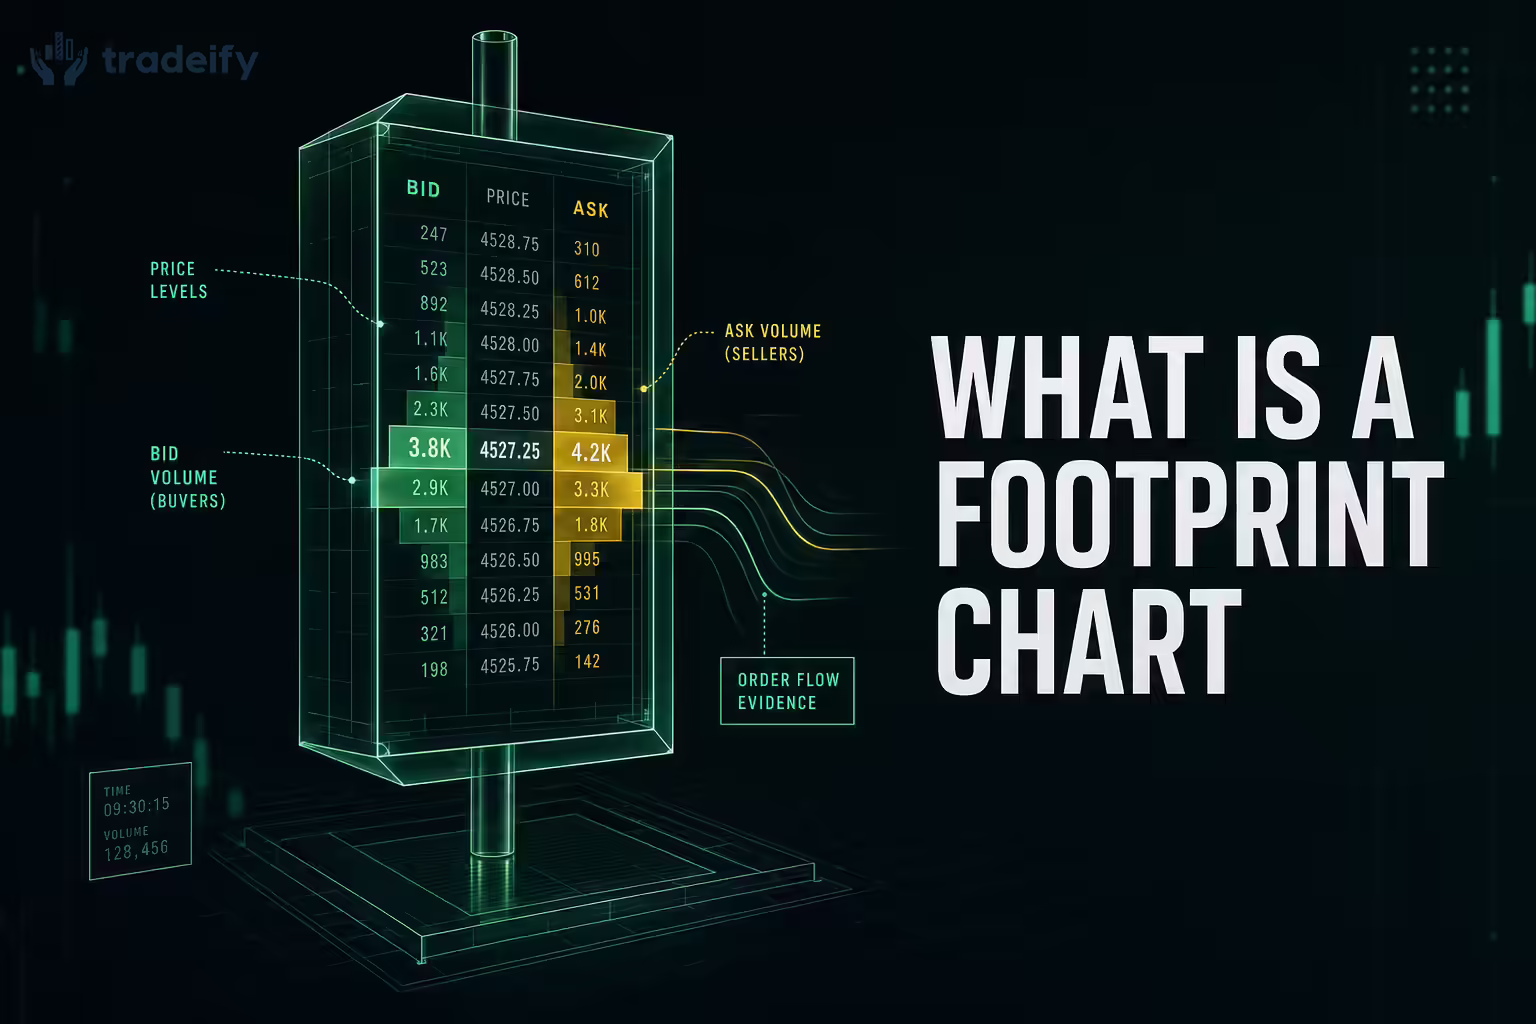
A footprint chart, sometimes referred to as a cluster chart or numbered bar chart, is an advanced multi-dimensional financial chart that provides detailed information regarding trading volumes and price levels over a specific time interval. To understand the practical value of footprint charts, you must first recognize the inherent limitations of traditional charting methodologies.
Traditional candlestick charts are the standard visual representation of price movements in financial markets. A standard candlestick provides only four data points for a given period: the Open, High, Low, and Close. While these charts offer a broad visual summary of structural trends and the aftermath of the market's auction process, they compress data significantly. They show you where the price went, but they do not explain how or why the price arrived at that destination.
Footprint charts solve this problem by looking inside the candle. They break down the aggregate volume of a price bar into individual price levels, displaying the exact number of contracts traded at each tick. More importantly, a footprint chart segregates this volume into bid and ask categories, allowing traders to observe the aggression of market participants. When you look at a footprint chart, you are looking at a historical record of the limit order book being consumed by market orders.
If a standard candlestick is the exterior of a building, the footprint chart is the blueprint, the electrical wiring, and the structural support system all visible at once. It breaks down the DNA of a market move, showing whether a breakout was backed by real buying strength or simply a lack of sellers, and whether a reversal came from exhaustion or genuine absorption. For traders participating in prop firm challenges, this level of detail is not just a luxury. It is a tactical necessity to minimize drawdowns and maximize profit efficiency.
Market Microstructure for Footprint Chart Trading
To read a footprint chart effectively, you need a solid understanding of financial market microstructure and the continuous double auction process. Financial markets operate on the interaction between two types of orders: passive orders and aggressive orders.
Passive orders, also called limit orders, are placed by traders willing to buy or sell at a specific price. They provide liquidity to the market. The collection of all passive buy orders forms the Bid, and the collection of all passive sell orders forms the Ask. These orders sit in the order book waiting to be filled.
Aggressive orders, also called market orders, are placed by traders who want to buy or sell immediately at the best available current price. They consume liquidity.
A trade only occurs when an aggressive market order interacts with a passive limit order. Price moves down when aggressive sellers predominate over passive buyers, and up when aggressive buyers predominate over passive sellers.
The footprint chart captures this dynamic precisely. Every footprint chart is built around two core data points.
Bid Volume shows trades executed at the bid price, meaning sellers were the aggressors, hitting existing passive buy orders.
Ask Volume shows trades executed at the ask price, meaning buyers were the aggressors, lifting existing passive sell orders.
Anatomy of a Footprint Chart
When you load a footprint chart onto a platform like Tradovate or NinjaTrader, you are presented with a visual grid. Each vertical column represents a specific time period such as a 5-minute candle, and within that column there are multiple rows representing every individual price tick that traded during that period.
Within each cell or cluster, you will typically see two numbers separated by an "x," formatted as Bid Volume x Ask Volume.
The left number, Bid Volume, represents the volume of aggressive market sell orders that struck the passive limit buy orders at that specific price.
The right number, Ask Volume, represents the volume of aggressive market buy orders that struck the passive limit sell orders at that specific price.
By visually separating the buyers and sellers at every individual tick, the chart allows you to see the real-time battle between supply and demand. You can immediately identify whether a massive green candle was the result of heavy, aggressive buying or if it simply drifted upward on low volume due to a lack of liquidity.
Footprint Chart Color Coding
Modern footprint charts use dynamic color coding to facilitate rapid visual processing.
Green backgrounds or text generally indicate that buyers were stronger at that specific price level, meaning ask volume exceeded bid volume.
Red backgrounds or text indicate that sellers were stronger at that specific price level, meaning bid volume exceeded ask volume.
Traders can configure these visual settings based on intensity. A price level where 500 contracts traded on the ask versus 10 on the bid might be shaded dark green, while a level with 50 on the ask and 40 on the bid might be light green. This gradient allows the eye to instantly spot zones of extreme aggression.
Footprint Chart Types for Trading
Not every footprint chart displays the same information. Most platforms offer several modes, and choosing the right one makes the chart easier to read.
Bid/Ask Footprint shows aggressive sell volume at the bid on one side and aggressive buy volume at the ask on the other side. It is best for reading who controlled each price level inside the bar.
Delta Footprint shows the net difference between ask volume and bid volume at each level or across the bar. It is best for spotting buying or selling aggression quickly.
Volume Footprint shows total traded volume at each price without separating buyer and seller aggression. It is best for finding high-volume nodes and areas of acceptance.
Profile Footprint combines a footprint with a volume-profile-style histogram inside the bar. It is best for seeing where volume concentrated during the candle.
Trades or Tick Footprint shows the number of trades at each price level rather than total contract volume. It is best for studying activity when trade count matters more than size.
Diagonal Footprint compares bid and ask volume diagonally across adjacent prices. It is best for finding imbalances that reflect the mechanics of the bid/ask spread.
The naming changes by platform. NinjaTrader calls footprint charts Volumetric Bars, ATAS often refers to clusters, and some older traders still use the MarketDelta term Footprint. The concept is the same: the chart breaks a candle into price levels and shows what actually traded there.
Best Footprint Chart Settings for Beginners
Start with a simple setup. A beginner does not need every statistic, label, color, and alert turned on. Too much information makes the chart look more professional but often makes decisions worse.
Use Bid/Ask or Delta mode first. Bid/Ask mode teaches you how aggressive buyers and sellers interact at each price. Delta mode is faster to scan once you understand the basic mechanics.
Show bar delta, total volume, and POC. These three values summarize who was aggressive, how much participation occurred, and where the most business traded inside the bar.
Enable imbalance highlighting, but keep the threshold meaningful. Many platforms default to a 300% imbalance, meaning one side traded three times the volume of the opposite side at the diagonal comparison point. Some traders use 400% to reduce noise. The goal is to highlight real aggression, not decorate the chart.
Use manual row size when precision matters. TradingView allows automatic or manual row sizing. Auto row size can adapt to volatility, but manual ticks-per-row keeps comparisons cleaner when you are reviewing alerts or replaying a setup. If a platform supports alerts on imbalances, align the alert settings with the same row size shown on the chart.
Start with 1-minute to 5-minute bars for intraday futures. A 1-minute footprint gives more execution detail but more noise. A 5-minute footprint is slower but cleaner. If you are trading a prop firm evaluation, choose the timeframe that helps you define risk calmly rather than the one that creates the most signals.
Be careful when comparing real-time and historical footprint signals. Some platforms calculate historical footprints from lower intrabar intervals and may recalculate older bars differently than real-time bars. That does not make the tool useless, but it means you should test your exact platform settings before trusting an alert or replay result.
Delta on Footprint Charts
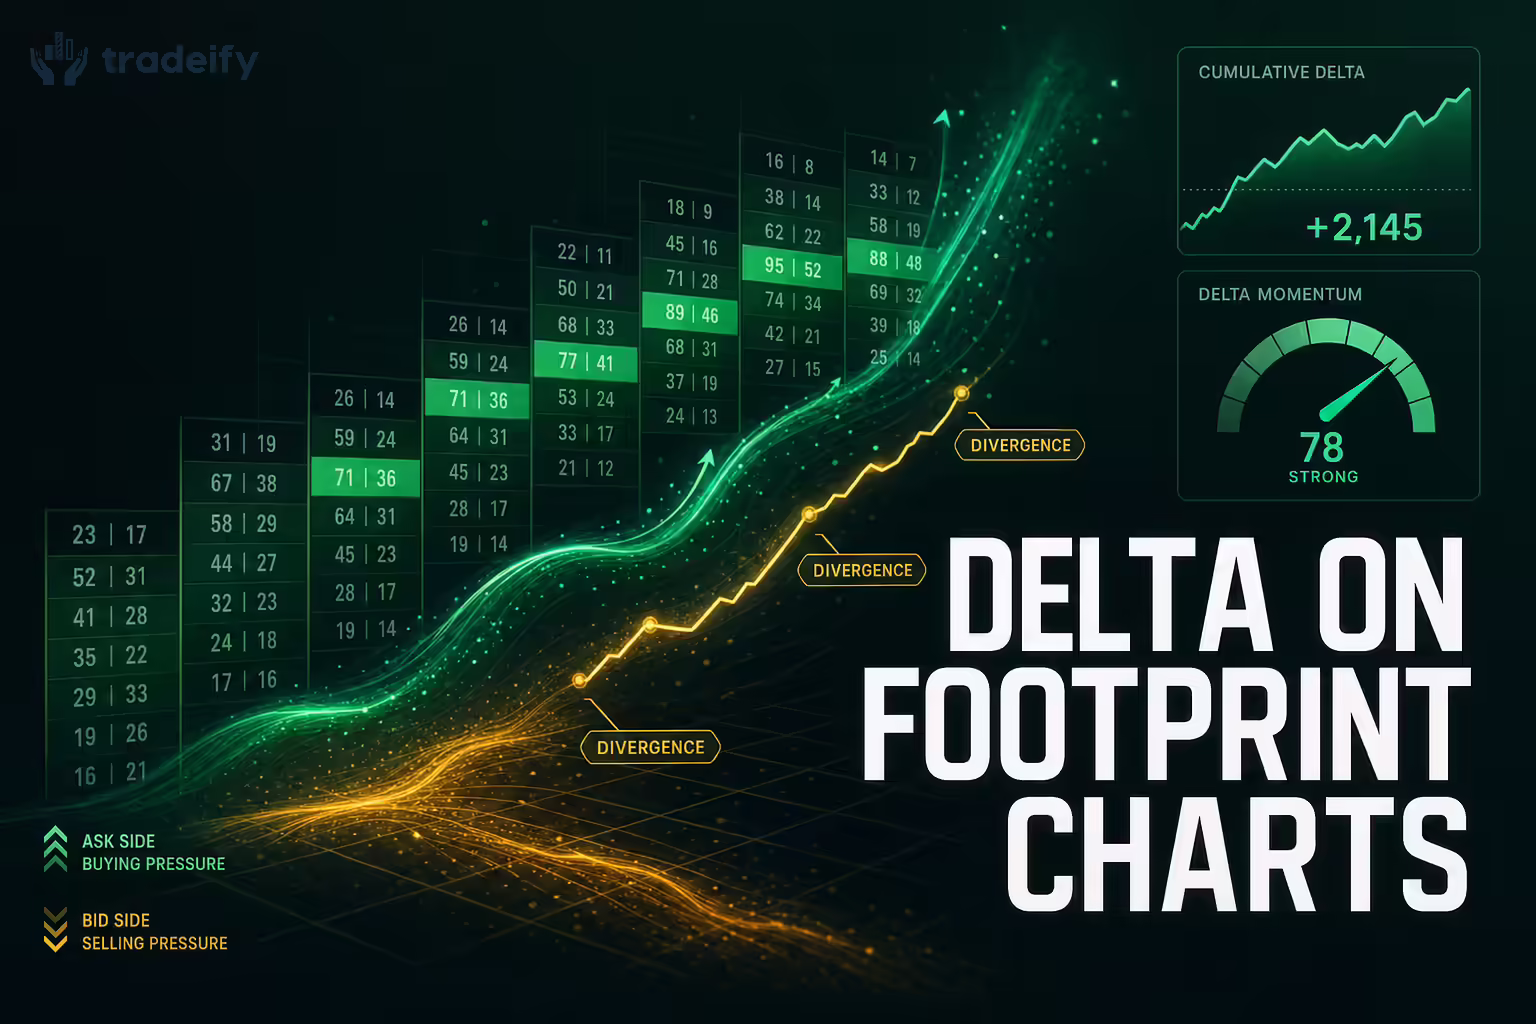
Of all the metrics derived from order flow analysis, Delta is arguably the most critical for intraday decision-making. Delta is the heartbeat of a footprint chart.
What Is Delta
Delta represents the net difference between aggressive buying volume and aggressive selling volume within a specific bar or at a specific price level. It is calculated as Ask Volume minus Bid Volume.
Positive Delta occurs when more trades are executed at the ask than at the bid. This indicates that buyers were the aggressors and were willing to cross the spread to initiate positions, signaling bullish momentum.
Negative Delta occurs when more trades are executed at the bid than at the ask. This indicates that sellers were the aggressors, striking the bids and driving downward pressure, signaling bearish momentum.
Delta Variations for Footprint Chart Trading
Traders use Delta in several different formats to analyze market context.
Price Level Delta is the delta at one specific price tick.
Bar Delta is the cumulative delta for an entire candlestick. If a 5-minute bar has 10,000 contracts traded on the ask and 8,000 on the bid, the Bar Delta is positive 2,000.
Cumulative Delta is a running total of the Bar Delta over a trading session or trend. By tracking Cumulative Delta, traders can gauge the overarching directional pressure of the day.
Delta Divergence on Footprint Charts
Delta divergence is one of the most powerful trading signals derived from footprint charts. It occurs when the structural price movement contradicts the underlying order flow momentum.
Bearish Divergence occurs when the price makes a new high, closing as a green candlestick, but the Bar Delta is significantly negative. This indicates that while the price moved up, aggressive sellers were actually stepping into the market and dumping inventory into the passive limit orders of retail buyers. It is a prime signal for a potential downside reversal.
Bullish Divergence occurs when the price makes a new low, closing as a red candlestick, but the Bar Delta is positive. This suggests that despite the downward price movement, aggressive buyers are absorbing the selling pressure, hinting at an upside reversal.
For a trader using a Tradeify funded account, spotting delta divergence at key structural support or resistance levels provides a high-probability entry setup with clearly defined risk parameters, which is essential for protecting the firm's capital.
Footprint Chart Imbalances and Stacked Imbalances
An imbalance occurs when one side of the market overwhelmingly dominates the other at a specific price level. Most professional order flow platforms define an imbalance as a ratio difference of 300% or 400% between the bid and ask volumes.
Because footprint charts are read diagonally, with the bid at one price level compared to the ask at the price level immediately above it, an imbalance highlights areas where aggressive market participants blew through passive liquidity without encountering meaningful resistance.
A Buying Imbalance occurs when ask volume is 400% higher than the diagonal bid volume. It signals severe buying aggression.
A Selling Imbalance occurs when bid volume is 300% or 400% higher than the diagonal ask volume. It signals severe selling aggression.
Stacked Imbalances on Footprint Charts
A single imbalance is informative, but Stacked Imbalances are highly actionable structural signals. A stacked imbalance occurs when three or more consecutive price levels display imbalances in the same direction within a single price bar.
When you see a lopsided imbalance stacked vertically across a price range, it indicates a significant influx of capital initiating a directional move. These stacked zones frequently become immediate support or resistance levels. If a massive bullish stacked imbalance prints while breaking a consolidation range, the bottom of that stacked imbalance serves as a logical location to place a stop-loss for a long trade. Should the price retrace to the stacked imbalance zone, it will likely find support, providing a lower-risk entry opportunity.
Point of Control on a Footprint Chart
The Point of Control represents the single price level within a given timeframe that experienced the highest volume of trading activity.
In footprint charts, the POC of an individual candlestick is visually highlighted, often with a bordered box or a distinct color. This adds another layer of insight by pinpointing exactly where liquidity was at its peak during that time interval.
During consolidation phases, prices often gravitate back toward the POC, reaffirming its role as a liquidity magnet.
If the price breaks away from the POC with strong supporting delta, it signals a high-probability breakout. The market has agreed on a new valuation away from the high-volume node.
Conversely, if the price moves away from the POC but the delta weakens or diverges, the breakout likely lacks staying power and is susceptible to a mean-reversion move back to the POC.
Understanding the POC allows day traders to identify the fair value of the asset within a specific timeframe. Trades placed near the POC are often choppy and unpredictable, while trades taken as the market decisively rejects a POC offer better risk-to-reward ratios.
Tools to Use with Footprint Charts
Footprint charts are most useful when paired with broader market context. The footprint tells you what happened inside the bar, but it does not decide whether the location is worth trading. Use the surrounding tools to define the level first, then use the footprint to judge execution quality.
Volume Profile shows where the market has accepted price over a session or range. Use the session POC, value area high, and value area low to identify decision zones. When price tests these levels, the footprint can show whether the breakout is being accepted through strong delta and stacked imbalances, or rejected through absorption and a move back toward the POC.
Cumulative Delta shows whether order flow aggression is building over multiple bars. If price pushes to a new high while cumulative delta stalls or falls, buyers may be losing control. If price makes a new low while cumulative delta improves, sellers may be running out of momentum.
VWAP gives intraday traders a benchmark for fair value and institutional execution. A footprint signal near VWAP often matters more than the same signal in the middle of nowhere. Watch for absorption when price pulls back to VWAP in a trend, or for dominant delta when price breaks through VWAP and holds on the other side.
DOM and Market Depth shows resting limit orders before they trade, while the footprint confirms what actually executed. DOM is useful for advanced traders, but beginners should treat it as a secondary tool. Resting liquidity can appear and disappear quickly. Executed volume on the footprint is harder to fake.
The practical sequence is simple: mark structure first, identify the volume profile levels, watch VWAP and cumulative delta for context, and then use the footprint for entry timing. Do not let the footprint replace the trading plan. Let it confirm or reject the plan.
Common Footprint Chart Patterns
Trading footprint charts involves pattern recognition, but unlike traditional chart patterns, footprint patterns are based on factual executed volume.
Footprint Chart Absorption
Absorption occurs when a massive amount of aggressive market orders are absorbed by a larger institutional player using passive limit orders. On a footprint chart, you will see massive volume on the bid at the bottom of a candle, yet the price refuses to drop further.
Imagine thousands of sell orders hitting the bid, printing a large negative delta at the low of the bar, but the market simply stalls. This indicates that a large participant has parked a massive limit buy order at that level, quietly absorbing all the selling pressure. Once the aggressive sellers run out of inventory, the market typically snaps in the opposite direction. Recognizing absorption is a core strategy for picking precise market reversals.
Footprint Chart Exhaustion
Exhaustion is the opposite of absorption. While absorption is characterized by high volume going nowhere, exhaustion is characterized by volume simply tapering off at the extremes of a move.
As an asset trends strongly in one direction, you may eventually see a footprint candle where the volume at the absolute high drops to single digits. This indicates that there are simply no more aggressive buyers willing to lift the offer at these higher prices. When volume exhausts after an extended move, it is a primary signal that the trend is running out of steam and a reversal or consolidation is imminent.
Finished and Unfinished Auctions on Footprint Charts
At the absolute top or bottom of a footprint candle, order flow traders look for finished or unfinished auctions.
A Finished Auction occurs when there is zero volume printed diagonally at the extreme of a candle. This signifies that the auction process at that price is complete and no one was willing to push it further.
An Unfinished Auction occurs when there is volume on both the bid and the ask at the extreme high or low of a candle. This implies that the market still had unfinished business at that level, and there is a high statistical probability that the price will return to that level in the near future.
Beginner Footprint Chart Trading Strategies
Amateur day traders preparing for a prop firm evaluation must prioritize high-probability, low-risk setups. Footprint charts provide an objective framework for achieving this.
Footprint Chart Absorption Reversal Strategy
Wait for the market to approach a known macro support level or previous day's low. Watch the footprint chart for a massive spike in bid volume accompanied by a large negative delta. Observe that the price stops moving down despite the heavy selling. Look for the candle to close higher than the absorption node, ideally with a shift to positive delta. Enter a long position with a stop-loss placed 1-2 ticks below the high-volume absorption node. If the institutional limit buyer steps away, the thesis is invalidated.
Footprint Chart Stacked Imbalance Breakout Strategy
Wait for the market to be in a tight consolidation range. Look for a footprint candle that breaks out of the range while printing a bullish stacked imbalance of 3 or more levels with 300% or higher ask volume. Confirm that the candle closes near its high with strong positive delta. Do not chase the candle. Wait for a subsequent candle to retrace into the upper levels of the stacked imbalance. Enter long upon the retest and place a stop-loss slightly below the bottom of the stacked imbalance zone.
Beginner Footprint Chart Mistakes to Avoid
Staring at the volume in every single footprint bar will lead to analysis paralysis and overtrading. Footprint charts should only be heavily scrutinized when the price approaches key structural levels such as support, resistance, VWAP, or the previous day's close.
Always check higher timeframe charts before trading lower timeframes. A bullish footprint setup in a macro downtrend has a high probability of failure.
Not every imbalance is a signal. Wait for confirmation via delta shifts and increasing overall volume. Markets can remain imbalanced for extended periods without reversing.
Footprint charts are most effective during high-volume sessions such as the New York open and the London overlap. Low-volume sessions often produce noisy footprints that lack the institutional participation necessary to provide clear signals.
Footprint Chart Practice Routine Before Live Trading
The fastest way to misuse footprint charts is to treat every imbalance as a trade signal. Before using them in a Tradeify evaluation or any funded account, build a deliberate replay routine.
Step 1: Replay one liquid futures session, such as the New York open in ES or NQ. Mark the prior day's high and low, overnight high and low, VWAP, and obvious support or resistance levels before looking at the footprint data.
Step 2: Choose one pattern for the session. Only study absorption at support, or only study stacked imbalances after a breakout, or only study delta divergence at a prior high or low. Do not try to master every footprint signal in one review.
Step 3: Pause before the outcome is obvious. When price reaches a key level, write down what the footprint is showing, what should happen next if your read is correct, where the trade would be invalidated, and where the stop would go.
Step 4: Review the result without changing the rules afterward. Track whether the signal appeared at a meaningful level, whether volume confirmed the idea, whether delta agreed or diverged, and whether the trade offered enough room to justify the risk.
For prop firm traders, the purpose of practice is not to find more trades. It is to reduce hesitation, avoid emotional entries, and prove that the same setup can be executed repeatedly with a predefined stop. That discipline matters more than any single footprint pattern.
Footprint Chart Trading in Tradeify Evaluations
The ultimate goal for most amateur day traders is to acquire substantial trading capital without risking their personal savings. Proprietary trading firms have emerged as the solution. However, passing a prop firm evaluation requires absolute discipline, stringent risk management, and the ability to avoid severe drawdowns.
This is precisely where footprint charts intersect with prop firm success. By using order flow to pinpoint entries with extreme accuracy, often down to the exact tick, traders can use tight stop-losses. This protects the account from unnecessary drawdown, keeping the trader safely within the firm's risk parameters.
Tradeify at tradeify.co is a U.S.-based proprietary trading firm focused exclusively on the futures market. Tradeify integrates with professional-grade platforms including Tradovate, NinjaTrader, and TradingView, offering access to major CME futures markets including ES, NQ, Crude Oil, Gold, and Bitcoin futures.
Tradeify is structured to accommodate various trading styles, offering account sizes ranging from $25,000 up to $150,000 across three plans: Growth, Select, and Lightning. Traders are permitted to manage up to 5 funded accounts simultaneously, allowing skilled operators to scale their simulated buying power up to $750,000.
Tradeify Funding Models for Footprint Chart Traders
Tradeify offers three distinct funding pathways: Growth, Select, and Lightning.
Tradeify Growth Evaluation Plan
The Growth plan is designed for traders who want a fast, straightforward path to funding.
Growth can be passed in as few as 1 trading day. There is no consistency rule during evaluation, so if you hit the profit target without breaking any rules on day one, you are eligible for funding immediately.
Growth accounts have no activation fee once passed.
Growth includes a soft-breach Daily Loss Limit, which simply pauses trading for the day rather than terminating the account. It also uses an End-of-Day trailing drawdown.
Once funded, a 35% consistency rule applies to payouts, meaning no single trading day can account for more than 35% of the total profits in your payout request.
Tradeify Select Evaluation Plan
Select is the optimal choice for traders who want maximum intraday flexibility and control over their payout structure once funded.
Select requires a minimum of 3 trading days to pass because it incorporates a 40% consistency rule during the evaluation phase.
Select has no Daily Loss Limit during evaluation, which is a meaningful advantage for traders who need room to hold through intraday volatility without being stopped out for the day.
After passing Select, traders choose between two payout paths: Select Daily, which allows daily payout requests with a smaller per-cycle cap, and Select Flex, which operates on a 5-day winning cycle with larger caps. The consistency rule does not apply once funded under either path.
Tradeify Lightning Plan
For experienced traders who want to skip the evaluation process entirely, Tradeify offers Lightning, a straight-to-sim-funded account.
Lightning accounts are one-time purchases with no evaluation. Traders get access to a sim funded account immediately and start working toward their payouts without passing an evaluation.
Lightning uses a progressive consistency rule: 20% on the first payout cycle, 25% on the second, and 30% on the third and beyond, for accounts purchased after September 12, 2025. No resets are available on Lightning accounts, so if the account fails a new one must be purchased.
Tradeify Account Tier Parameters
| Parameter | Tradeify $50K Growth | Tradeify $50K Select | Tradeify $50K Lightning |
| Profit Target | $3,000 (6%) | $3,000 (6%) | N/A (Already Funded) |
| Max Drawdown | $2,000 | $2,000 | $2,000 |
| Drawdown Type | End-of-Day (EOD) | End-of-Day (EOD) | End-of-Day (EOD) |
| Max Contracts | 4 Minis (40 Micros) | 4 Minis (40 Micros) | 4 Minis (40 Micros) |
| Daily Loss Limit | $1,250 (Soft Breach) | None during Eval | $1,250 (Soft Breach) |
| Minimum Days | 1 Day | 3 Days | 0 Days (Instant) |
End of Day Drawdown for Footprint Chart Traders
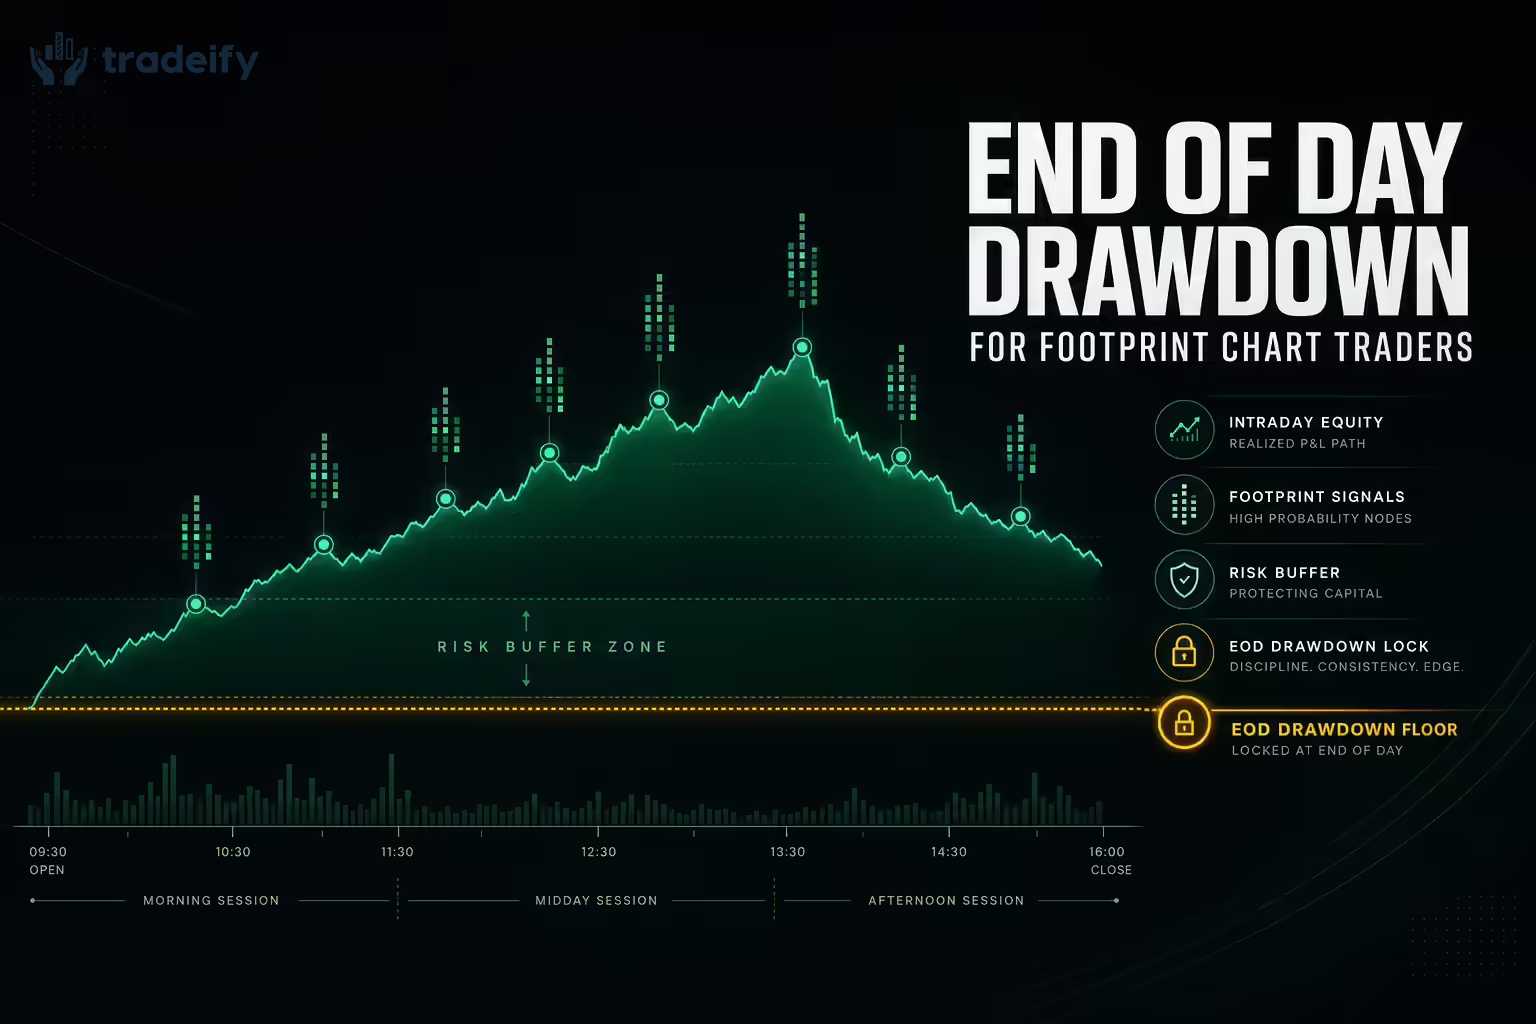
When comparing prop firms, the drawdown calculation method is the most critical factor a trader must evaluate. Tradeify implements an End-of-Day trailing drawdown across all its account types. This is widely considered the most trader-friendly drawdown structure available, especially for beginners.
Intraday Trailing Drawdown vs End of Day Trailing Drawdown
To appreciate the EOD advantage, you need to understand its alternative, the intraday trailing drawdown.
With an intraday trailing drawdown, the floor adjusts in real time based on the highest unrealized equity peak reached during an open trade. If you are up $1,000 in an open trade, the trailing drawdown floor moves up by $1,000 immediately. If the price retraces and you close the trade for a $200 profit, your account balance is higher, but your available drawdown buffer has permanently shrunk by $800. This system forces traders to scalp quickly and prevents them from letting winning trades run through normal market pullbacks.
Tradeify's End-of-Day trailing drawdown only calculates the drawdown limit based on the account's closing balance at the end of the trading session. Intraday equity peaks and unrealized profits do not trail the limit.
How Tradeify EOD Drawdown Works
Assume you purchase a $50,000 Tradeify Growth account with a $2,000 EOD trailing drawdown. Your failure threshold begins at $48,000.
Day 1: You take a long trade based on a footprint absorption signal. During the trade, your floating balance reaches $51,500. The market pulls back and you close the day with a balance of $51,000.
Because Tradeify uses EOD drawdown, your floor does not trail the $51,500 intraday peak. It trails the $51,000 end-of-day close. Your new drawdown floor is $49,000.
The EOD trailing drawdown only moves up, never down. Once your end-of-day balance exceeds your starting capital plus the drawdown amount plus $100, the drawdown limit locks in place and stops trailing entirely. For the $50,000 account, once your EOD balance hits $52,100, your floor locks permanently at $50,100. From that point on you have a fixed line in the sand, granting you significant psychological freedom to hold trades without worrying about the floor chasing your unrealized highs.
For footprint traders who catch large intraday trends using point-of-control breakouts, EOD drawdown is a substantial edge. It allows you to endure the normal ebb and flow of the market without the artificial anxiety of a constantly tightening real-time floor.
Tradeify Payout Rules for Footprint Chart Traders
Tradeify's payout infrastructure is straightforward and competitive across all account types.
Tradeify Profit Split on Sim Funded Accounts
All Sim Funded accounts, including Growth, Select, and Lightning, currently operate on a 90/10 profit split. You keep 90% of every payout you request.
Select accounts use the 90/10 split from the first payout regardless of which payout path you choose.
Tradeify Payout Frequency
Payout frequency depends on your account type and, for Select accounts, the payout path you selected.
Growth accounts follow a fixed payout schedule defined in the Growth payout policy.
Select Daily accounts allow daily payout requests once you meet the cycle profit and buffer requirements.
Select Flex accounts require 5 winning days in a payout cycle before a request can be made.
Lightning accounts allow payout requests once the profit target for each cycle is met.
Tradeify Consistency Rules for Withdrawals
To ensure traders are using structured strategies rather than relying on outlier days, Tradeify enforces consistency rules on withdrawals for Sim Funded accounts.
Growth funded accounts have a 35% consistency rule, meaning no single trading day can make up more than 35% of the total profit in a payout request.
Select funded accounts have no consistency rule once funded, regardless of which payout path is chosen.
Lightning funded accounts use a progressive consistency rule: 20% on the first cycle, 25% on the second, and 30% on the third and beyond, for accounts purchased after September 12, 2025.
Tradeify Elite Live Program
Tradeify's Elite Live program is how consistently performing traders can transition to trading with real firm capital on the CME exchange. Traders who demonstrate consistent profitability across their Sim Funded accounts may be selected for live transition by Tradeify's team.
Reaching payout milestones makes a trader eligible for consideration, but live transition is not automatic. Tradeify evaluates traders holistically with a focus on consistency, risk management, and overall trading behavior, and the team reaches out directly when a trader is selected.
Funded accounts that have received at least one payout are eligible to transition to Elite Live status. The Elite Live profit split is 80/20, with 80% going to the trader.
Elite Accelerator Reward Pools
Every Tradeify Elite Live account comes with a Performance Reward Pool attached to it, earned on top of your standard trading profits. Account holders earn from this pool monthly by meeting straightforward performance criteria.
The pool size is based on account size: up to $1,000 per $25K account, up to $2,000 per $50K account, up to $3,000 per $100K account, and up to $4,500 per $150K account. Select plan traders who transition to live are eligible for a 1.5x multiplier on their reward pool, which can bring the maximum to $6,750 on a $150K account.
Once the full pool for a given account is earned out, no further pool payments are available for that account. The program is designed to reward steady, disciplined trading rather than outsized risk-taking.
Putting Footprint Chart Strategy and Funding Together
How does an amateur day trader synthesize this information to secure meaningful funding and build a consistent trading income?
Start by mastering the footprint concepts outlined in this guide. Set up a platform like Tradovate or NinjaTrader, both accessible with a Tradeify account. Configure your footprint charts to clearly display bid/ask volume, color-coded deltas, and visual imbalances.
Select the right account type for your situation. Growth is the fastest path to funding and a good starting point for most traders. Select is better suited to traders who need intraday flexibility and want control over their payout structure. Lightning is designed for experienced traders who have already proven their edge and want to skip the evaluation entirely.
Deploy order flow tactics deliberately. Do not trade random support and resistance lines. Wait for the market to prove its intent. Use delta divergence to spot reversals. Look for stacked imbalances to confirm breakouts. Identify absorption at the lows and exhaustion at the highs. Wait for large traders to leave clear order-flow evidence before entering, and only trade when your risk is defined.
Manage risk intelligently. Use the footprint's Point of Control and imbalance nodes to place tight stop-losses. If your stop is tight, your risk is small, ensuring that you never approach the EOD trailing drawdown limit.
Focus on consistent wins to satisfy the consistency rules. Request your payouts, build a financial buffer, and scale up to the maximum 5 accounts over time.
Footprint Chart Trading FAQs
Do Footprint Charts Predict Price Direction
No. A footprint chart does not predict the future. It shows what actually traded at each price level inside a bar. The edge comes from using that order-flow evidence at important levels and then managing risk if the market does not confirm the idea.
Are Footprint Charts Good for Beginners
They can be useful for beginners, but only after the trader understands basic market structure, support and resistance, order types, and risk management. A beginner should start with one or two signals, such as absorption at support or delta divergence at resistance, rather than trying to interpret every number in every bar.
What Timeframe Works Best for Footprint Chart Trading
For intraday futures, many traders start with 1-minute to 5-minute footprint bars because they provide enough detail for execution without turning every tick into noise. Scalpers may go lower, while traders who want cleaner context may use 5-minute to 15-minute bars. The best setting is the one you can test, replay, and execute consistently.
Are Footprint Charts Better for Futures Than Forex or Stocks
Footprint charts are most reliable in centralized futures markets because exchange-reported trade data is standardized. Spot forex is decentralized, and equities can be fragmented across venues and dark pools, which can make bid/ask volume less complete. For futures products like ES, NQ, CL, GC, and CME crypto futures, the data is typically more actionable.
Do You Need Special Software to Use Footprint Charts
Yes, in most cases. Standard charting packages do not always include true footprint, cluster, or volumetric bars by default. NinjaTrader calls them Volumetric Bars inside Order Flow+, TradingView offers Volume Footprint charts on supported plans and symbols, and platforms like ATAS, Sierra Chart, Bookmap, and Jigsaw provide specialized order-flow tooling.
What Is the Difference Between Delta and Cumulative Delta
Delta measures the difference between ask volume and bid volume inside one bar or one price level. Cumulative delta adds those bar deltas over time, helping traders see whether longer-running buying or selling pressure confirms the current price move. A single bar delta helps with execution. Cumulative delta helps with broader confirmation or divergence.
Key Takeaways for Trading Footprint Charts
Basic price charts are the bones of the market. Footprint charts are the order-flow record. They dispel the mystery of why prices move, replacing guesswork with quantifiable data regarding bid and ask aggression, delta momentum, and institutional imbalances.
For the amateur day trader, crossing the threshold into consistent profitability requires two elements: a structured strategy and adequate capital. By mastering the footprint chart, you acquire the strategy. By partnering with Tradeify, with its End-of-Day drawdown protection, 90/10 profit split on Sim Funded accounts, transparent rules, and a path to live trading through the Elite Live program, you acquire the capital framework to grow. The tools are available. The path to securing up to $750,000 in simulated funding is in your hands. Study the footprints, manage your risk, and let the order flow guide your process.
.svg)
.svg)
.svg)
.webp)

