




TL;DR: Diamond pattern trading means waiting for a range that widens and then narrows to close outside its trendlines, then trading that side. Published stock data ranks diamond tops 3rd of 36 on downward breaks but last of 39 on upward ones. The exit direction matters more than the outline. Size from the stop, because the widest logical stop can cost more than the measured target pays.
A diamond pattern is a range that first gets wider and then gets narrower after a clear trend, so the trendlines drawn around it look like a diamond lying on the chart. Diamond pattern trading is the decision about what to do when that range finally breaks: which side, where the stop goes, how far the move might travel, and whether the shape is even real.
That last question matters more than most guides admit. The diamond is uncommon, it rarely looks tidy, and the published research behind it rests on far smaller samples than the head and shoulders or the double top. This guide treats it as a measurable setup with a confirmation close, a priced stop and a written bust rule, not as a shape you trade because it looks good.
What Is a Diamond Pattern in Trading
A diamond pattern in trading is a two-part price structure. The first part is a broadening formation, where peaks print higher and valleys print lower. The second part is a symmetrical triangle, where peaks print lower and valleys print higher. Connect the swing highs and lows with four trendlines and the outline resembles a diamond, usually tilted to one side.
Thomas Bulkowski, whose pattern studies are the most cited statistical source on the shape, lists it in two orientations. A diamond top forms after an advance, and a diamond bottom forms after a decline. The names describe where the pattern sits, not which way it has to break.
The diamond is also called a diamond formation, a diamond chart pattern, or a diamond reversal pattern. That last label comes from where it usually appears, at the end of a trend, but a diamond can also break in the same direction price entered and act as a pause. One commentator at tastylive describes a diamond top as a head and shoulders with a V-shaped neckline, which is a useful mental image as long as you remember the two are measured differently.
What the diamond does not do is predict on its own. Until price closes outside one of the trendlines, you have a range with an interesting shape. Spotting the shape early feels like an edge. It is not an entry. The trade starts with the close, not with the outline.
Related lesson: Rectangles and trading ranges
How a Diamond Pattern Forms
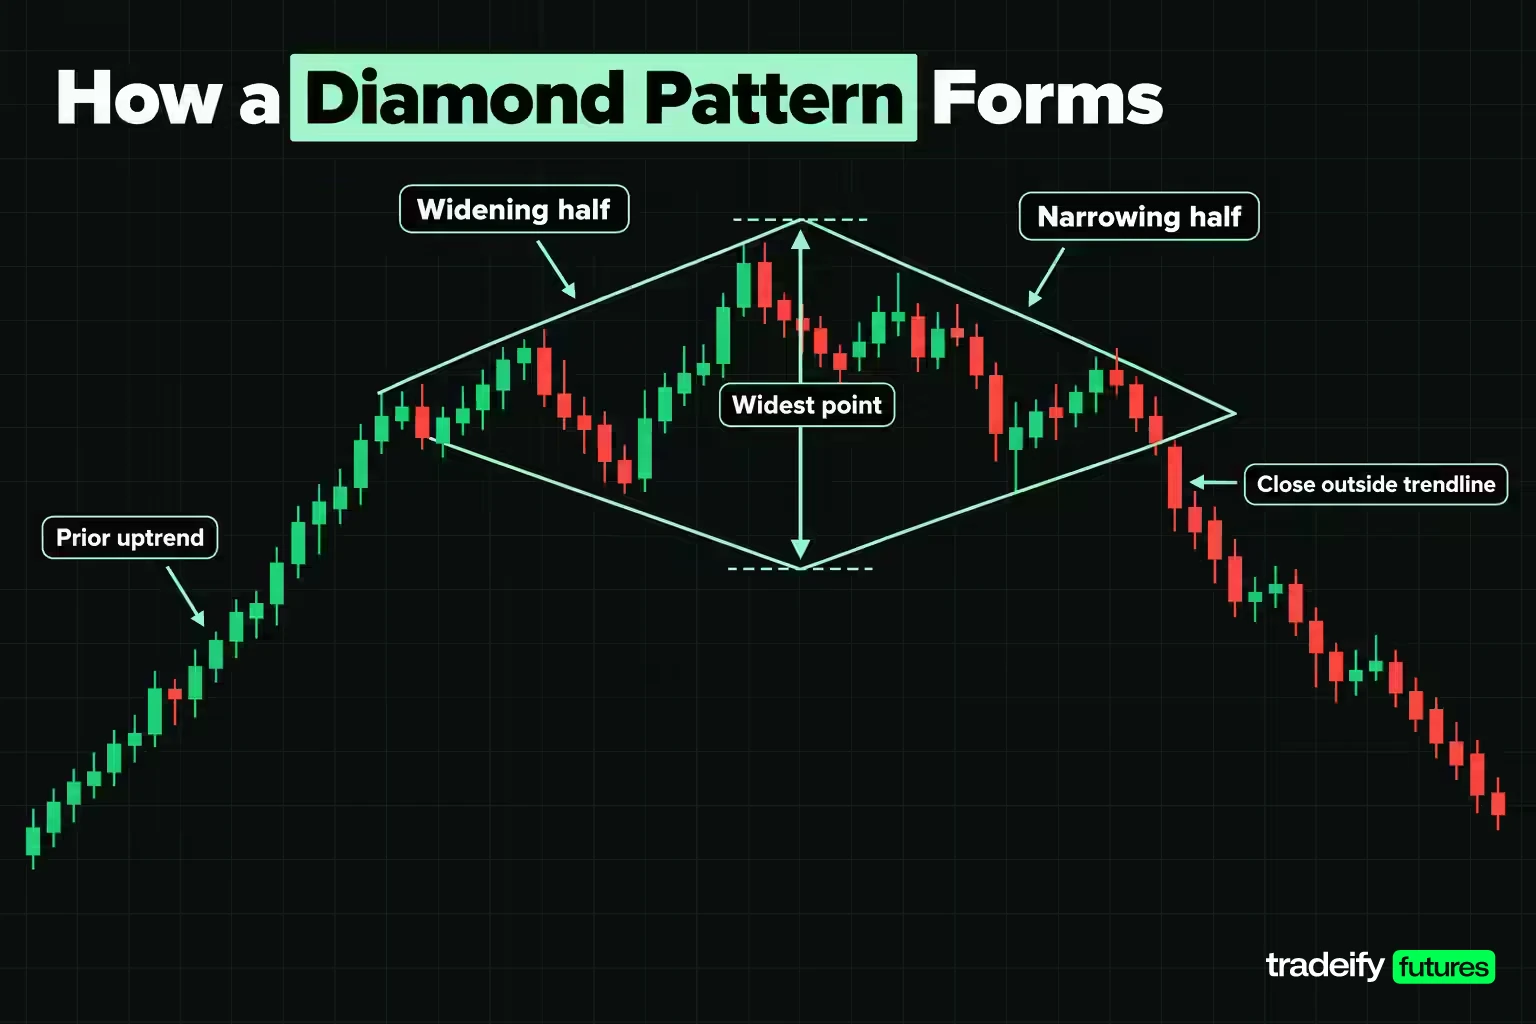
A diamond pattern forms in a fixed order, and each stage gives you different information. Reading the stages in sequence keeps you from labelling a shape too early.
| Diamond stage | What price does | What it tells you |
|---|---|---|
| Prior trend | A clear advance (top) or decline (bottom) leads in | The pattern has something to reverse |
| Widening half | Peaks print higher and valleys print lower | Both sides are still pressing, and each swing reaches further |
| Widest point | The last extending peak and valley | This high-to-low range is the height you measure |
| Narrowing half | Peaks print lower and valleys print higher | Neither side will extend, so the swings compress |
| Apex | The two right-hand trendlines converge | Geometry only, nothing has to happen there |
| Breakout | A close outside one of the right-hand trendlines | The pattern is confirmed in that direction |
Bulkowski's identification notes say price touches each trendline once or twice and that the lines can cut through a few price outliers. That is a warning as much as a guideline. A shape that only becomes a diamond after you ignore half the bars is probably a range you want to be a diamond.
The widening half is the part traders tend to skip. Without a real broadening phase, with at least one peak above the previous peak and one valley under the previous valley, what remains is a symmetrical triangle. Triangles are worth trading too, but their statistics and their measured moves are different.
The breakout rule is a close, not a touch. Bulkowski defines the diamond bottom breakout as price closing outside one of the trendline boundaries. A wick through the line during a fast bar is an observation. The close is the confirmation.
Related lesson: Triangles ascending, descending and symmetrical
Market Psychology of a Widening Then Narrowing Range
The market psychology behind a diamond is a fight that escalates and then runs out of fuel. In the widening half, both buyers and sellers keep pushing further. Each rally makes a new high and each sell-off makes a new low, which means stops are being run on both sides and late traders are getting pulled in at the extremes.
Then the escalation stops. In the narrowing half, buyers no longer get a new high and sellers no longer get a new low. Traders who chased the widest swings are now holding positions that cannot get back to their entries, and the range tightens while the market decides who gives up first.
That is why the trend into the pattern matters. Bulkowski puts it plainly: price must have something to reverse. A diamond after a long, fast run has a crowd of late buyers (in a top) or late sellers (in a bottom) who can be forced out. His notes on diamond tops add that when a quick, nearly vertical rise leads into a top that then breaks downward, price often falls back toward where that rise began.
The emotional trap for the trader watching is the same one the pattern is built from. Each widening swing looks like the start of a breakout, and chasing those swings is exactly the behaviour that feeds the compression. The calm read is that the widening half is information, not an entry. If you missed the last big swing, the next one is not a better price. It is a different trade, inside a range that is about to get smaller.
How to Identify a Diamond Pattern on a Chart
To identify a diamond pattern, test the swings in order rather than judging the outline by eye. Mark every swing high and swing low after the trend, then compare each new peak with the previous peak and each new valley with the previous valley.
- Widening is real when a peak prints above its predecessor and a valley prints under its predecessor.
- Narrowing has started when the signs flip, with a lower peak and a higher valley.
- The widest point is the turn between the two, and it should sit somewhere in the middle of the structure, not at the left edge.
- A breakout is a close outside one of the two right-hand trendlines.
Bulkowski's diamond bottom page is blunt about how hard this is. He writes that diamonds are as tough to spot as night crawlers in the grass on a summer night, and one of his examples notes that the trendlines rarely look like a diamond and often look more like a square tilted to the side. Expect messy versions.
Telling a Diamond From Similar Chart Patterns
Several patterns share parts of the diamond's shape, and the differences change how you would trade them.
| Pattern | How it differs from a diamond | Why the difference matters |
|---|---|---|
| Head and shoulders top | One higher peak between two lower ones, widest point at the head, a single neckline | The neckline is the trigger, and the target is measured from the head |
| Broadening formation | Keeps widening with no narrowing half | No compression, so no clean breakout line yet |
| Symmetrical triangle | Narrows from the start with no widening half | Height and measured move come from the triangle alone |
| Rectangle or range | Flat highs and flat lows | Horizontal boundaries, not sloped trendlines |
The head and shoulders comparison is the one that causes the most confusion. A diamond top often contains a higher middle peak, so it can be read either way. The tastylive piece makes a practical point here: a sloped lower trendline usually breaks earlier than a horizontal neckline, so the diamond reading can signal sooner. Sooner is not the same as more reliable, and an early signal on a misread shape is just an early loss.
Automated Diamond Pattern Detection
The swing test is mechanical enough that software can run it. Most automated scanners mark swing points with a fixed lookback (a bar whose high is the highest of the bars around it, for example), then check the sign of each change between consecutive peaks and consecutive valleys. A widening run followed by a narrowing run gets flagged as a candidate diamond.
The weak spot is the swing definition. A short lookback finds diamonds everywhere, and a long one misses the tilted, messy versions Bulkowski describes. Treat any scanner hit as a candidate to check by hand, not as a signal.
Related lesson: Head and shoulders patterns
Diamond Tops vs Diamond Bottoms
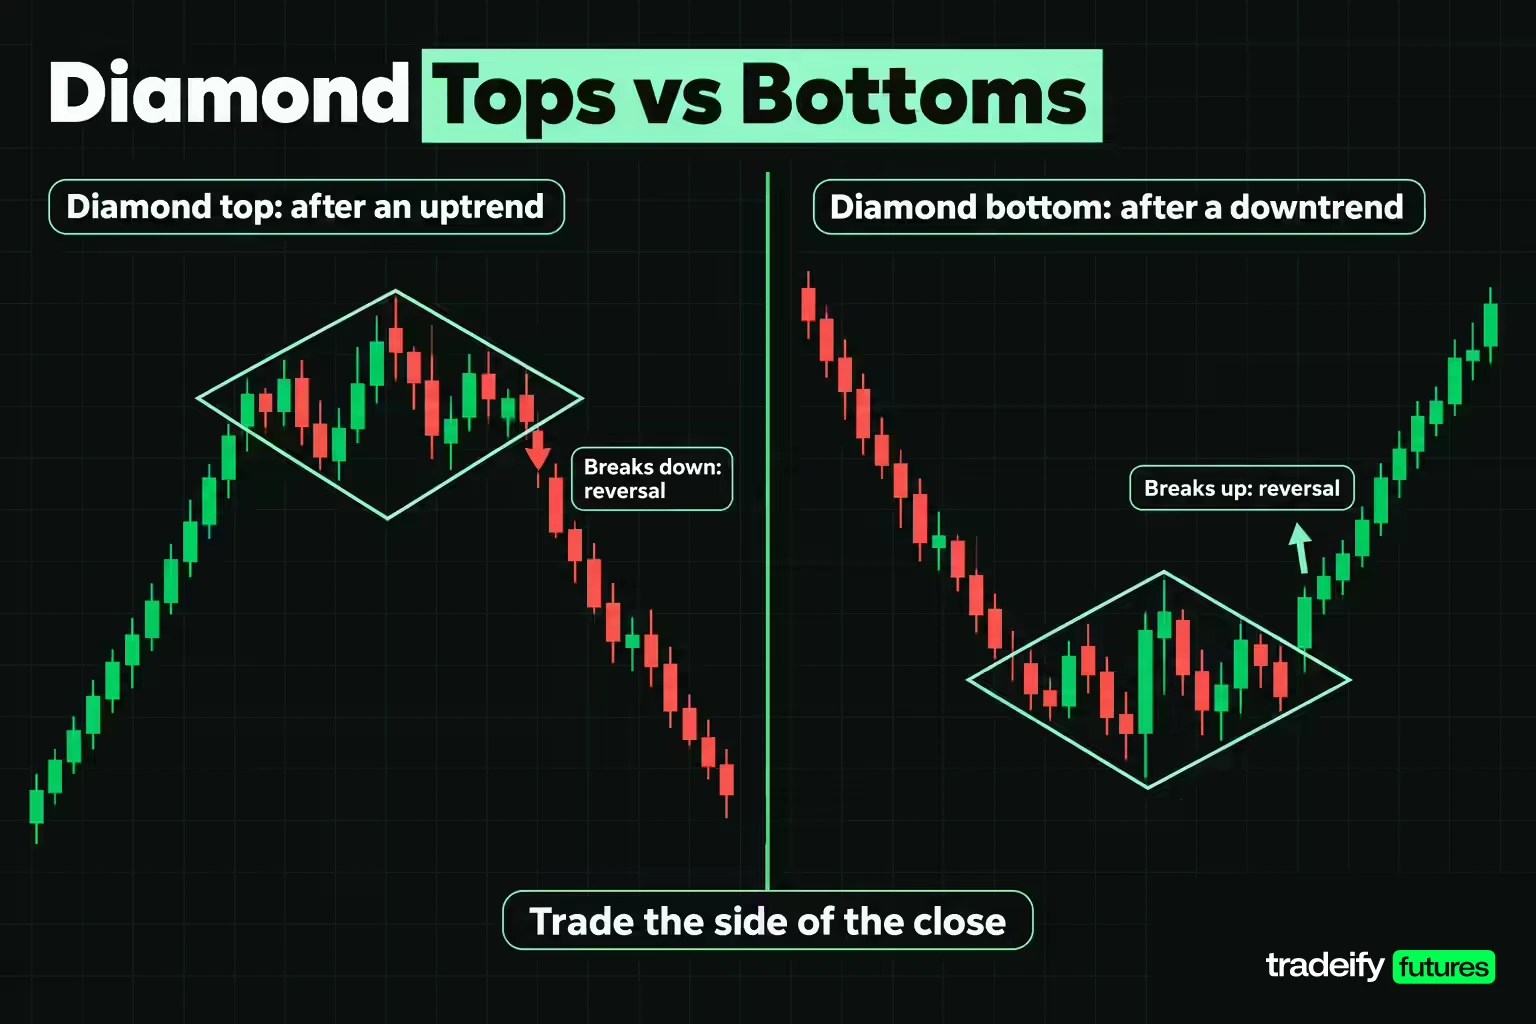
Diamond tops and diamond bottoms are the same geometry in mirror image. A diamond top follows an uptrend, and a diamond bottom follows a downtrend. Neither is bullish or bearish until it breaks.
The published breakout split shows why the label alone is not enough. In Bulkowski's bull-market samples, diamond tops break downward 54% of the time, which is barely better than a coin toss. Diamond bottoms break upward 74% of the time, a much stronger lean toward reversal.
Because the shape needs a trend in front of it but does not dictate the exit, the same outline can resolve four ways.
| Diamond variant | Trend into the diamond | Breakout side | What it implies |
|---|---|---|---|
| Bearish reversal (diamond top) | Up | Down | The advance is ending |
| Bullish continuation (diamond top) | Up | Up | The advance resumes after a pause |
| Bullish reversal (diamond bottom) | Down | Up | The decline is ending |
| Bearish continuation (diamond bottom) | Down | Down | The decline resumes after a pause |
The continuation cases behave differently. Bulkowski notes that when a diamond exits in the same direction price entered, it can act as a half-staff pattern, meaning roughly half of the overall move may still lie ahead. He also notes that the move after the breakout often falls short in that case, so he suggests looking for the resistance or support where price might stall rather than assuming a full projection.
The practical rule follows from the split. You can be sure a top is forming and still have no trade. Do not decide your bias from the name of the pattern. Decide it from the close.
How Reliable Is Diamond Pattern Trading
How reliable diamond pattern trading is depends heavily on which way the pattern breaks. Bulkowski's figures come from daily stock charts in bull markets, split by orientation and breakout direction.
| Diamond statistic | Diamond tops | Diamond bottoms |
|---|---|---|
| Performance rank, upward and downward breakouts | 39 (last) of 39 and 3 of 36 | 27 of 39 and 1 (best) of 36 |
| Break even failure rate, up and down | 21% and 15% | 13% and 15% |
| Average rise and decline | 29% and 17% | 39% and 19% |
| Throwback and pullback rate | 57% and 58% | 52% and 67% |
| Share meeting the price target, up and down | 65% and 63% | 73% and 55% |
| Breakout direction | Downward 54% of the time | Upward 74% of the time |
| Sample size | 733 perfect trades | 477 perfect trades |
Read Bulkowski's rank row first. A diamond top that breaks downward ranks 3rd of 36 downward-breakout patterns, while the same shape breaking upward ranks last of 39. The diamond bottom mirrors it, ranking 1st of 36 on downward breakouts. Direction carries more of the edge than the outline does.
The break even failure rate is routinely misread as a loss rate. Bulkowski's glossary defines it as the share of patterns that fail to move at least 5% after the breakout, which he describes as failing to cover the cost of trading. It says nothing directly about where your stop would have been hit.
How Often the Diamond Pattern Appears
The diamond is genuinely uncommon. The 733 diamond tops and 477 diamond bottoms in Bulkowski's study compare with more than 2,800 head and shoulders tops on his site. Smaller samples mean each figure moves more when new patterns are added, so the honest stance is interest rather than conviction.
There is a second caveat. These are daily stock charts with breakouts measured in percentages over weeks. Nothing in the study tests a diamond on a five-minute futures chart, and the transfer is an assumption you would need to check with your own data.
Common Diamond Pattern Mistakes
Most diamond losses come from a handful of repeat errors.
- Labelling the shape before the narrowing half exists, then trading a broadening formation as if it were a diamond.
- Trading the apex instead of waiting for a close outside a trendline.
- Assuming a diamond top must break down, when Bulkowski's published split is only 54% downward.
- Projecting the full height as the target instead of a hit-rate-adjusted target.
- Placing the stop inside the compression, where ordinary noise reaches it.
- Taking a trade on a diamond with no meaningful trend in front of it.
Related lesson: Backtesting a trading strategy
Volume and Indicators With a Diamond Pattern
Volume with a diamond pattern is a weaker filter than most guides suggest. Bulkowski's samples show volume trending downward inside the pattern 55% to 59% of the time on diamond tops and 67% of the time on diamond bottoms. A falling trend is typical, but plenty of valid diamonds do not show it.
The published guidance also points in different directions. The tastylive article says volume on diamond tops usually rises a lot during formation because of the back-and-forth churn. Bulkowski's top page says a rising volume trend gives the best results on upward breakouts, while his bottom page says a falling volume trend gives the best results on upward breakouts. When sources disagree like that, volume is context, not a rule.
What volume can do is grade the break. A breakout close on noticeably heavier volume than the narrowing half shows participation. A breakout on thin volume is the version more likely to pull back to the trendline, and Bulkowski's 58% pullback rate for diamond tops with downward breaks says that pullback is common anyway.
Combining a Diamond Pattern With Other Indicators
Indicators are most useful when they answer a specific question the diamond cannot. Three combinations do that.
- Momentum divergence. If price makes the widest high of a diamond top while an oscillator such as RSI makes a lower high, the push into the widest point had less force behind it. That supports a downward break but does not replace the close.
- Higher-timeframe location. Bulkowski found diamond tops performed best with breakouts in the lowest third of the yearly range, and suggests avoiding diamond bottoms whose breakouts sit near the yearly high. On intraday charts, the equivalent check is where the diamond sits against the prior day's range or a major level.
- Trend strength into the pattern. A diamond after a steep, fast leg has more to reverse than one after a slow drift.
Adding a fourth or fifth filter rarely helps. A filter should remove a failure you have actually seen in your own trades. If the diamond is clean and the break closes with participation, more indicators mostly give you reasons to hesitate.
Related lesson: Relative strength index RSI
Diamond Pattern Trading Strategies and Entry Methods
Trading diamond patterns works best when every decision is written down before the break. The compression phase is designed to make you act early, so the plan has to exist before the pressure does.
There are four common approaches.
- Breakout close. Enter after a bar closes outside a right-hand trendline. This is the most conservative entry because the confirmation is complete, but the stop is usually further away.
- Pullback entry. Wait for price to return toward the broken trendline or the breakout price, then enter with a stop beyond the nearest swing. The risk is smaller, but the pullback may never come.
- Aggressive entry inside the shape. Sell near the upper line or buy near the lower line of the narrowing half, before any breakout. The stop is small, but you are trading a range, not a confirmed diamond.
- Busted-pattern trade. If the breakout fails and price closes beyond the opposite side, trade the new direction.
The busted case deserves its own rule. Bulkowski defines a busted pattern as one where price breaks out, moves no more than 10%, then reverses and closes on the opposite side, which for a downward breakout means a close above the top of the pattern. His research on triple tops found single busts 19% of the time and double and triple busts about 1% each. Those figures are not diamond-specific, so treat them as a yardstick and your own journal as the evidence.
The sequence that keeps a diamond trade honest:
- Confirm the trend into the shape.
- Confirm both halves, widening first and narrowing second.
- Measure the height from the highest peak to the lowest valley.
- Write the breakout level as a closing price, not a wick.
- Choose the stop and price it in dollars.
- Size the position from the stop.
- Write the bust rule and the exit you will take if it triggers.
Related lesson: Breakout trading
Diamond Pattern Entry and Exit Points
Diamond pattern entry and exit points are easiest to see on one priced example. The levels here are illustrative round numbers on the E-mini S&P 500 (ES), where one point is $50 and the minimum tick is 0.25 points, or $12.50. The Micro E-mini S&P 500 (MES) uses the same price scale at $5 per point and $1.25 per tick.
The illustrative diamond top forms after an advance. The swings print in this order:
- Peak 6,020.00, valley 5,990.00, then peak 6,030.00 and valley 5,960.00. Peaks rising and valleys falling, so the widening half is real.
- Peak 6,040.00 and valley 5,940.00. This is the widest point, and the height is 100.00 points.
- Peak 6,020.00, valley 5,965.00 and peak 6,005.00. Lower peaks and a higher valley, so the narrowing half is real.
Entry Points on the Illustrative Diamond Top
The entry points on this illustrative ES diamond top, with its 100.00-point height between 6,040.00 and 5,940.00:
- Breakout entry at 5,975.00, on a bar that closes under the rising lower trendline of the narrowing half.
- Pullback entry at 5,985.00, if price returns toward the broken trendline after the breakout. In Bulkowski's sample, diamond tops with downward breakouts pull back 58% of the time, so this entry is available often but not reliably.
Exit Points on the Illustrative Diamond Top
The exit points on the same illustrative diamond top are decided at the same moment as the entry:
- Target exit at the measured target (5,912.00 in this example, from the hit-rate-adjusted measure rule).
- Stop exit at the price that proves the reading wrong, one tick beyond a chosen swing high.
- Bust exit if price closes back above the top of the diamond at 6,040.00, which by Bulkowski's definition busts the downward breakout.
- Session or time exit, if your trading hours end before any of the other three exits triggers.
Here is where traders usually get caught. They plan the pullback entry, the pullback never comes, and they chase the move at a worse price with the original stop. The breakout entry and the pullback entry are not better or worse in general. The breakout entry never misses the move but pays for the full distance to the stop. The pullback entry gets a smaller stop but sits out every breakout that never returns.
Diamond Pattern Profit Targets
Diamond pattern profit targets start from the height of the shape. The common version projects the full height from the breakout. The tastylive article gives the simple case: a diamond spanning $60 to $70 that breaks down at $65 targets $55.
Bulkowski's measure rule scales that projection by the share of patterns that historically reached it. Measure from the highest peak to the lowest valley, multiply by the percentage meeting the price target for that orientation and breakout direction, then subtract it from the breakout price for a downward break or add it for an upward one.
Applied to an illustrative ES diamond top with a 100.00-point height and a breakout close at 5,975.00, using Bulkowski's 63% target figure for diamond tops with downward breakouts:
| Diamond target method | Calculation | Target price | Distance from 5,975.00 entry |
|---|---|---|---|
| Full height | 5,975.00 minus 100.00 | 5,875.00 | 100.00 points |
| Hit-rate adjusted (63%) | 5,975.00 minus 63.00 | 5,912.00 | 63.00 points |
The two targets sit 37.00 points apart. On one ES contract that is $1,850, which is the difference between a plan built on the average outcome and one built on the best case.
Two other target ideas come from the same research:
- Launch price. After a quick, nearly vertical run into the diamond, Bulkowski notes price often returns toward where that run began. That level is a useful second target or a place to expect support.
- Half staff. If the diamond acts as a continuation, the move after the breakout often falls short, so a nearer target at the first obvious resistance or support is more realistic.
Whichever target you use, write it down before the trade. Moving it further away once price starts moving your way turns a plan into a hope.
Stop-Loss Placement for a Diamond Pattern
Stop-loss placement for a diamond pattern is where most of the arithmetic is decided. On the illustrative ES diamond top, the breakout entry is 5,975.00 and the hit-rate-adjusted target is 5,912.00, a 63.00-point reward. Three stops are defensible, each one tick above a swing high.
| Diamond stop placement | Stop price | Risk in points and ticks | Risk per ES | Risk per MES | Reward to risk | Breakeven win rate |
|---|---|---|---|---|---|---|
| Above the last lower high | 6,005.25 | 30.25 points, 121 ticks | $1,512.50 | $151.25 | 2.08 to 1 | 32.4% |
| Above the right-side peak | 6,020.25 | 45.25 points, 181 ticks | $2,262.50 | $226.25 | 1.39 to 1 | 41.8% |
| Above the widest peak | 6,040.25 | 65.25 points, 261 ticks | $3,262.50 | $326.25 | 0.97 to 1 | about 51% |
The tight stop gives the best ratio and the highest chance of being hit by ordinary noise, because 30.25 points sits well inside a structure that swung 100.00 points. The widest stop matches the pattern's own logic, since a close above 6,040.00 busts the diamond, but it pays less than it risks against the adjusted target.
Pullback Entry and Slippage on the Diamond Stop
A pullback entry changes the diamond stop arithmetic. On the illustrative ES diamond top, entering at 5,985.00 with the stop at 6,005.25 risks 20.25 points (81 ticks, $1,012.50 per ES or $101.25 per MES) against 73.00 points of reward to the 5,912.00 target, which is 3.60 to 1 with a breakeven win rate of 21.7%. That better ratio is the reward for waiting, and the cost is every trade where the pullback never arrives.
Execution cost moves the numbers a little. On the breakout entry at 5,975.00 with a 5,912.00 target, one tick of slippage on the entry and one on the stop turn the 6,005.25 stop into 30.75 points of risk against 62.75 points of reward, 2.04 to 1, with a 32.9% breakeven rate. A stop order does not guarantee the fill price, and fast markets can slip further than one tick.
Related lesson: Stop-loss orders and placement
Risk Management for Diamond Pattern Trades
Risk management for diamond pattern trades starts with sizing from the stop, not from the target or from how confident the shape looks. A wide stop is not a smaller opportunity. It is a larger risk per contract, and the response is a smaller contract or a skipped trade.
Take an illustrative ES diamond top with a breakout entry at 5,975.00, a pullback entry at 5,985.00, and swing highs at 6,005.00, 6,020.00 and 6,040.00, with each stop one tick beyond its swing. With an illustrative $500 risk budget, the contract counts look like this:
| Diamond entry and stop | Risk per ES | ES contracts within $500 | Risk per MES | MES contracts within $500 |
|---|---|---|---|---|
| Breakout entry, stop above the last lower high | $1,512.50 | 0 | $151.25 | 3 |
| Breakout entry, stop above the right-side peak | $2,262.50 | 0 | $226.25 | 2 |
| Breakout entry, stop above the widest peak | $3,262.50 | 0 | $326.25 | 1 |
| Pullback entry, stop above the last lower high | $1,012.50 | 0 | $101.25 | 4 |
No ES contract fits inside $500 at any of these stops, while MES fits one to four contracts depending on the stop. One ES equals ten MES by contract size, so the micro is the natural tool when a pattern's logic demands a wide stop.
A few management rules follow from the published behaviour:
- Decide in advance whether you exit on the target or take part off there, and write it down.
- If price pulls back to the breakout level, which happens often, do not widen the stop to stay in.
- If the diamond busts, follow the bust rule you wrote before entry rather than improvising.
- Keep total open risk within a fixed cap. Informal heuristics such as the 3-5-7 rule set limits per trade and across open positions, and the exact numbers matter less than having them before the trade.
Related lesson: Position sizing
Real Diamond Pattern Examples From Published Charts
Real diamond pattern examples are most useful when they show the messy versions. Bulkowski's pages, updated with ten new examples each on 7/31/25, include several that teach more than a textbook drawing.
- A diamond top that broke downward but did not last. Price pulled back, closed above the top of the diamond and busted the pattern. The rise that followed was also short, and price then plunged to near the launch price where the original advance began.
- A diamond top that broke upward, dropped back to bust that breakout, then recovered to bust the downward move as well. That is a double bust, and it is the reason a written bust rule matters.
- A diamond bottom pushed to one side, where two outlier bars hide the diamond shape. After the breakout, price climbed back toward the launch point but fell just short, which Bulkowski calls typical behaviour to plan for.
- A diamond bottom whose trendlines look more like a square tilted to the side than a diamond, which is closer to what you will usually see on a live chart.
Diamonds also appear in market commentary on long-term charts. A tastylive opinion piece described the Russell 2000 priced in gold as forming something more akin to a diamond pattern and used it to argue that an equity sell-off was not over. The same article warns that sloppily formed diamonds usually are not worth attention. Read examples like that as one analyst's interpretation, not as a confirmed pattern with a measured outcome.
The common thread across these examples is that the confirmation and the bust rule did more work than the outline. Every example that turned against the first breakout still gave a clear signal, a close beyond the opposite side of the diamond.
Trading Diamond Patterns on Intraday Futures Charts
A diamond on an intraday futures chart has the same geometry as one on a daily stock chart, but the research does not carry over automatically. Bulkowski's numbers come from daily stock charts, with trends into the pattern measured in months and moves measured in percentages. An intraday ES diamond that forms over two hours is a different object statistically, even if it looks the same.
Three adjustments make intraday diamonds more workable:
- Require a clear intraday trend into the shape, such as a run from the open, so the pattern has something to reverse.
- Check that the height is large enough to pay for the trade. On a 10-point diamond, a two-tick round trip of slippage is 5% of the height.
- Note the time. A diamond that completes late in the session may not have time to reach its target before you need to be flat.
On our accounts, every position is closed by 4:45 PM ET and there are no overnight, weekend or swing holds, so a diamond that needs days to resolve on a daily chart does not fit; only intraday diamonds do. Position size is capped by contract limits too, with a 50K account allowing up to 4 minis or 40 micros (10 micros count as one mini), and our funded accounts are simulated.
Related lesson: Tick size and tick value
Diamond Pattern FAQ
What is that diamond pattern called?
It is usually called a diamond top when it forms after an advance and a diamond bottom when it forms after a decline. You will also see diamond formation, diamond chart pattern and diamond reversal pattern. All of them describe a broadening formation followed by a symmetrical triangle.
What is diamond formation?
Diamond formation is the process of a range first widening, with higher peaks and lower valleys, and then narrowing, with lower peaks and higher valleys. The trendlines around those swings form a diamond outline. The formation is complete only when price closes outside one of the right-hand trendlines.
Is a diamond pattern bullish or bearish?
Neither until it breaks. In Bulkowski's stock samples, diamond tops break downward 54% of the time and diamond bottoms break upward 74% of the time. Trade the side price closes on, not the name of the pattern.
Do diamonds trade on the stock market?
Yes, diamond patterns appear on stock charts, and the best-known statistics on them come from daily stock data. The pattern has nothing to do with the gemstone. The same chart shape can also appear on futures, forex or any market with a price chart.
What is the 3-5-7 rule in trading?
The 3-5-7 rule in trading is an informal heuristic that caps risk at 3% of capital per trade and 5% across all open positions, and aims for winners at least 7% larger than losers. It is not an exchange or regulatory rule. Many traders use lower per-trade limits, so treat it as one example of writing risk limits down.
How rare is the diamond pattern?
It is uncommon. Bulkowski's study set holds 733 diamond tops and 477 diamond bottoms, against more than 2,800 head and shoulders tops on the same site. Rarity is a reason to check each candidate carefully, not a reason to trust it more.
Diamond Pattern Trading Risk Note
This diamond pattern guide is education, not investment advice or a recommendation to trade any instrument. Futures are leveraged, losses can be larger than you expect, and a stop order does not guarantee your exit price in a fast market. Every price, risk budget and position size here is illustrative, not a record of a real trade or a promise of any result. Published pattern statistics come from daily stock charts and may not carry over to intraday futures. Simulated and funded account results are simulated and do not reflect live trading conditions.


