



TL;DR: Grid trading rests buy and sell orders at fixed price steps and earns the step each time price crosses back. The real decision is how deep a ladder you can hold if price keeps going. A 10-level micro ladder at 10 points holds $2,250 of open loss at its last fill but earns $500 on ten cycles. Size the grid from that loss, use it in ranges, and set a stop past the last level before the first fill.
Grid trading is a rule-based method that turns a price range into a ladder of resting orders. You pick a step size, rest buy orders at each step under the market, and pair every filled buy with a sell one step higher. Every time price drops to a level and comes back, the grid books one step of profit.
The part most explanations skip is what the ladder holds while it waits. A grid buys more as price falls, so the position is biggest exactly when the market is moving hardest against you. That is the moment the plan gets tested, and it is usually the moment traders start improvising.
This guide works through that trade-off with contract math on Micro E-mini S&P 500 futures, a measured two-year look at how far E-mini sessions really move, and the rules that decide whether a grid is a strategy or just a long position nobody planned.
What Grid Trading Is and How the Orders Work
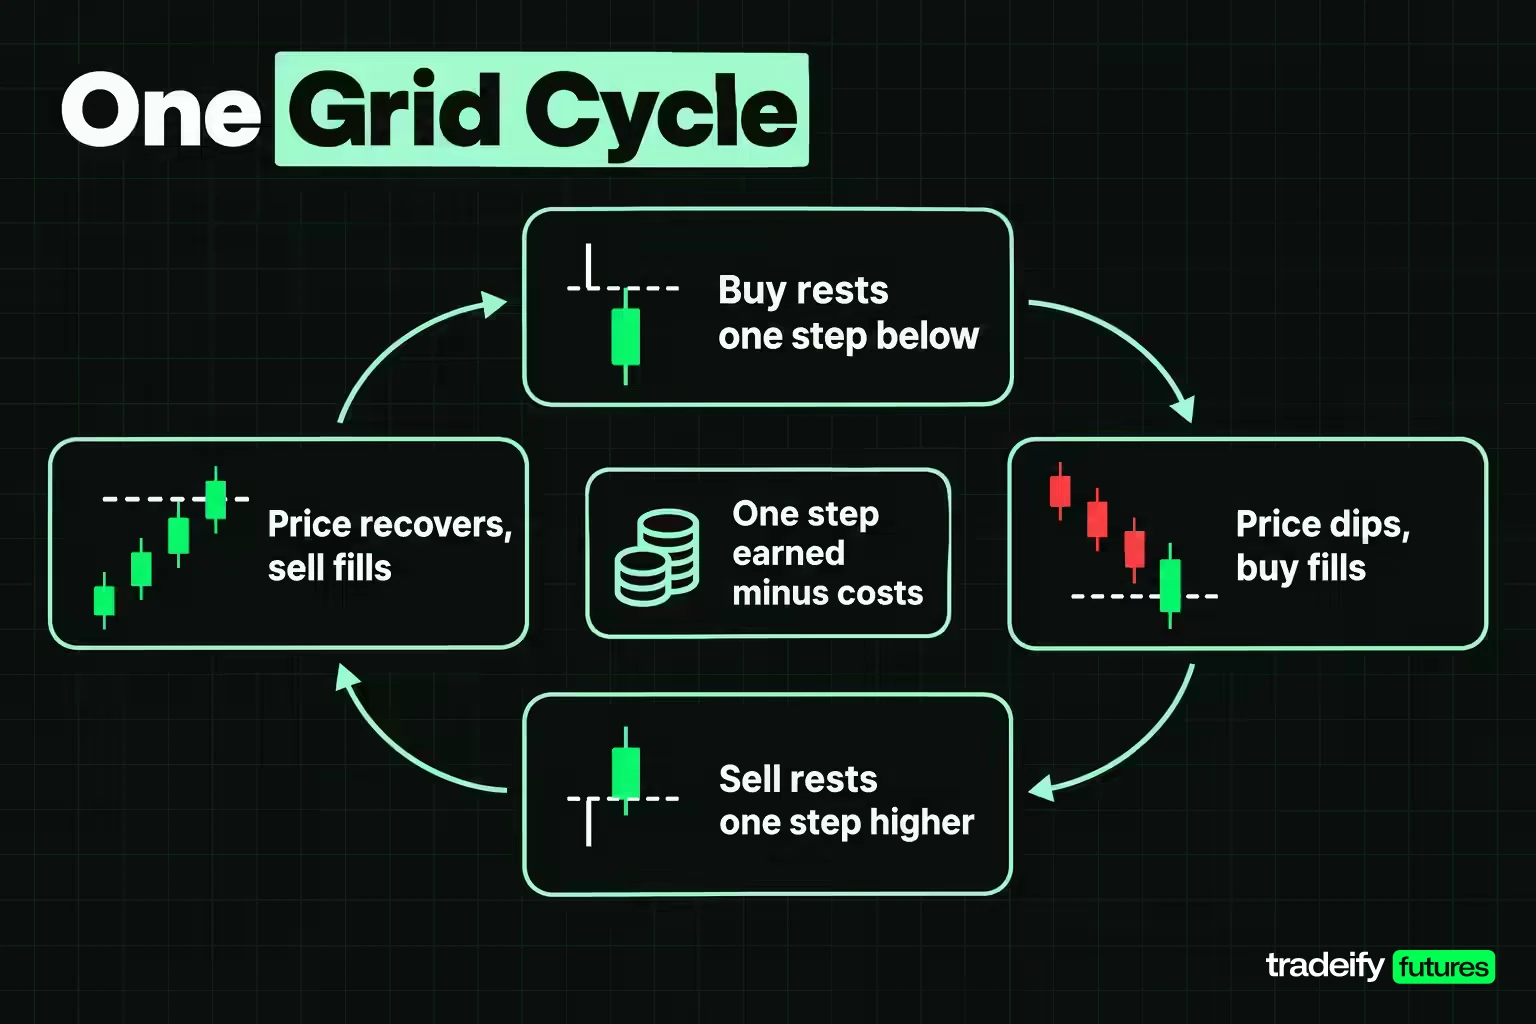
Grid trading places limit orders at evenly spaced prices inside a chosen range. A long grid, the most common version, rests buy orders at each level under the current price. When a buy fills, a sell order goes in one level higher. If price comes back up to that level, the pair closes and the grid books the step as a completed cycle, then re-arms the buy.
Here is one cycle in plain terms, at illustrative prices. Price sits at 7,000 and the step is 10 points. A buy rests at 6,990. Price dips, the buy fills, and a sell rests at 7,000. Price recovers to 7,000, the sell fills, and the grid has earned 10 points minus costs. Nothing in that sequence required a forecast of where price was going next. It required price to go down a step and come back.
That is the appeal, and it is also where the risk hides. A grid is not direction-free. It holds a specific view: price will keep crossing back and forth through the ladder, or at least come back far enough to close the positions it built on the way down.
Every grid hides three decisions:
- Spacing. How far apart the levels are, which sets how much each cycle earns and how often cycles complete.
- Depth. How many levels you will fill, which sets the largest position the grid can hold.
- The exit. What happens when price leaves the range and keeps going.
Grid orders are limit orders, so they fill only at their price or better, and a resting order is only certain to fill when price trades through it. A level that price merely touches may not fill, which matters when you test a grid on historical bars.
Related lesson: Range trading
Grid Trading Types and Variants
Grid trading comes in a few distinct shapes, and the differences decide how much risk a grid can build.
Spot Grids Versus Leveraged Grids
Spot grids versus leveraged grids. A spot grid buys and sells the asset itself, usually a crypto pair on an exchange bot. The worst case is holding coins bought on the way down that are now worth less. A leveraged grid runs on futures or perpetual contracts, where each level adds contract exposure funded by margin. The worst case there is forced liquidation, and perpetual contracts also charge or pay funding at regular intervals, so a position that sits open for days carries a running cost or credit.
Directional Grid Variants
Long, short and neutral grids. A long grid buys as price falls and sells into rebounds, so it accumulates long inventory in a downtrend. A short grid does the mirror image and accumulates short inventory in a rally. A neutral grid starts in the middle of its range with orders on both sides, which means it can end up holding inventory in either direction depending on where price escapes.
Against-the-trend versus with-the-trend grids. The classic grid trades against short moves: buy weakness, sell strength. A with-the-trend grid does the opposite, adding to a position as price moves in its favor, much like a breakout trader scaling in. With-the-trend grids lose small amounts repeatedly in chop and earn in trends, which is the reverse profile of the classic version.
Fixed versus re-anchored grids. A fixed grid keeps its levels where they were set. Once price trends away from the range, a fixed grid stops cycling and just holds whatever it filled. A re-anchored grid recenters on a new price, often each session or after a set move. Re-anchoring keeps the grid working around the current price, but it also locks in the inventory left at the old levels, so it is a risk decision, not a free improvement.
| Grid type | What it accumulates | Main failure mode |
|---|---|---|
| Long spot grid | The asset, bought on the way down | Holding the asset through a long decline |
| Leveraged long grid | Long contracts on margin | Liquidation or a margin call in a sharp drop |
| Short grid | Short exposure into rallies | Losses that keep growing in a strong uptrend |
| Neutral grid | Inventory on whichever side price escapes | Being caught on the wrong side of a breakout |
| With-the-trend grid | A position that grows with the move | Repeated small losses in chop |
Grid Spacing, Range Bounds and Level Count
Grid parameters come down to four inputs: the lower bound, the upper bound, the number of grids, and how the space between them is divided. Exchange grid bots typically ask for exactly these, plus an investment amount.
Upper and lower bounds. The bounds define where the grid works. On common exchange bots, orders stop executing once price leaves the range, so a price that falls under the lower bound leaves you holding every level that filled, with no new orders working.
Number of grids. More grids inside the same range means smaller steps, more frequent cycles and less profit per cycle. It also means more filled positions for the same price move, which is why bot documentation notes that more grids need more funds.
Arithmetic Versus Geometric Grid Spacing
Grid spacing comes in two common modes. Arithmetic spacing divides the range into equal price steps: (upper bound minus lower bound) divided by the number of grids. Geometric spacing divides it into equal percentage steps, so each level is the previous one multiplied by the same ratio.
Take an illustrative range of 6,500 to 7,500 with 10 grids. Arithmetic spacing makes every step 100 points. Geometric spacing uses a ratio of about 1.0144, roughly 1.44% per level, so the lowest step runs from 6,500 to 6,593.68 (93.68 points) and the highest step runs from 7,393.44 to 7,500 (106.56 points). On one Micro E-mini S&P 500 contract, worth $5 per index point, that is $468.40 per cycle at the bottom of the range and $532.80 at the top.
The difference barely shows in a narrow range. It matters in wide ranges, where an arithmetic grid's percentage return per cycle shrinks as price rises, while a geometric grid keeps each cycle's percentage roughly constant.
Grid Spacing Against Trading Costs
The spacing must pay for the round trip. Each completed cycle costs one buy and one sell in commissions and fees, and possibly some slippage. The tighter the grid, the larger the share of each cycle those costs take.
The table uses Micro E-mini S&P 500 (MES) at $5 per point and an illustrative all-in round-trip cost of $2.00 per contract. That cost is an assumption for the math, not a quote, so plug in your own broker's schedule.
| MES grid spacing | Gross per cycle | Net after $2.00 | Cost share of the cycle |
|---|---|---|---|
| 1 point | $5 | $3 | 40% |
| 2.5 points | $12.50 | $10.50 | 16% |
| 5 points | $25 | $23 | 8% |
| 10 points | $50 | $48 | 4% |
| 20 points | $100 | $98 | 2% |
A one-point grid looks busy and hands 40% of every cycle to costs before slippage. A useful rule of thumb is to keep the round trip under a tenth of the gross cycle, which on these numbers rules out anything tighter than about 5 points on MES.
Manual Versus AI Grid Parameters
Many exchange bots offer AI or "popular" parameter presets next to a manual mode. On one widely used exchange, the AI mode generates bounds and grid counts from technical analysis of the symbol's recent price over a period you select, and its recommended settings default to arithmetic spacing. A preset can be a reasonable starting point for the range, but it is fitted to recent behavior and says nothing about the loss you can carry. The depth and the exit are still yours to set.
Related lesson: Commission-adjusted futures breakeven
Grid Trading Risk and the Ladder Trough
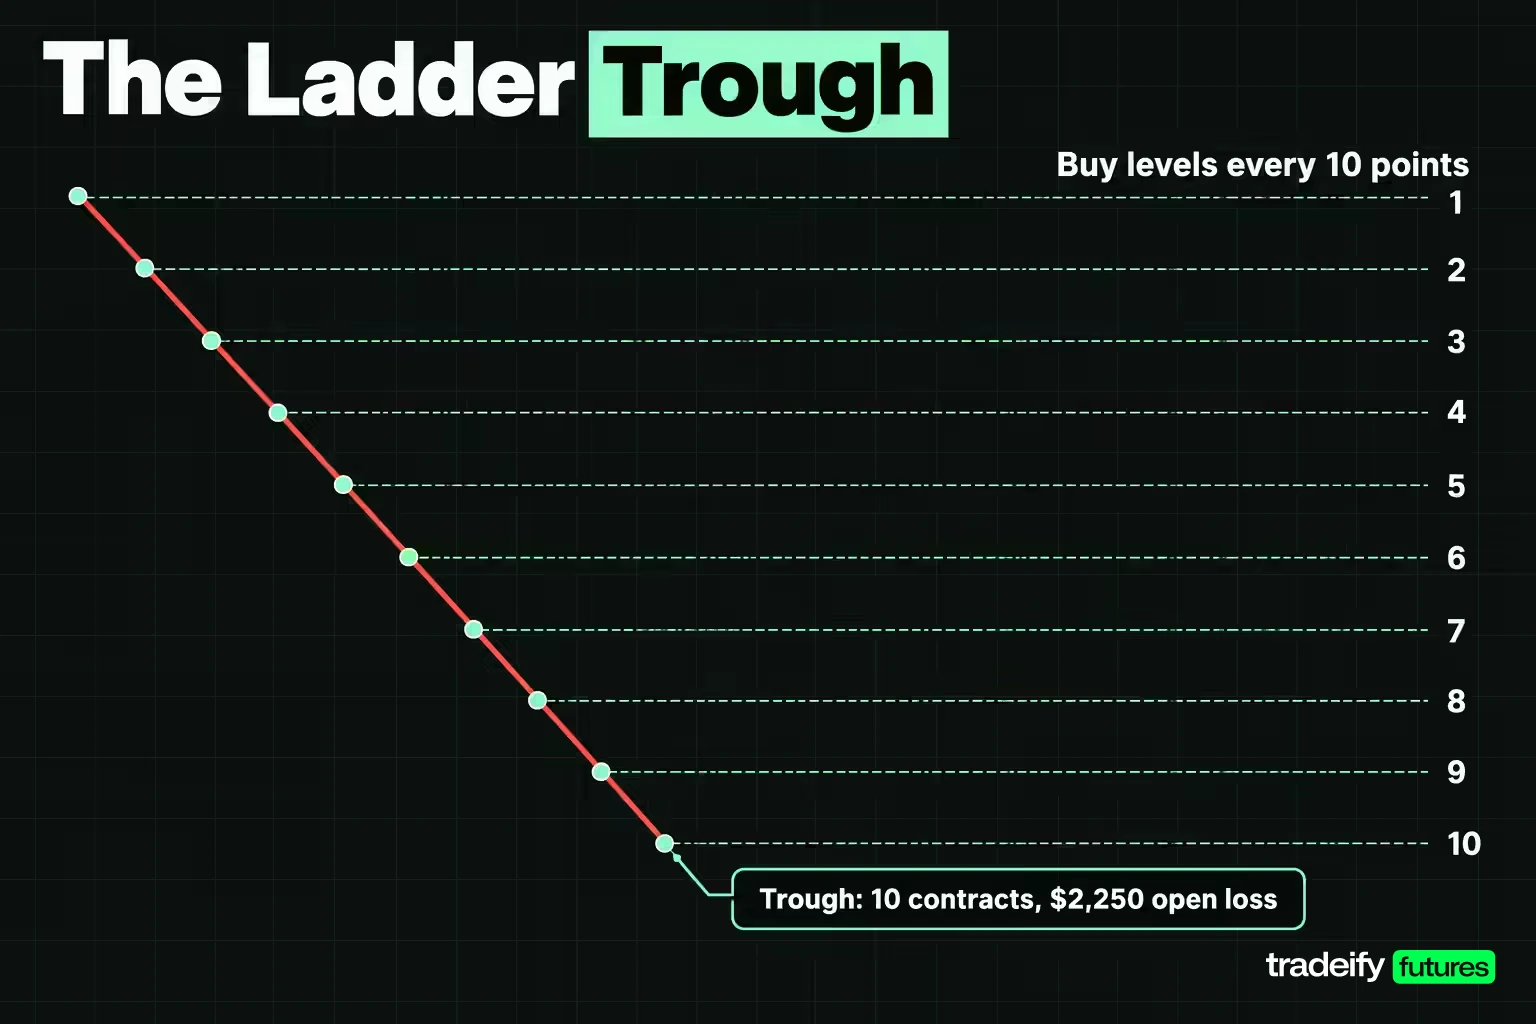
Grid trading risk is best measured at the trough: the open loss when every level has filled and price sits at the last one. That number, not the profit per cycle, decides whether the grid fits your account.
A Worked 10-Level Grid on MES
Use illustrative round numbers. MES trades at 7,000. You run a long grid with a 10-point step, one contract per level, 10 levels deep, so buys rest at 6,990, 6,980 and so on down to 6,900.
Price falls straight through all ten without bouncing. You now hold 10 contracts, and the open loss at 6,900 is the sum of each fill's distance from 6,900: 90 + 80 + 70 and on down to 0, which is 450 points. At $5 per point, the trough is $2,250.
This is the decision point: take the loss, or hold and wait for cycles. Compare the trough with what the grid can earn back. Each cycle nets $48 after the assumed $2.00 cost, so the trough equals about 47 cycles of work. But the ten positions in the ladder can only complete ten cycles on the way back up, worth $500 gross. The trough is 4.5 times everything the filled ladder can earn on the recovery.
Why the Trough Grows With the Square of the Levels
The trough follows a simple rule. With L levels, the open loss at the last fill is the step size times the point value times L(L-1)/2. The value of all L cycles is L times the step times the point value. Divide one by the other and the ratio is (L-1)/2, whatever the instrument or step size.
| Levels in the MES grid | Last buy level | Distance from 7,000 | Trough at the last fill | All cycles, gross | Trough to cycles ratio |
|---|---|---|---|---|---|
| 5 | 6,950 | 50 points (0.71%) | $500 | $250 | 2.0 |
| 10 | 6,900 | 100 points (1.43%) | $2,250 | $500 | 4.5 |
| 20 | 6,800 | 200 points (2.86%) | $9,500 | $1,000 | 9.5 |
| 40 | 6,600 | 400 points (5.71%) | $39,000 | $2,000 | 19.5 |
Doubling the levels from 10 to 20 more than quadruples the trough. On a full-size E-mini S&P 500 contract at $50 per point, every dollar figure in that table is ten times larger, so the 10-level trough becomes $22,500.
When the Grid Runs Out of Levels
A capped ladder is no longer a grid once price passes the last level. It is a long position of L contracts. If the 10-level MES ladder fills and price keeps falling another 70 points to 6,830, the open loss is $2,250 plus 10 contracts times 70 points times $5, or $5,750. Every extra point now costs $50 with nothing working to offset it, and that is usually when the temptation to add more levels shows up.
Sizing a Grid From the Loss You Can Take
Sizing a grid starts with the stop, not the step. If the plan exits one step past the last level, the loss at that stop is the step times the point value times L(L+1)/2. On the MES grid at 10 points, that is $500 for 4 levels, $750 for 5 levels and $2,750 for 10 levels.
The 1% rule, risking no more than 1% of the account on one idea, works the same way for a grid as for any trade, as long as the whole ladder counts as one trade. On a $50,000 account, 1% is $500, which fits a 4-level MES grid at a 10-point step with the stop one step past the last buy. That is a much smaller grid than most bot defaults suggest. If the honest number feels too small to bother with, that tells you something about the default, not about the math.
Common Grid Risk Mistakes
- Martingale sizing. Doubling the size at each lower level makes the average price recover faster but makes the trough explode. A fixed-size grid's trough already grows with the square of the levels; doubling turns that into exponential growth.
- Spacing under the cost of trading. A grid that pays 40% of each cycle in costs can complete hundreds of cycles and still lose money after slippage.
- Treating the level cap as a stop. Running out of levels only stops new buys. The position stays open.
- Counting only closed profit. A grid statement that shows completed cycles without the open loss is showing half the account.
Related lesson: Position sizing
Market Conditions Where a Grid Works
Grid trading works when price keeps crossing the same levels in both directions, which means a range or a choppy market with no persistent drift. It struggles in a sustained trend, where it fills one side again and again, and it is exposed to gaps, where price jumps past several levels at once and fills them at worse prices than planned.
Volatility on its own is not the friend it looks like. High volatility inside a range means more cycles. High volatility because the market is trending means more filled levels and a deeper trough.
| Market condition | How a long grid behaves | What to watch |
|---|---|---|
| Orderly range | Fills and closes cycles in both directions | Costs eating tight spacing |
| Choppy breakout attempt | Some cycles close while inventory builds | Mistaking early wins for proof the range holds |
| Strong downtrend | Fills level after level with few closes | The trough and the level cap |
| Strong uptrend | Closes its cycles, then sits idle above the range | Missed move, no new cycles |
| Gap or news spike | Several levels fill at once at worse prices | Slippage and the open loss jumping |
How Far E-mini Sessions Actually Travel
A grid's depth only makes sense next to how far price really moves. As an illustrative study, the session dip on the continuous front-month E-mini S&P 500 was measured from Yahoo Finance daily bars over 502 sessions, November 5, 2024 to November 3, 2026. The dip is how far the session low fell under the session open.
| Session low under the open | Sessions | Share of the 502 sessions |
|---|---|---|
| 0.5% or more | 242 | 48.2% |
| 1% or more | 108 | 21.5% |
| 2% or more | 22 | 4.4% |
| 3% or more | 8 | 1.6% |
The median session dipped 0.48% under its open. On an index near 7,000, a 1% dip is 70 points, which is more than a 5-level MES grid at a 10-point step can absorb, and that happened on roughly one session in five. The deepest dip in the sample came on April 10, 2025, when the low reached 355.75 points (6.47%) under an open of 5,502.50.
Single sessions are not the real test. The largest close-to-close decline in the same sample ran 18.54%, from 6,163.00 on February 19, 2025 to 5,020.25 on April 8, 2025, a fall of 1,142.75 points. A grid built to stay engaged through that decline needed 38 levels at a 30-point step, or 114 levels at a 10-point step, and the contract did not close back above 6,163.00 until June 26, 2025. Those figures describe what already happened in one sample, not what the next decline will look like.
Related lesson: Support and resistance
Is Grid Trading Profitable
Grid trading can be profitable in a market that keeps returning through its levels, and it can lose heavily when price leaves the range and does not come back. Whether it is profitable over time depends less on how many cycles it completes than on what it holds when the range breaks.
A grid is paid on travel and exposed to the net move. In the same E-mini S&P 500 sample of 502 sessions, the daily closes traveled about 22,217 points in total (the sum of each day's move, up or down), while the net change from first close to last was 1,784.50 points, about 8% of the travel. A grid harvests the back-and-forth. The net move is what decides whether its inventory finishes underwater.
That gap explains why grids can look profitable right before they fail. Weeks in a range produce a long run of closed winning cycles. Then a trend starts, the grid fills its whole ladder, and one open position wipes out many cycles of work. The equity curve looks smooth until it does not.
Why Grid Win Rates Mislead
Grid trading tends to report very high win rates, because nearly every closed trade is a completed cycle that made one step. That is also why no win rate, including a 90% one, says much on its own. A grid can win 95 cycles out of 100 and still lose overall if the open position from the five unfinished ones is large enough. Judge a grid on realized cycles minus open loss over the full period, at the bar size you actually trade.
What a Daily Profit Target Means for a Grid
Questions like making $100 a day come up often with grids. On the MES grid at a 10-point step and $48 net per cycle, $100 needs three completed cycles per contract ($144), since two cycles only make $96. Some days will deliver that and many will not, and the day the market trends without coming back can cost more than weeks of those cycles. A daily target can push you to tighten spacing or add levels, both of which raise the trough, so a target set by need rather than by the market is a risk in itself.
Related lesson: Backtesting a trading strategy
Grid Trading Bots and Automation
Grid trading bots handle the repetitive part: placing the ladder, re-arming each level after a cycle, and running all day without fatigue. Most crypto exchanges offer them, and futures traders build the same logic in platform strategies or scripts. Automation keeps orders consistent. It does not decide whether the market has changed.
What a bot does well:
- Places and re-places orders at exact levels without missed fills from hesitation.
- Runs through sessions you are not watching.
- Applies the same parameters every time, which makes results testable.
What it leaves to you:
- The range read. A bot fills its levels whether the range is intact or broken.
- Default settings. On one major exchange's spot grid, the option to sell all holdings at market when the grid stops is switched on by default. That can be what you want, or it can crystallize a loss at the worst print. Read every default before you start.
- The exit. Stop-loss and take-profit triggers on most grid bots are optional fields. Leaving them blank is a decision to hold the ladder indefinitely.
Backtesting a Grid Bot With Costs and Small Bars
Test a grid on bars smaller than the step size. A daily bar hides every touch inside the session, so a daily backtest undercounts cycles, and it also cannot tell whether the low or the high came first, which affects which orders filled. Run the test both ways on each bar and keep the lower cycle count, include costs, and report the worst open loss next to the closed profit. A backtest that shows only completed cycles is the same half-statement a live bot dashboard often shows.
Related lesson: Algorithmic trading
When to Pause or Close a Grid
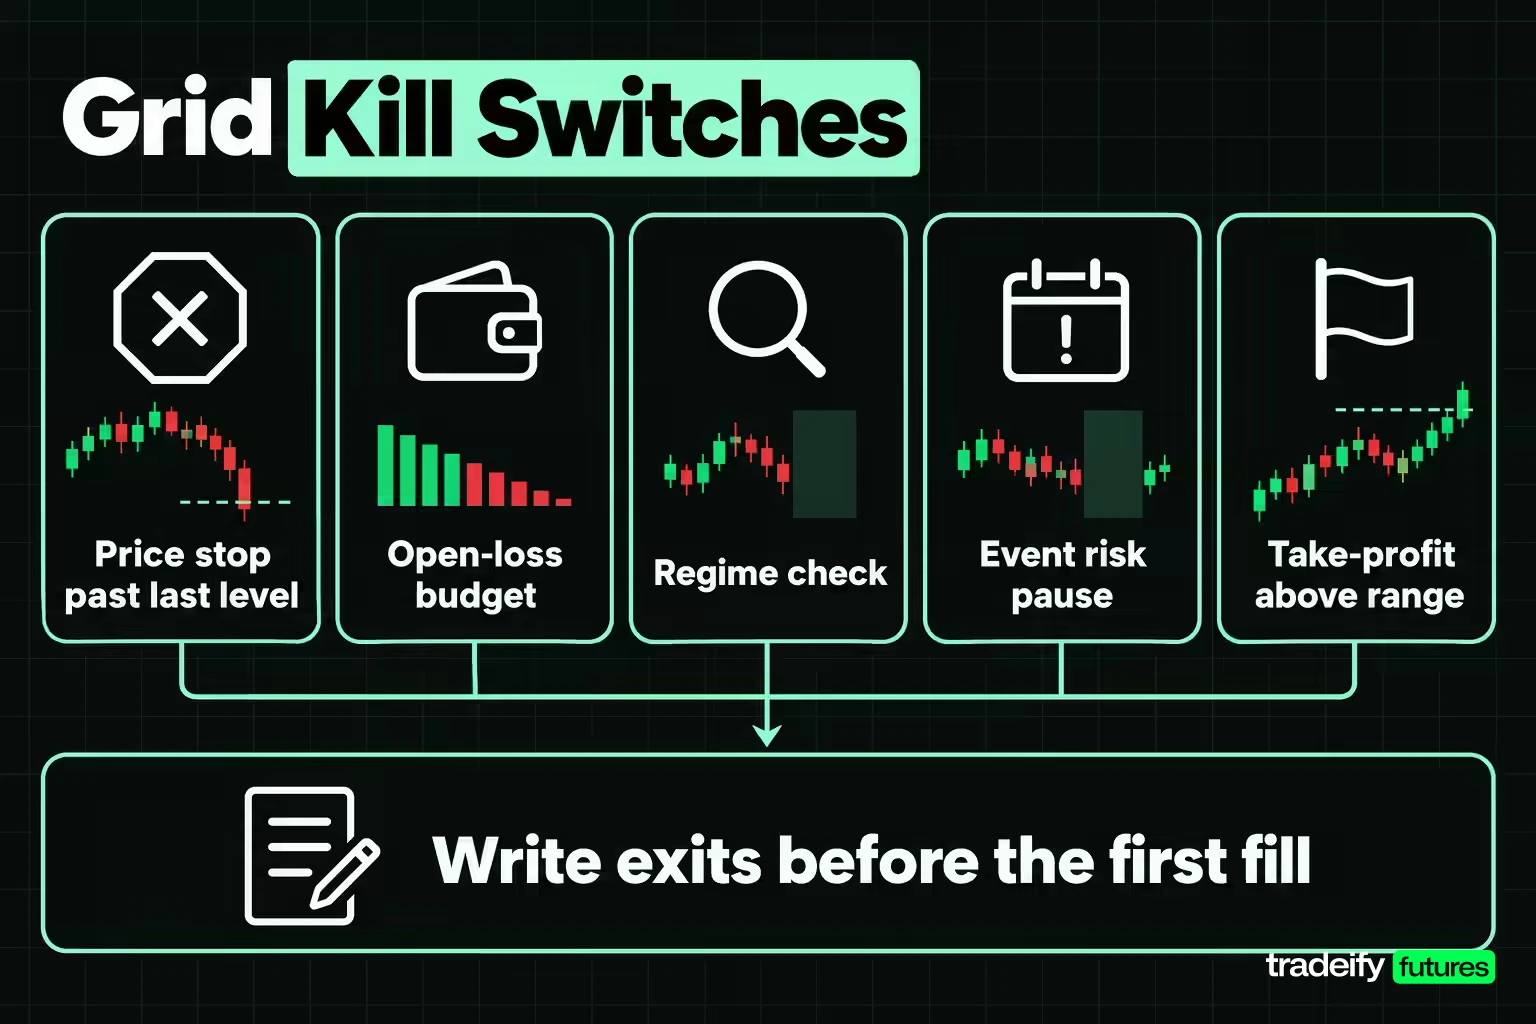
A grid needs exit rules written before the first fill. Once the ladder is deep in a trend, every exit looks like the worst possible moment, and "one more level" starts to sound reasonable. The useful kill switches each answer a different question.
- A price stop past the last level. If price trades one step past the bottom of a long grid, the range premise has failed. Close the inventory. Bot stop-loss fields that sit under the lower bound do exactly this.
- An open-loss budget. Close the grid if the open loss reaches a set dollar amount, even if levels remain. This protects the account when price falls faster than the ladder planned.
- A regime check. If price closes outside the range on the timeframe you used to define it, pause new buys and decide whether to keep the inventory as a directional trade, sized as one, or close it.
- Event risk. Before a scheduled release that can gap price through several levels, consider pausing new orders so the grid does not fill at worse prices in a spike.
- A take-profit above the range. For a long grid, a break above the upper bound leaves the grid holding cash with nothing filling. Stopping there lets you redraw the range around the new price instead of waiting.
Pausing and closing are different. Pausing cancels the resting buys but keeps the inventory, which only makes sense if you still believe price will return. Closing flattens everything and accepts the loss on the open levels. When in doubt, let the rule you wrote before the first fill decide, not the size of the loss on the screen.
Related lesson: Stop-loss orders and placement
Running Grids on Correlated Markets
Running several grids feels like spreading risk, but on correlated markets several grids behave like one larger ladder. When E-mini S&P 500 and E-mini Nasdaq-100 fall together, a long grid on each fills at the same time.
In the same two-year sample of 502 sessions, measured from Yahoo Finance daily bars, daily close returns on the two contracts had a correlation of 0.95. Of the 108 sessions when E-mini S&P 500 dipped at least 1% under its open, the Nasdaq-100 contract also dipped at least 1% on 105 of them, or 97.2%. Two long grids on those markets fill their ladders on nearly the same days.
Treat correlated grids as one position for risk purposes. Add their troughs together, set one open-loss budget across both, and size each grid so the combined loss at the stops fits that budget. The same logic applies to crypto pairs that move with the same lead coin, and to grids on related commodities.
How to Set Up a Grid Step by Step
Setting up a grid in this order keeps the risk decision ahead of the profit decision. The first five steps happen before any order rests.
Grid Setup Steps Before the First Order
- Define the range from the market, not the grid. Mark the range on the timeframe you plan to trade and note what would show it has broken.
- Pick the spacing from costs and volatility. Make sure the round trip is under about a tenth of the gross cycle, and that the step is wide enough that ordinary session noise does not fill several levels at once.
- Choose arithmetic or geometric spacing. Arithmetic suits a narrow range. Geometric suits a wide one where percentage moves matter more than point moves.
- Set the stop before the depth. Decide the price that invalidates the range and the dollar loss you will accept at that price.
- Size the ladder to the stop. Use the step times the point value times L(L+1)/2 to find the most levels, and the contracts per level, that fit the loss at the stop.
Grid Checks Before Scaling Up
These grid checks come after the ladder is sized and before it runs at full size.
- Check the depth against real moves. Compare the ladder's depth with how far the market has moved in a normal session and in its worst recent decline.
- Count correlated grids together. If you run other grids on related markets, add their worst cases to this one.
- Test at a smaller bar size, then start small. Backtest with costs on bars smaller than the step, then run one contract per level before scaling up.
- Review realized against open. Each week, put the open loss next to the completed cycles and decide whether the grid is still doing what it was built for.
Related lesson: Position sizing futures contracts
Grid Trading Compared With Martingale, DCA and Mean Reversion
Grid trading gets confused with several methods that also add to a position as price moves. The differences come down to how size changes and where the exit lives.
| Method | How size changes as price falls | Where the exit lives |
|---|---|---|
| Grid trading | Fixed size added at each fixed step | A sell one step higher for every buy |
| Martingale | Size multiplied after each loss | A recovery to the average price |
| Dollar-cost averaging | Fixed amount on a schedule, not price | No built-in exit |
| Mean reversion | Usually one entry when price is stretched | A return to the chosen average |
| Range trading | Entries near range edges, discretionary | The opposite edge or a stop outside the range |
The grid and martingale comparison comes up most, because both add to losers. Martingale multiplies the next position, so its trough grows exponentially and a single long move can end the account. A grid adds the same size each step, so its trough grows with the square of the levels: slower, but still faster than most traders expect.
Dollar-cost averaging shares the "buy more as it falls" behavior but usually runs on a calendar and has no rule to sell one step higher. Mean reversion shares the belief that stretched prices return, but a mean-reversion trade usually defines one entry and one invalidation, while a grid assumes reversion at every level it fills.
Related lesson: Martingale and anti-martingale
Grid Trading on a Funded Futures Account
Grid trading on a prop firm account runs into rules that a crypto spot bot never meets. Many funded futures programs require positions to be closed daily, cap the total contracts you can hold, enforce drawdown on open profit and loss as well as closed, and prohibit holding opposing positions that offset each other. Each of these changes the grid: a daily flat rule means the ladder cannot wait overnight for a recovery, a contract cap limits depth, and a drawdown measured on open loss means the trough itself can end the account.
On our accounts, every position must be closed by 4:45 PM ET, with no overnight or weekend holds, so a grid's inventory has to be flat by then or it gets auto-closed. Our 50K accounts allow 4 minis or 40 micros in total, which caps a one-micro-per-level grid at 40 filled levels. The trailing drawdown is enforced in real time on net liquidation value, including unrealized P&L, so a ladder's open loss counts the moment it happens. Hedging is prohibited, including opposing positions on the same product or Product Group across accounts, and algorithmic strategies are allowed only if you own them exclusively and they are not high-frequency. Our funded accounts are simulated, and we do not support crypto derivatives.
Grid Trading FAQ
Is grid trading good for beginners?
Grid trading can suit a beginner only as a small grid with a hard stop, because it is easy to start and hard to size. Bot defaults often fill more levels than a small account can carry, so start from the loss you can accept, not the profit per cycle. Running one contract per level and tracking the open loss daily teaches the trade-off faster than any backtest.
How much capital do you need for grid trading?
Grid trading capital should cover the loss at your stop, not just the cost of opening the first level. On a Micro E-mini S&P 500 grid with a 10-point step, a 4-level ladder with a stop one step past the last level risks $500, and a 10-level ladder risks $2,750. Margin on top of that depends on the broker and changes with market conditions.
Is grid trading like gambling?
Grid trading is not gambling when the spacing, depth and exit are planned and the worst case is sized to the account. It starts to resemble gambling when the grid has no stop and relies on price always coming back. The same is true of forex or any other market: the plan and the sizing make the difference, not the instrument.
How far apart should grid levels be?
Grid levels should be far enough apart that the round-trip cost stays under about a tenth of each cycle, and wide enough that one ordinary session does not fill most of the ladder. On MES at an assumed $2.00 round trip, a 10-point step keeps costs at 4% of the cycle.
What happens when price breaks out of a grid range?
When price falls under a long grid's lower bound, the grid stops buying and holds every level it filled. From there it behaves like a regular long position of that size until you close it or price returns. A break above the upper bound leaves a long grid flat and idle.
Does grid trading work on futures?
Grid trading works mechanically on futures, since limit orders rest and fill the same way, but each level adds contract exposure with a fixed dollar value per point. Daily close rules and drawdown limits at many funded programs also mean the ladder cannot simply wait for a recovery.
Grid trading and other futures strategies carry substantial risk of loss, and leverage can make losses larger than expected, including losses beyond the money in an account. Every market figure here is past data or illustrative math, not a forecast; funded and evaluation accounts at prop firms are simulated, and this guide is educational, not investment advice.


