



TL;DR: Position trading holds a trade for weeks to months, so the drawdown you sit through decides more than the target does. On five years of S&P 500 data, the median six-month hold went 4.39 ATR against the entry first. Pick the holding window, measure its drawdown, then size so that drawdown is affordable. If the budget can't fund the stop, use a smaller contract or a shorter window.
Position trading is the slowest of the active trading styles. You take a view on a trend that should play out over weeks or months, hold through the noise, and close when the reason for the trade is gone.
The hard moment isn't the entry. It's week three, when the position is 200 points underwater, nothing about your reason for the trade has changed, and every instinct says get out. Most guides list the benefits: fewer trades, less screen time, lower costs. All true, and none of them decide whether the plan survives that week. What decides it is how far the position goes against you while you wait, and whether the account was sized for that before you entered.
This guide covers the definition, the strategies and the plan, and it measures the part most pages skip: the drawdown a long hold actually carries on the S&P 500 and the Nasdaq-100.
What Position Trading Is and How Long a Position Trade Lasts
Position trading is a trading style that holds a trade for weeks, months and sometimes more than a year to capture most of a sustained trend. A position trader ignores day-to-day swings, enters when a longer trend or a fundamental change looks established, and exits when that trend or reason fails.
How long is position trading? There is no official cutoff. Educational sources describe the holding period as weeks to months, and some stretch it to years. Investopedia notes that position traders often make fewer than 10 trades a year.
Three traits separate position trading from shorter styles:
- The timeframe. Decisions come from daily, weekly and monthly charts, not intraday bars.
- The stop width. A trade held for months needs a stop measured in multiples of the daily range, not in ticks.
- The size. The same risk budget divided by a much wider stop buys fewer contracts.
Position traders can be long or short. That is one practical difference from a buy-and-hold investor, who generally only owns assets. Futures make shorting as simple as buying, so a futures position trader can hold a bearish view for months.
A simple example of position trading: a trader expects an interest-rate cycle to keep pressure on equity valuations, sells a stock index future, sets a stop above the prior major high and plans to hold for about a quarter. The trade is closed if price breaks that high or if the rate outlook changes. The question that matters is whether the account can sit through the rallies along the way.
Related lesson: Trading styles explained
Position Trading vs Day Trading, Swing Trading and Investing
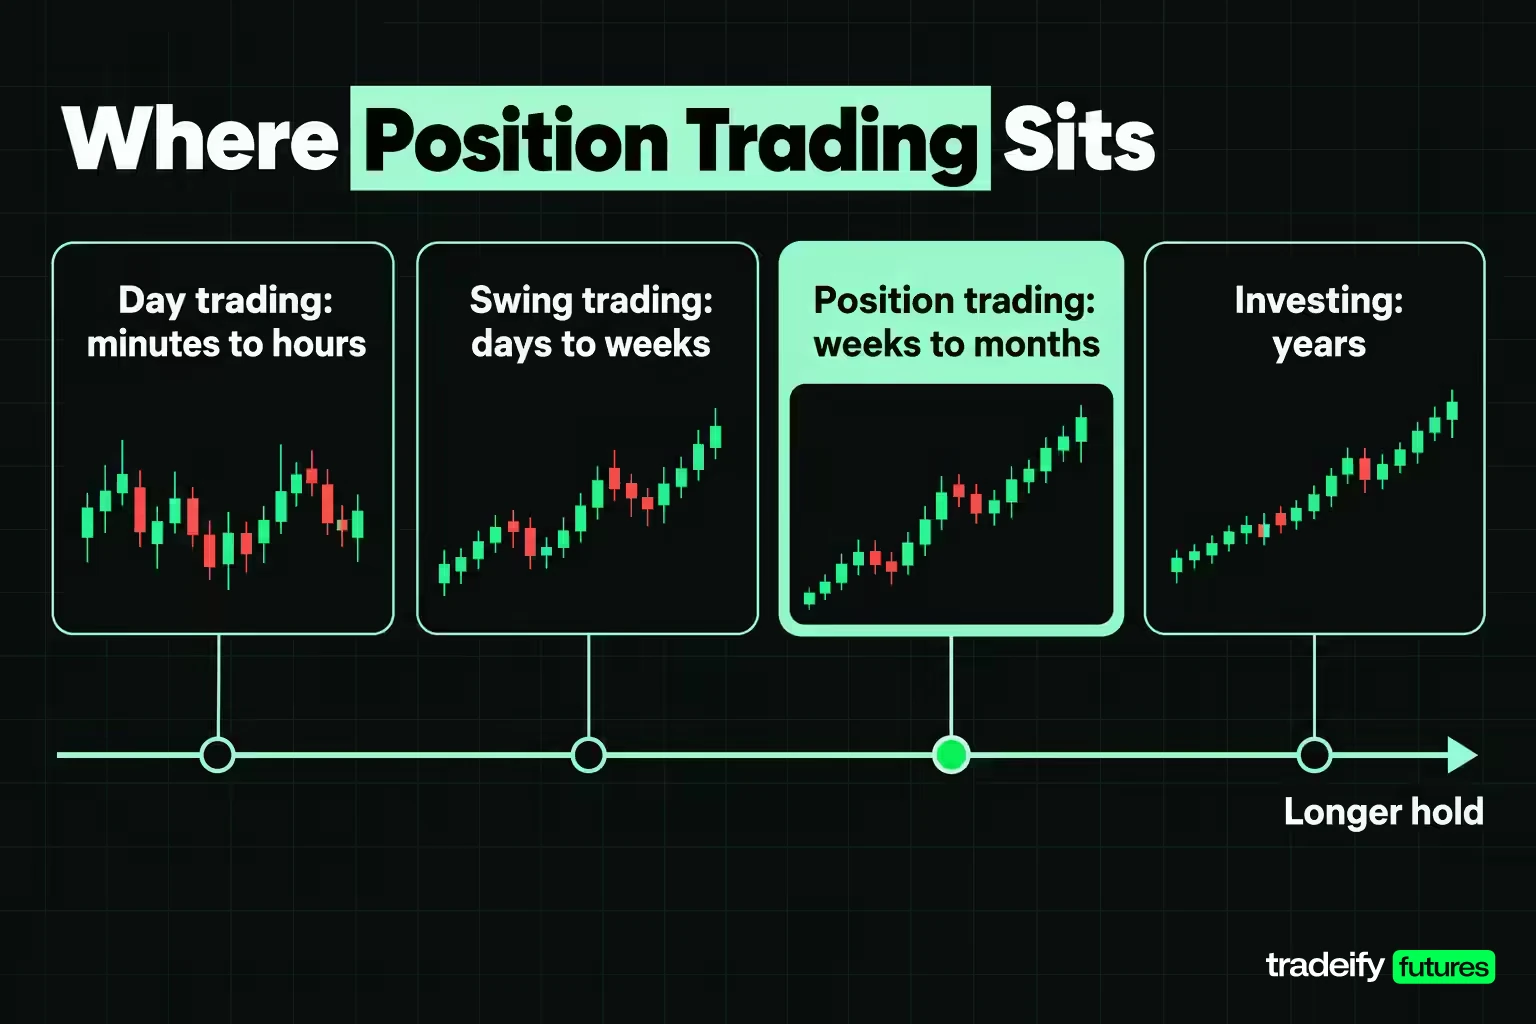
Position trading sits at the long end of the active trading styles. Here's how it compares with the approaches either side of it.
| Approach | Typical hold | Trades per year | Stop width | Main analysis | Overnight exposure |
|---|---|---|---|---|---|
| Day trading | Minutes to hours, flat by the close | Hundreds or more | Ticks to a few points | Intraday price and volume | None |
| Swing trading | Days to weeks | Dozens | A fraction of to one or two daily ranges | Daily chart structure | Yes, several nights |
| Position trading | Weeks to months or longer | Often fewer than 10 | Several daily ranges | Weekly charts plus macro or fundamental view | Yes, for the whole hold |
| Buy-and-hold investing | Years | Very few | Often none | Fundamentals and allocation | Yes, and usually long only |
The table hides the most important difference: what each style is exposed to. A day trader's risk is mostly execution and noise inside one session. A swing trader carries a handful of overnight gaps. A position trader carries every gap, every data release and every regime change for the whole hold, and has to accept that a large part of it will be uncomfortable.
The line between swing and position trading is blurry. A trade held for six weeks could be called either. A more useful test is the reason for the hold: a swing trade targets one leg of a move, while a position trade bets on a condition that needs weeks or months to play out.
Investing differs in purpose. A buy-and-hold investor builds a portfolio for a long-term goal and usually doesn't set an exit at the end of a trend. A position trader has a thesis, an invalidation level and an exit plan.
Related lesson: Day trading vs swing trading
How Position Trading Works From Thesis to Exit
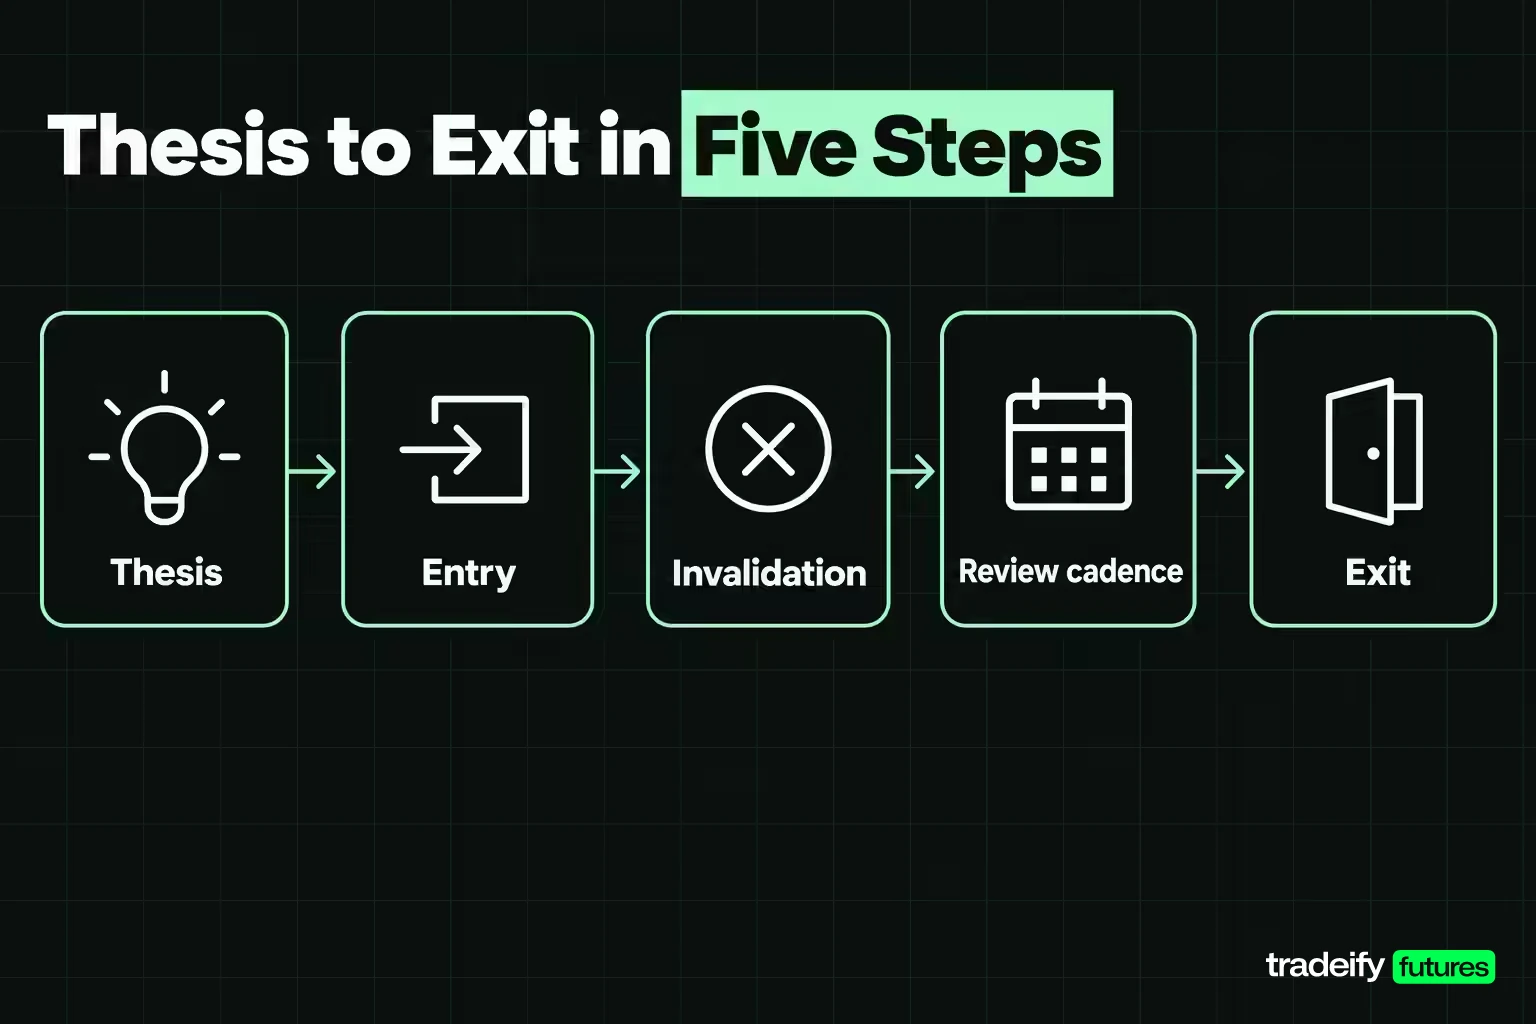
Position trading works in five steps, and the order matters more than any single indicator.
- Thesis. Name the condition that should move the market for weeks or months: a rate path, an earnings trend, a supply shift or an established price trend.
- Entry. Wait for price to confirm the thesis on a daily or weekly chart, such as a breakout above a multi-month range or a pullback that holds in an uptrend.
- Invalidation. Set the price where the thesis is wrong. For a long hold this is usually several average daily ranges away, not a few points.
- Review cadence. Check the position on a fixed schedule, often at each daily or weekly close, rather than reacting to every intraday move.
- Exit. Close when the invalidation hits, the thesis changes, a trailing rule on the higher timeframe triggers, or the planned window ends.
In futures, two mechanics come with any multi-week hold.
Holding a Futures Position Across a Contract Roll
Futures contracts expire, so a position trade in futures has to be rolled into the next contract month or closed. Equity index futures such as the E-mini S&P 500 (ES) are listed quarterly in March, June, September and December. CME's roll date for equity index futures is the Monday before the third Friday of the expiration month. For the December 2026 contracts, that's a roll on December 14, 2026 and expiration on December 18, 2026.
Rolling a long position means selling the expiring month and buying the next one, which costs two round turns plus any slippage. The next month also trades at a different price. On November 3, 2026, December ES settled at 7596.75 and March 2027 ES at 7670.00, a gap of 73.25 points, or $3,662.50 per contract at $50 a point.
That gap is not a loss in itself. It mostly reflects carry, the financing cost minus expected dividends that the further contract prices in, and it shrinks as March approaches. But it means a futures position trader's result differs from the index's price change, and long-dated charts built from continuous contracts can show jumps at each roll.
Related lesson: When to roll a futures contract
Weekend Gaps and Overnight Margin in Position Trading
A position held for months sits through every weekend. Measured in this article's study on Yahoo Finance daily data for E-mini S&P 500 futures from November 2021 to November 2026, leaving out weekends near quarterly rolls, the median weekend gap was small: 0.09 ATR, where ATR is the 14-day average true range. The 90th percentile was 0.41 ATR, and the largest was 1.05 ATR, an 85.00-point gap lower into Monday, February 3, 2025. 13 of 199 weekends opened at least half a day's range away from Friday's close.
Most weekends do little damage. The rare large ones arrive without warning, can open beyond a stop, and fill there at whatever price trades first.
Holding overnight also means carrying the full margin the broker requires. CME describes futures margin as typically 3-12% of a contract's notional value, and notes that margin requirements can rise when markets become more volatile. A position trader who sizes to the minimum margin can be forced out by a margin increase rather than by the market.
Position Trading Strategies Built on Trends, Breakouts, Pullbacks and Carry
Position trading strategies fall into four families. Each has a different entry trigger and a different failure point.
Trend following. Enter in the direction of an established trend, often confirmed by price holding above or below a long moving average such as the 200-day, and stay in until the trend structure breaks. It fails in sideways markets, where the trend signal flips repeatedly and each flip costs a stop.
Breakout trading. Enter when price closes beyond a multi-month range, on the idea that a new trend is starting. The invalidation is a close back inside the range. It fails on false breakouts, which are common, and on entries far from the stop after a large breakout bar.
Pullback trading. Wait for a counter-move inside an existing trend and enter as it stalls, usually near a prior breakout level or a rising average. It offers a tighter stop than a breakout but can miss strong trends that never pull back far enough.
Carry. Hold the side of a market that pays you to wait. In currencies this is the classic carry trade: long the higher-yielding currency, short the lower-yielding one. In futures, carry is built into the price gap between contract months. It fails when the yield gap narrows or when a sharp risk-off move unwinds crowded carry positions quickly.
Most position traders combine one of these entries with a fundamental reason to expect the trend to last. The entry pattern is the trigger, not the thesis.
Related lesson: Trend following
Technical and Fundamental Analysis for Position Trades
Position trades usually combine technical and fundamental analysis. The fundamental view supplies the reason to hold for months; the chart supplies the entry and the invalidation.
Technical Tools Position Traders Use on Weekly and Daily Charts
The technical toolkit is the same as for shorter styles, applied to slower data:
- Long moving averages. StockCharts calls the 200-day moving average perhaps the most popular, and the 50-day is popular for the medium-term trend.
- Weekly market structure. Higher highs and higher lows on a weekly chart define the trend a position trade relies on.
- Average true range (ATR). ATR measures the average daily range, including gaps, and sets stop width in units of volatility instead of fixed points.
- Multi-month ranges. Range boundaries become breakout triggers and invalidation levels.
A trend filter is not a guarantee. In this article's own study of five years of S&P 500 daily data from Yahoo Finance, 120-session holds entered while the index was above its 200-day average finished higher in 89.96% of 767 windows, with a median drawdown of 4.14 ATR. Entries below the 200-day average finished higher in 95.21% of 167 windows. That second group came almost entirely from the 2022 decline, which later recovered, so it reflects one episode rather than a rule. The point is that a filter tested on one five-year sample proves little, and overlapping windows make the counts look larger than the number of independent decisions.
Fundamental Drivers Behind Multi-Month Position Trades
Fundamental analysis for position trading focuses on drivers that change slowly:
- Interest rates. As of November 4, 2026, the federal funds target range is 3.75%-4.00% after a September hike and an October hold. The next FOMC meeting is December 8-9, 2026.
- Inflation. September 2026 CPI showed headline inflation at 3.7% year over year. October data is due Tuesday, November 10, 2026, at 8:30 AM ET.
- Earnings and growth for equity index trades.
- Supply and demand balances for energy, metals and agricultural futures.
Treat dated figures like these as inputs that go stale. A position trade built on a rate view needs a rule for what happens when the rate outlook shifts in the middle of the hold.
How Much Drawdown a Long Hold Carries
Drawdown during the hold, often called heat or adverse excursion, is the number position traders most often underestimate. The table below comes from this article's own study of Yahoo Finance daily data for the S&P 500 and Nasdaq-100 indexes, November 2021 to November 2026, and shows what simply holding a long position did.
| Holding window | S&P 500 median heat | S&P 500 90th percentile heat | Nasdaq-100 median heat | Nasdaq-100 90th percentile heat | S&P 500 windows finishing higher |
|---|---|---|---|---|---|
| 20 sessions, about a month | 1.91 ATR, 120.38 points | 400.56 points | 1.86 ATR, 578.37 points | 1,881.97 points | 63.82% |
| 60 sessions, about a quarter | 2.94 ATR, 195.28 points | 637.46 points | 3.24 ATR, 969.74 points | 2,938.38 points | 73.20% |
| 120 sessions, about six months | 4.39 ATR, 271.06 points | 954.48 points | 4.22 ATR, 1,153.13 points | 4,106.50 points | 78.19% |
| 250 sessions, about a year | 5.63 ATR, 337.81 points | 1,084.26 points | 4.90 ATR, 1,313.11 points | 4,545.39 points | 88.68% |
Read the heat columns first. Median heat roughly doubles from one month to six months on the S&P 500, and the 90th percentile at six months is 954.48 points. Futures move close to point for point with the index, so on a Micro E-mini S&P 500 (MES) at $5 a point, the median six-month heat is about $1,355.30 and the 90th percentile about $4,772.40. On one full-size ES at $50 a point, the median is about $13,553.00.
The finishing rate rises with the window, which is the misleading part. In that Yahoo Finance index study, 88.68% of one-year windows finished higher because the S&P 500 went from about 4,698 to about 7,569 over the sample. A rising market rewards holding longs. The longer window did not remove the drawdown. It postponed the payoff and made the heat larger.
How the Holding-Window Study Was Measured
The study used daily bars for the S&P 500 index and the Nasdaq-100 index from Yahoo Finance: 1,253 completed sessions from November 5, 2021 to November 3, 2026. Index data avoids the jumps continuous futures series show at each quarterly roll.
- Entry. The close of every session, long, with no filter.
- Windows. 20, 60, 120 and 250 sessions, giving 1,219, 1,179, 1,119 and 989 windows on the S&P 500.
- Heat. The largest distance from the entry to the lowest low inside the window.
- ATR. Wilder's 14-session average true range, frozen on the entry day.
This is a description of what the market did to a held position, not a backtest of a strategy. Windows overlap heavily, so they are not independent trades, and five years is one market history with one bear market in it.
Position Trading Risks and Disadvantages
Position trading risks come from time. The longer a position is open, the more things can happen to it.
- Deep drawdown before the payoff. In this article's study of five years of Yahoo Finance S&P 500 data, the median six-month hold went 4.39 ATR against the entry, and the worst went 1,309.11 points against it.
- Regime change. The thesis can be right when entered and wrong two months later. A rate outlook, an earnings cycle or a policy decision can turn while the position is open.
- Direction bias in the sample. Short positions fared far worse in the same Yahoo Finance data, November 2021 to November 2026. The median six-month heat on a short S&P 500 position was 8.67 ATR, about twice the long side's 4.39 ATR, because the index rose.
- Gaps. Weekends and data releases can open price beyond a stop, and the fill comes at the first available price.
- Roll and carry costs. Every quarterly roll in index futures adds round turns and a price gap between contract months.
- Capital tied up. Margin and risk capital sit in one idea for months, which is an opportunity cost.
- Slow feedback. With often fewer than 10 trades a year, it takes years to learn whether a method works. A run of three bad trades can be a year of results.
The last risk is the one that catches traders who come from faster styles. A day trader gets hundreds of results a year and can judge a method in months. A position trader can't. Three losers in a row might be a broken method or an ordinary run, and the sample is too small to tell, so the plan has to be justified before the trades, not by them.
Related lesson: Risk of ruin
Stop Placement and Position Sizing for Position Trading
Stop placement in position trading is a tradeoff between being stopped out by noise and taking a loss too large to afford. This article's study of Yahoo Finance daily index data, November 2021 to November 2026, measured how often a stop set a fixed number of ATRs below a long entry was touched.
| Stop distance below entry | S&P 500, 20 sessions | S&P 500, 120 sessions | Nasdaq-100, 20 sessions | Nasdaq-100, 120 sessions |
|---|---|---|---|---|
| 1 ATR | 68.66% | 80.70% | 70.71% | 82.39% |
| 2 ATR | 48.15% | 69.62% | 47.99% | 70.78% |
| 3 ATR | 31.58% | 61.13% | 32.81% | 61.93% |
| 4 ATR | 21.90% | 53.08% | 20.92% | 52.19% |
| 6 ATR | 9.60% | 40.30% | 6.89% | 34.41% |
Two findings matter. Over six months, even a 6 ATR stop was touched in 40.30% of S&P 500 windows in that study. And breaches come early: on 120-session holds, a 2 ATR stop that was hit was hit after a median of 10 sessions, and a 1 ATR stop after a median of 4. Most stop-outs happen before the thesis has had time to be tested.
That doesn't make stops optional. It means the stop has to sit where the thesis is wrong, not where the trade starts to hurt. Those are two different prices, and mixing them up is how a sound position trade turns into a string of small losses. The size then has to make the real invalidation distance affordable.
The Stop Width a Risk Budget Can Fund
Sizing usually starts from the stop. In position trading it helps to run it the other way: given a fixed risk budget, how wide a stop can one contract carry? The table uses CME point values and the touch rates from this article's study of Yahoo Finance index data, November 2021 to November 2026, where a long hold's median 14-day ATR was 65.23 points on the S&P 500 and 302.72 on the Nasdaq-100.
| Contract | Value per point | Stop a $1,000 budget funds | That stop in median ATR | Share of 120-session windows that touched it |
|---|---|---|---|---|
| E-mini S&P 500 (ES) | $50 | 20 points | 0.31 ATR | 91.33% |
| Micro E-mini S&P 500 (MES) | $5 | 200 points | 3.07 ATR | 58.62% |
| E-mini Nasdaq-100 (NQ) | $20 | 50 points | 0.17 ATR | 93.83% |
| Micro E-mini Nasdaq-100 (MNQ) | $2 | 500 points | 1.65 ATR | 72.65% |
The full-size contracts can't carry a position-trading stop on a $1,000 budget. A 20-point stop on ES was touched in 91.33% of six-month windows in the study. The micros change the answer by a factor of ten, putting the stop in the multi-ATR range a long hold needs. ATR moves with volatility, too: as of November 3, 2026, the S&P 500's 14-day ATR was 78.56 points, above the 65.23-point median of the sample, so the same 200-point MES stop covered only about 2.55 ATR.
The rule that follows is simple. If the budget can't fund the stop the window needs, change the contract, the window or the budget. Don't shrink the stop to fit.
Related lesson: Position sizing futures contracts
Why Winning Long Holds Often Start Underwater
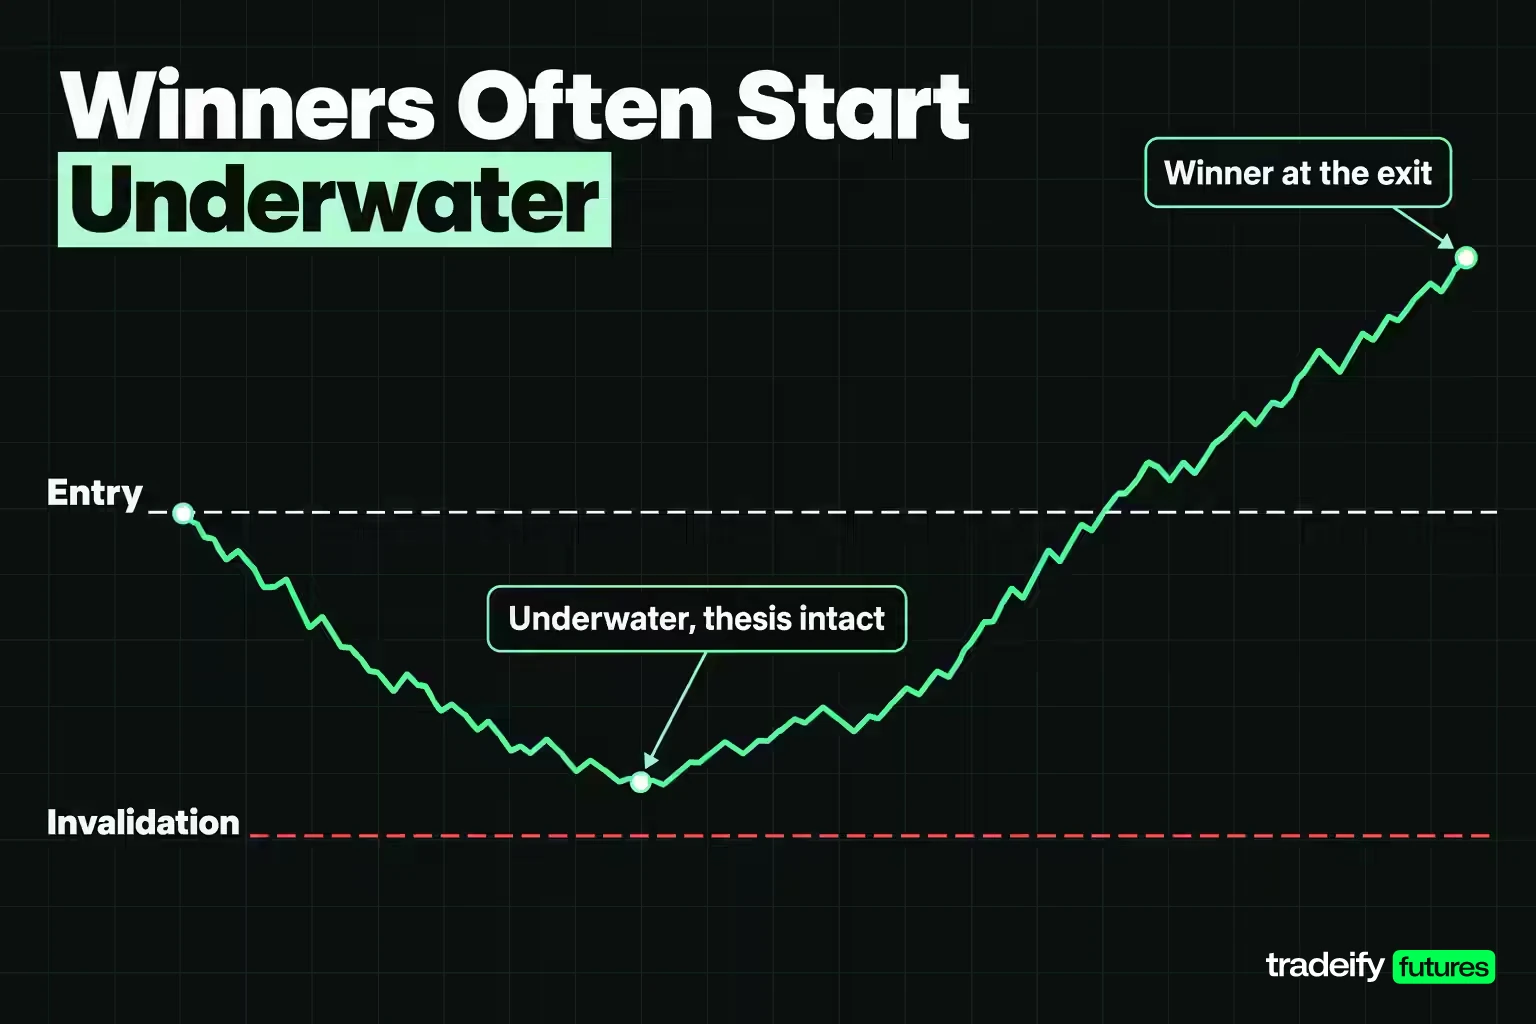
Winning position trades are often painful before they pay. In this article's study of Yahoo Finance daily data, November 2021 to November 2026, of the 120-session S&P 500 windows that eventually gained 3 ATR, 438 of 964, or 45.44%, had first fallen 2 ATR below the entry. On the Nasdaq-100 it was 434 of 967, or 44.88%. Over 20-session windows the share was only 14.34% on the S&P 500, so the longer the hold, the more often the winners started as losers.
That has a direct consequence. If almost half of the eventual winners were 2 ATR underwater first, a habit of exiting whenever a trade goes 2 ATR against you removes almost half of the winners. The rule that feels protective selects against the trades that pay.
The fix isn't to hold through anything. It's to set the invalidation before the entry, size so that it is affordable, and treat a drawdown short of the invalidation as normal for a long hold. Being 2 ATR down is information about the noise, not a verdict on the thesis.
A Median Six-Month S&P 500 Position Read Session by Session
This example of a long hold is the 120-session S&P 500 window, from Yahoo Finance daily index data, whose heat was closest to the median of all 1,119 windows in the study. It was chosen by heat alone before its result was read.
- Entry. Close on March 20, 2024 at 5,224.62, with the 14-day ATR at 47.91 points.
- Session 10 (April 4). Close at 5,147.21, 77.41 points below the entry. A 1 ATR stop was touched this session.
- Sessions 16 to 19. The 2, 3 and 4 ATR stops were all touched by April 17.
- Session 21 (April 19). The worst point: a low of 4,953.56, 271.06 points or 5.66 ATR below the entry.
- Session 40 (May 16). Close at 5,297.10, back above the entry by 72.48 points.
- Session 80 (July 16). The high of the window at 5,669.67, 9.29 ATR above the entry.
- Session 120 (September 11). Exit at 5,554.13, 329.51 points above the entry.
Every stop from 1 ATR to 4 ATR exited this trade at a loss in April. Only the 6 ATR stop, 287.46 points below the entry, survived the drawdown. That is the typical window, not a dramatic one, and it shows why size has to absorb the heat rather than the stop.
Rules for Managing a Long-Term Hold Until It Pays or Fails
Long-term holding strategies matter because most of the work in a position trade happens after the entry. A few rules keep a long hold from turning into a series of emotional decisions.
Review on a schedule. Check the position at the daily or weekly close and decide only then. In this article's study of Yahoo Finance S&P 500 data, 1 ATR stops on six-month holds were hit after a median of 4 sessions, so intraday watching mostly shows noise.
Trail on the higher timeframe. If you trail a stop, trail it on weekly closes or behind weekly swing lows, not on intraday moves. A trailing stop on a 5-minute chart turns a position trade into a day trade.
Never widen the stop. Moving the invalidation further away after entry is a new trade with more risk, made under pressure, usually right when price is closest to the stop. If the original stop was wrong, close and reassess from flat.
Add only to a working trade, and only with a plan. Scaling into a position that has moved in your favor can be part of a written plan. Adding to a losing position to lower the average price increases the risk of the trade at exactly the moment the thesis is being tested.
Keep a calendar. Note the roll date, the next central bank meeting and the major data releases inside the window, and decide in advance what each could change.
Re-check the thesis, not the P&L. Ask whether the reason for the trade still holds. If it does and price is above the invalidation, the plan says hold. If it doesn't, the plan says exit, whatever the open profit or loss.
Related lesson: Stop-loss orders and placement
Position Trading Advantages
Position trading has five practical advantages over faster styles, and each one has a catch worth knowing before you count on it.
- Fewer decisions. With often fewer than 10 trades a year, there are fewer chances to make an impulsive mistake. The catch is that each decision carries more weight.
- Lower trading costs per year. Round-turn commissions and slippage are paid a handful of times instead of hundreds. Quarterly futures rolls add some of that back.
- Less noise. Weekly and daily charts filter out much of the intraday chop that drives short-term traders in and out.
- Time. A position trader doesn't need to watch the screen all day, which suits people with a job or other commitments.
- Larger moves per trade. In this article's study of Yahoo Finance S&P 500 data, the six-month median close-to-close move was 409.49 points on the S&P 500 against a 20-session median of 79.60 points. Bigger moves need bigger stops, so the reward per unit of risk doesn't automatically improve.
The time advantage is the most misread. Less screen time is not less risk. A position held for months is exposed every hour of that time, including the hours you're not watching.
Who Position Trading Suits and Who It Does Not
Position trading suits traders who can tolerate long stretches of open drawdown without acting on it, and who have the capital to size small relative to their stop.
It tends to suit:
- People with limited daily screen time who can review positions at the close.
- Traders whose edge comes from macro or fundamental reading rather than fast execution.
- Accounts large enough, or contracts small enough, to fund a multi-ATR stop.
- Traders who are comfortable going months without a closed trade.
It tends not to suit:
- Traders who need frequent feedback to stay disciplined.
- Small accounts trading full-size contracts, where a long-hold stop is unaffordable.
- Anyone trading in an account that must be flat by the end of each session.
- Traders who check open profit and loss every hour.
Investopedia notes that position trading is ideally suited to a bull market with a strong trend and does not lend itself easily to a bear market. Five years of S&P 500 data from November 2021 to November 2026 fit the first half: long holds carried about half the drawdown of short holds while the index rose.
Related lesson: Swing trading
How to Start Position Trading
Starting position trading is mostly about building the habit of planning before the entry. A practical order:
- Choose one market you understand. An equity index future, a currency future or a commodity whose drivers you follow.
- Learn its contract. Know its value per point, tick size, contract months and roll schedule before you trade it.
- Measure its normal drawdown. Pull several years of daily data and check how far a held position typically moves against the entry for the window you plan to hold.
- Start with the smallest contract. Micro E-mini contracts are a tenth of the full size: $5 a point on MES and $2 a point on MNQ.
- Paper trade or simulate the first few trades. The aim is to test whether you can follow the review schedule and leave the stop alone, not to prove the method.
- Keep a journal. Record the thesis, the planned window, the invalidation and every decision during the hold.
With few trades a year, the journal is the main source of feedback. Review the decisions, not just the results. A losing trade that followed the plan is a fine line in the journal; a winner that broke it is the entry worth worrying about.
Related lesson: How to keep a trading journal
Building a Position Trading Plan
A position trading plan is a written set of numbers decided before the entry. The order matters: the window sets the stop, and the stop sets the size.
| Plan field | What to decide | Illustrative example |
|---|---|---|
| Thesis | The condition expected to move the market | Rates stay elevated and pressure index valuations |
| Instrument | The contract and its value per point | MES at $5 a point |
| Holding window | How long the condition needs | About 60 sessions |
| Entry trigger | What confirms the thesis on the chart | A weekly close below a multi-month range |
| Invalidation | Where the thesis is wrong, in ATR | 3 ATR above entry, about 210 points at a 70-point ATR |
| Risk per contract | Invalidation distance times value per point | 210 points x $5 = $1,050 |
| Size | Risk budget divided by risk per contract | $1,000 budget funds 0 contracts, so widen the budget or shorten the window |
| Review schedule | When decisions are allowed | Weekly close only |
| Exit rules | Invalidation, thesis change, trailing rule or window end | Close on any one |
| Calendar | Rolls, central bank meetings and data inside the window | Roll date, FOMC, CPI |
The example is deliberately one that fails the sizing test. Writing it down shows the problem before money is at risk: a 3 ATR invalidation on MES costs more than the budget, so the honest options are a larger budget, a shorter window with a tighter justified stop, or no trade.
Treat any change to the plan once the trade is open as a new decision, and record why.
Related lesson: How to create a trading plan
Position Trading and Same-Session Account Rules
Position trading needs an account that allows positions to stay open overnight, over weekends and for weeks. Many funded futures programs don't allow that. They require every position to be closed before the end of each trading session, which makes position trading impossible inside them, however good the thesis.
What carries over to a same-session account is the analysis, not the holding. A higher-timeframe read of trend and macro drivers can still set the direction for intraday trades, as long as each trade is opened and closed in one session.
On our accounts, all positions must be closed by 4:45 PM ET (12:59 PM ET on holiday early closes), and overnight, weekend and swing holds are not allowed on any account type. A position can run for a full trading day, which goes from 6:00 PM to 5:00 PM ET, but not past it. Our funded accounts are simulated.
Position Trading FAQ
What is position trading with an example?
Position trading holds a trade for weeks to months to capture a sustained trend. For example, a trader who expects a long uptrend in an index might buy a micro index future, set a stop several daily ranges below the entry, and hold for about six months unless the stop or the thesis fails.
What are the positions in trading?
A position is an open trade. A long position profits if price rises, and a short position profits if price falls. In futures, you are flat when you hold no position.
How long is position trading?
Position trades usually last from several weeks to several months, and sometimes more than a year. There is no fixed cutoff, and the reason for the hold matters more than the label.
Can I make $100 a day day trading?
No trading style can promise a daily amount, and many traders lose money. For scale, $100 is 2 points on one ES contract or 20 points on one MES contract before commissions. A losing day can be larger than a winning one, so a daily income target can push traders into forced trades.
Is position trading profitable?
It can be, but no style is profitable by itself. In this article's study of Yahoo Finance S&P 500 data from November 2021 to November 2026, six-month long holds finished higher 78.19% of the time in a rising market, yet the median one went 4.39 ATR against the entry first. Results depend on the market, the rules and whether the trader can hold to the plan.
Can you position trade futures?
Yes, in a standard futures brokerage account. You'll need to post overnight margin and roll the position before each contract expires. Many funded futures accounts require positions to be closed every session, which rules position trading out there.
Is position trading good for beginners?
It can be, because it needs less screen time and fewer decisions. The harder parts are sitting through large open drawdowns and waiting a long time for feedback, so beginners should start with micro contracts and a written plan.
This article is educational and is not investment advice or a recommendation to trade any instrument. Futures and other leveraged products can lose more than expected, and holding positions for weeks or months adds gap, margin and roll risk. The holding-window study is historical, uses index data without costs or an entry rule, and past results do not predict future ones. Funded and evaluation accounts are simulated and differ from live trading. Trade only with money you can afford to lose and confirm contract specifications, margin and account rules with your provider.


