



TL;DR: How to learn futures trading comes down to order: contract math first, position sizing second, one setup third, self-review last. Spend 12 weeks on one micro contract, advance only when each stage's test is passed, and log at least 20 simulated trades. A 20-trade sample tells you whether you followed the plan, not whether you have an edge.
Most people who want to learn futures trading do not have an information problem. Free lessons are everywhere, and plenty of them are accurate. The real problem shows up a few weeks in: you have watched hours of video, you know what a pullback is, and you still could not say how many contracts to trade or whether your last ten trades mean anything.
What is missing is an order of operations and a way to tell whether a stage is finished.
So this guide is built as a sequence with gates. Each stage produces something you can check, and each gate is a test you can fail. Failing one early is cheap. Failing it after you have added size is not.
Related lesson: Futures trading beginner guide
How to Learn Futures Trading in Four Layers
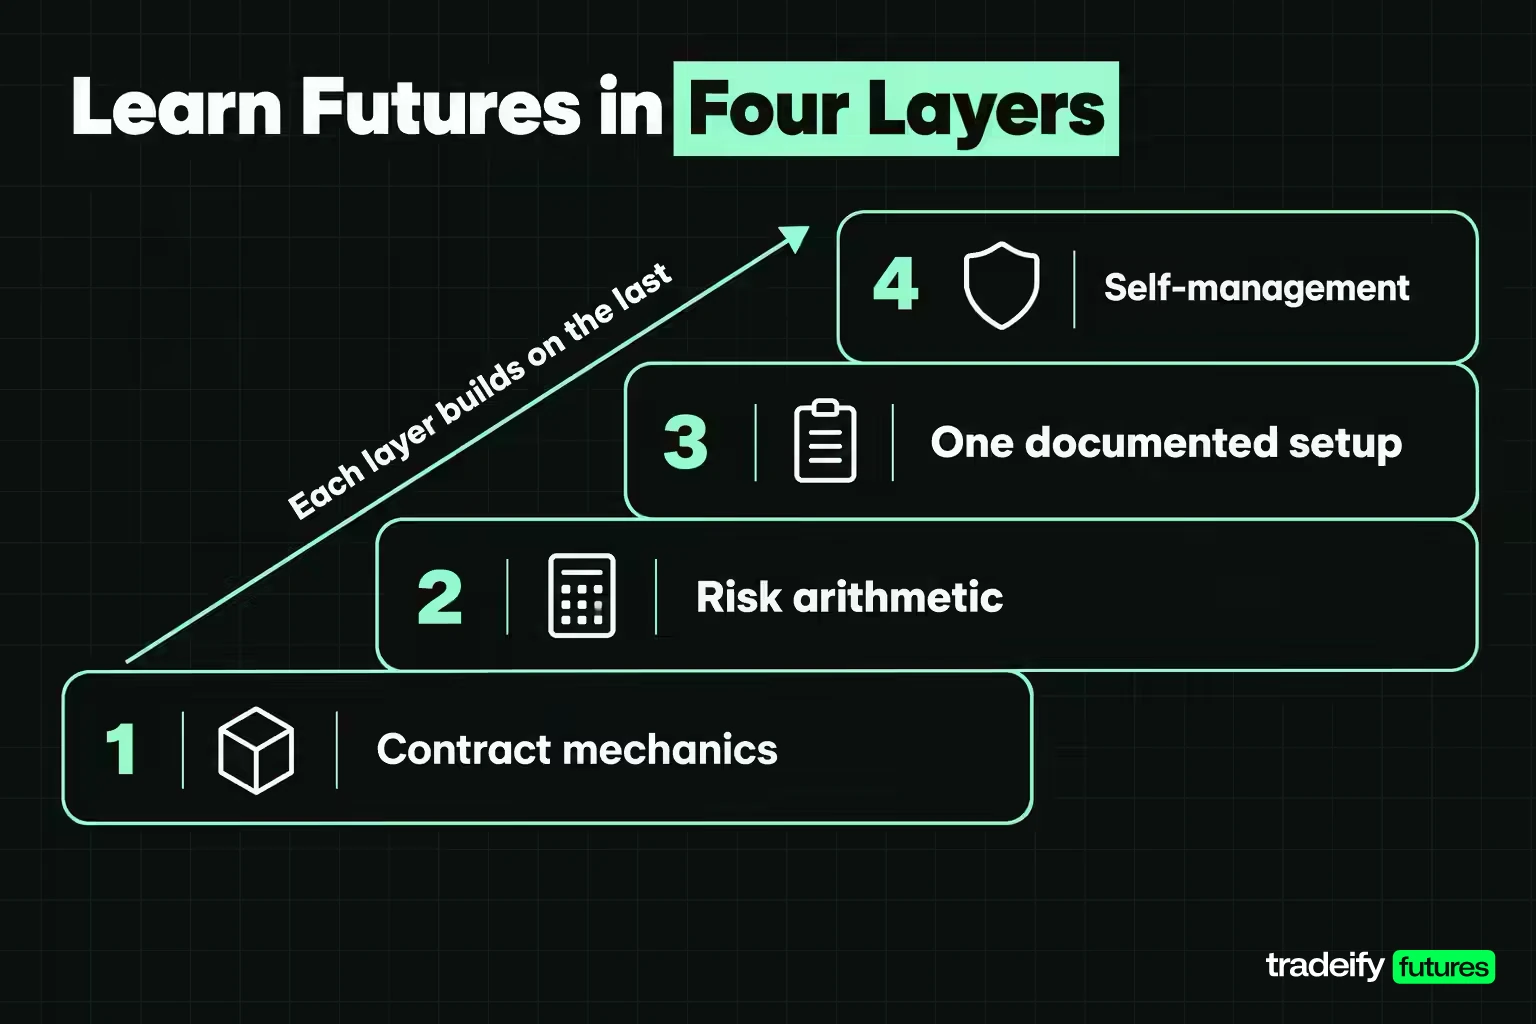
Learning futures trading works best in four layers, and each one changes what the next one means.
- Contract mechanics. What the contract is, what one tick is worth, how the multiplier turns a price move into dollars, and how margin works. Get this wrong and every risk number after it is wrong.
- Risk arithmetic. Position size from account equity, stop distance and dollars per point, decided before the entry. This is the layer most beginner material waves at with a single "risk 1 to 2%" sentence.
- One documented setup. One market, one session and one reason to enter, written as if/then rules with an entry, a stop, a target and a condition that cancels the idea.
- Self-management. The rules that stop a bad day from turning into a bad month: a daily stop, a review habit and a written response to losing streaks.
Here is why the order matters. A beginner who learns chart patterns first has nothing to attach them to. On the Micro E-mini S&P 500 (MES), a 10-point move is $50 per contract. On the E-mini S&P 500 (ES), the same 10 points is $500. The chart looks identical. The decision is not.
Most free curricula cover the first layer well and the third reasonably well. The second usually gets one line, and the fourth is often missing. This plan gives those two layers their own weeks.
The 12-Week Plan to Learn Futures Trading
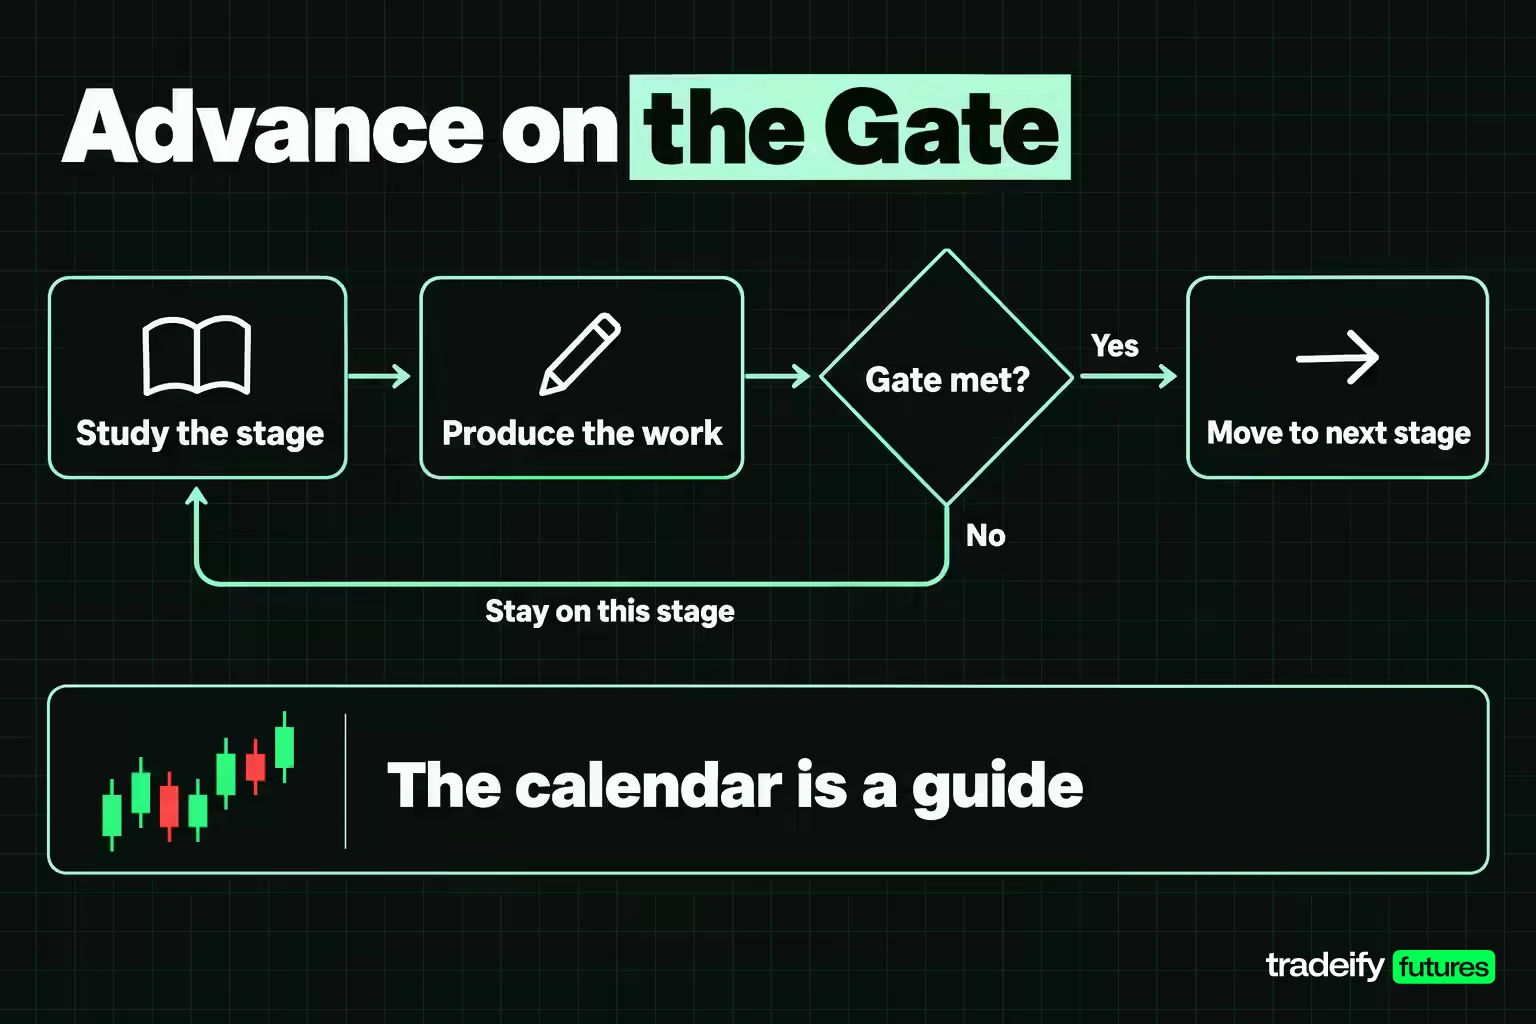
The 12-week plan assumes five to eight hours a week, which is 60 to 96 hours in total. The calendar is a guide. The gate is the rule: you move on when the gate is met, not when the week ends.
| Weeks | Focus | What you produce | Gate to advance |
|---|---|---|---|
| 1 | Contract mechanics on one micro contract | A one-page spec sheet in your own words covering multiplier, tick size, tick value, notional value, trading hours and expiration | You can state the dollar value of a 1, 5 and 10 point move without looking anything up |
| 2 to 3 | Margin, leverage and position sizing | The sizing formula written out with your own account size and three worked examples at different stop distances | You can size any trade in under 60 seconds and you never round the contract count up |
| 4 | Broker, platform and order types | A simulated account with bracket orders set up and tested | You have placed, modified and cancelled every order type in simulation without an error |
| 5 | One setup | Written if/then rules for a single setup, including what invalidates it | You can explain the setup in two sentences and mark ten past examples on a chart |
| 6 to 9 | Simulated execution | At least 20 logged trades in one market and one session, each recorded in R with a reason and a screenshot | 20 trades logged, expectancy calculated after costs, and every trade sized by the formula |
| 10 to 11 | Review | A written review naming the rule that cost the most and what you changed | At least one rule changed or removed because of the log, not because of a feeling |
| 12 | Decision | A choice between more simulated trades, a simulated prop evaluation, or live trading at a defined small size | Every item on your pre-size-up checklist is a yes |
How to Use the 12-Week Futures Plan Gates
The 12-week futures plan works only if the gates are treated as tests. Three notes on using them.
Weeks six through nine cost the most attention. Twenty trades sounds small until you write down the reason, stop, exit and result for each one. Without that log there is nothing to review, and the review is the part that changes behavior.
Week 12 does not have to mean real money. Another 20 simulated trades is a fine answer when the log is thin or the rules kept changing.
The plan does not require a paid course. Exchanges, regulators and free broker education cover the material. If you do pay for something, treat its claims as a hypothesis and test them against your own log.
How Futures Contracts Work
A futures contract is a standardized, exchange-traded agreement to buy or sell a set quantity of something at a price agreed today, for settlement on a set future date. The exchange fixes the contract size, tick size, months and settlement terms, so every ES contract is the same as every other ES contract of that month.
Four contract mechanics decide what a single position means for your account.
- Contract size. ES is $50 times the S&P 500 Index. MES is $5 times the index. Crude oil (CL) is 1,000 barrels. Gold (GC) is 100 troy ounces.
- Expiration. Contracts have months and a last trading day. ES and MES trade quarterly (March, June, September, December) and stop trading at 9:30 AM ET on the third Friday of the contract month. CL stops trading three business days before the 25th calendar day of the month before the contract month. Expiry rules differ by product, so check each one.
- Settlement. ES is financially settled (cash), so expiry ends in a cash adjustment. CL, GC, Treasury note futures and corn are deliverable. A day trader is flat long before delivery matters, but a beginner who holds the wrong month into its final days can end up with a problem the broker has to fix.
- Daily settlement. At the end of each session the clearing house sets a settlement price, and gains and losses move between accounts based on it. That is why a losing position can trigger a margin call before you ever close it.
Related lesson: How futures contracts work
Long and Short Futures Positions
Going long a futures contract means you profit if the price rises. Going short means you profit if it falls. In futures, a short is just a sell order that opens a position. There is no borrowing step like there is with shorting stock.
Take an illustrative example on MES at a round 7,000 index level:
- Buy one MES at 7,000 and exit at 7,012: plus 12 points, which is plus $60.
- Sell one MES at 7,000 and exit at 7,012: minus 12 points, which is minus $60.
The math is symmetrical. That makes shorting easy to do, and easy to do badly: a beginner who shorts "because it looks too high" has a direction, not a setup. The entry still needs a reason, a stop and a size.
Types of Futures Contracts and Their Specs
The main types of futures contracts fall into six groups: equity index, energy, metals, interest rates, agricultural and currency futures. Each one has its own contract size, tick and personality. The table uses specifications read from CME Group's contract specification data on November 4, 2026.
| Contract | Group | Contract size | Minimum tick | Tick value | Settlement |
|---|---|---|---|---|---|
| ES E-mini S&P 500 | Equity index | $50 x S&P 500 Index | 0.25 index points | $12.50 | Financially settled |
| MES Micro E-mini S&P 500 | Equity index | $5 x S&P 500 Index | 0.25 index points | $1.25 | Financially settled |
| MNQ Micro E-mini Nasdaq-100 | Equity index | $2 x Nasdaq-100 Index | 0.25 index points | $0.50 | Financially settled |
| CL Crude Oil | Energy | 1,000 barrels | $0.01 per barrel | $10.00 | Deliverable |
| MCL Micro WTI Crude Oil | Energy | 100 barrels | $0.01 per barrel | $1.00 | Financially settled |
| GC Gold | Metals | 100 troy ounces | $0.10 per ounce | $10.00 | Deliverable |
| MGC Micro Gold | Metals | 10 troy ounces | $0.10 per ounce | $1.00 | Deliverable |
| ZN 10-Year T-Note | Interest rates | $100,000 face value | Half of 1/32 of a point | $15.625 | Deliverable |
| ZC Corn | Agricultural | 5,000 bushels | 1/4 cent per bushel | $12.50 | Deliverable |
| 6E Euro FX | Currency | 125,000 euro | 0.00005 per euro | $6.25 | Physical delivery |
The micro contracts are why the first 12 weeks should run on a micro. The tick is the same size as the full contract's tick, but each tick is worth a tenth as much, so a sizing mistake costs a tenth as much too.
For a first market, equity index micros are the common choice because they trade nearly around the clock and the arithmetic is simple. That is a convenience, not a rule. What matters is picking one market and staying on it until the gates are met.
Futures Ticks, Tick Values and Symbols
Every futures price moves in ticks. Tick value is the dollars one tick is worth on one contract, and the multiplier converts a full point into dollars.
- MES: 0.25 points per tick, $1.25 per tick, $5 per point.
- ES: 0.25 points per tick, $12.50 per tick, $50 per point.
- At an illustrative 7,000 index level, one MES controls $35,000 of index exposure and one ES controls $350,000.
- At an illustrative $70 crude price, one CL controls $70,000 of oil and a $1 move is $1,000. One MCL controls $7,000 and the same $1 move is $100.
- At an illustrative $4,000 gold price, one GC controls $400,000 and a $1 move is $100. One MGC controls $40,000 and a $1 move is $10.
Futures symbols combine a root, a month code and a year. The month codes are F (January), G (February), H (March), J (April), K (May), M (June), N (July), Q (August), U (September), V (October), X (November) and Z (December). ESZ6 is the December 2026 E-mini S&P 500, and ESH7 is March 2027. Many platforms also show a continuous chart symbol for analysis, which is a convenience for charts rather than the contract you actually trade.
Related lesson: Tick size and tick value
Futures Margin and Leverage
Futures margin is a good-faith deposit, not a down payment. The CFTC's glossary says it plainly: margin "is not partial payment on a purchase," and it is also called a performance bond. You post initial margin to open a position and must keep maintenance margin on deposit while it is open.
Leverage comes from the gap between that deposit and the contract's full value. Take a hypothetical round margin of $2,500 on one MES (a made-up number for the math, not a CME or broker figure):
- At an illustrative 7,000 index level, one MES is $35,000 of exposure, so the position is 14 to 1 leverage on the deposit.
- A 1% index move is 70 points, or $350, which is 14% of the $2,500.
- A 5% index move is 350 points, or $1,750, which is 70% of the $2,500.
That is the core lesson of the margin layer. A small market move becomes a large account move, and the low deposit is exactly what makes a too-large position feel affordable. The exchange sets margin levels and changes them when volatility changes, and brokers can add their own requirement on top. Read the current figure from the exchange or your broker on the day you trade, never from an old video or article.
Because accounts are settled daily, a losing position reduces your account balance every session. If equity falls below maintenance, the broker can ask for more money or close the position. The standard risk disclosure that US futures brokers must give before opening an account warns that you "may sustain a total loss of the funds that you deposit" and that "you may incur losses beyond these amounts."
Futures Risk Management Starts With Position Size
Futures risk management starts with one formula, and it decides more than any chart pattern.
Dollars at risk = stop distance in points x dollars per point x number of contracts
Set the dollar risk first, then solve for contracts, and round down. A fractional contract does not exist, and rounding up quietly breaks your own rule. The math says 1.6 contracts, the setup looks great, and two feels close enough. That is the exact moment the rule exists for.
Here is that formula on MES with a 10-point stop ($50 of risk per contract) and a 1% risk target.
| Account size | 1% risk budget | MES contracts at a 10-point stop | Actual risk | Risk as share of account |
|---|---|---|---|---|
| $2,500 | $25 | 0 (no size fits) | $0 | 0% |
| $5,000 | $50 | 1 | $50 | 1.00% |
| $10,000 | $100 | 2 | $100 | 1.00% |
| $25,000 | $250 | 5 | $250 | 1.00% |
| $50,000 | $500 | 10 | $500 | 1.00% |
The top row is the uncomfortable one. At $2,500, one MES with a 10-point stop is already 2% of the account. The honest answer is that no valid size exists for that trade under a 1% rule.
Stop Distance and Futures Contract Count
Stop distance matters as much as account size when sizing futures. Here is a $5,000 account with a $50 budget on MES.
| Stop distance | Risk per MES contract | Contracts at a $50 budget | Actual risk | What it means |
|---|---|---|---|---|
| 2 points (8 ticks) | $10 | 5 | $50 | More contracts, but the stop sits inside ordinary noise |
| 4 points (16 ticks) | $20 | 2 | $40 | Leaves $10 of the budget unused |
| 10 points (40 ticks) | $50 | 1 | $50 | Fits the rule exactly |
| 20 points (80 ticks) | $100 | 0 | $0 | Exceeds the budget, so the trade is skipped |
Two lessons come out of the second table. A tighter stop buys more contracts at the same dollar risk, but it is easier to hit by random movement, so stop placement and contract count cannot be chosen separately. And when the stop the setup needs does not fit the budget, there are three choices: skip the trade, use a smaller contract, or break the rule. Only the first two keep the plan intact.
For scale, one ES with a 10-point stop risks $500, which is 10% of a $5,000 account on a single trade. That is the clearest reason the E-mini is a poor first contract even though nothing stops a beginner from trading it.
How Losing Streaks Hit a Futures Account
Losing streaks are where the risk percentage earns its keep. Six losses in a row, compounding, cost:
- About 5.9% of the account at 1% risk per trade.
- About 11.4% at 2% risk per trade.
- About 26.5% at 5% risk per trade.
A run of six losses is ordinary for a method that wins less than half the time. Set the risk percentage before the sample starts, not after a good week makes a bigger number feel safe.
Related lesson: Position sizing futures contracts
Choosing a Futures Broker and Trading Platform
Futures brokers and trading platforms are two separate choices that often arrive bundled. The broker holds the account and the money. The platform is the software you chart and place orders on, and it connects to the broker through a data and order feed.
On the broker side, US futures firms come in two main registration types. A futures commission merchant (FCM) accepts orders and holds customer money. An introducing broker (IB) accepts orders but does not hold customer money; it passes accounts to an FCM. Either way, check the firm and its people in NFA BASIC, the National Futures Association's free background database, before you send a dollar.
On the platform side, a beginner needs fewer features than marketing suggests. Check for these:
- A simulation mode on live data, so weeks four through nine cost nothing but time.
- Bracket orders that attach a stop and a target the moment the entry fills.
- A price ladder (DOM) that shows working orders clearly and lets you cancel fast.
- Clear market data terms. Real-time exchange data often needs a data agreement or subscription, and depth-of-book data usually costs extra.
- Exportable trade history, because the review weeks depend on it.
Pick one platform and learn it before week six. Order-entry mistakes are a skill problem, and they show up in the log as losses that have nothing to do with the setup.
Opening a Futures Account
Opening a futures account follows a predictable path. The firm must collect identity details (at minimum name, date of birth, address and an identification number) under its customer identification rules. Before the account opens, it must hand you the futures risk disclosure statement and get your signed acknowledgment. NFA Rule 2-30 also requires the firm to ask for your estimated annual income, net worth, age and previous trading experience, so it can explain the risks that fit your situation.
Read the risk disclosure rather than clicking through it. It is the one document in the process written to tell you what can go wrong.
Futures Order Types to Practice First
Futures order types decide what you are guaranteed: a fill, a price, or neither. Learn what each one promises before the first simulated trade.
- Market order. Fills right away at the best available price. The price is not guaranteed, and in a fast market it can be worse than the last trade you saw.
- Limit order. Fills only at your price or better. The fill is not guaranteed, and price can touch your level without filling you.
- Stop order. Becomes a market order once the stop price trades. The SEC's order-type bulletin is blunt about it: the stop price is not the guaranteed execution price. In a fast move it can fill well past the stop.
- Stop-limit order. Becomes a limit order at the trigger. It controls price but may not fill at all, which is a dangerous trade-off for a protective stop.
- OCO (one cancels other). Two linked orders where a fill on one cancels the other.
- Bracket order. An entry with a stop and a target attached as an OCO pair, so the exit plan exists the moment you are in.
A DAY order on CME Globex is cancelled if it has not filled by the end of that trade date, which is worth knowing before you leave orders working.
In week four, drill the boring parts: place a bracket, move the stop, cancel a working order, flatten a position. Do it until it is dull. A trader who fumbles an exit under pressure has an execution problem, not a strategy problem, and no amount of chart study fixes it.
Related lesson: Bracket orders
Day Trading Futures and Market Hours
Day trading futures means opening and closing positions within the same session, with nothing held overnight. Most beginners who learn futures end up here, because micro contracts and nearly 24-hour sessions make it accessible.
The hours are a big part of that. ES trades on CME Globex from Sunday 6:00 PM to Friday 5:00 PM ET, with a daily maintenance break from 5:00 PM to 6:00 PM ET. Crude oil runs on the same clock (5:00 PM to 4:00 PM CT with a 60-minute break). Not every market works that way: corn trades from 7:00 PM to 7:45 AM CT and again from 8:30 AM to 1:20 PM CT. Check the hours for your market before you plan a session around it.
Nearly 24 hours of trading does not mean 24 hours of useful trading. Volume and movement cluster around certain windows, and a beginner learns faster by picking one window, the same one every day, so the trades in the log are comparable.
Is day trading a good fit for a beginner? It can be, as a learning format, because each session ends flat and the feedback is fast. As an income plan, the evidence is harsh. Investor.gov warns that day trading "is extremely risky and can result in substantial financial losses in a very short period of time." A study by Chague, De-Losso and Giovannetti, "Day Trading for a Living?", followed Brazilian equity index futures day traders and found that of the 1,551 who kept going for more than 300 days, 97% lost money net of fees, and only 1.1% earned more than the Brazilian minimum wage.
That is not a reason to skip learning. It is a reason to treat the first year as training, sized so the cost of mistakes stays small while the skills are still forming.
Related lesson: Futures trading sessions and daily maintenance window
Futures Trading Strategies and Technical Analysis for a First Setup
Futures trading strategies for a first setup should be simple enough to write in two sentences. Most beginner setups come from three families, and each one needs only a few technical tools.
| Strategy family | The idea | Technical tools it uses | What invalidates it |
|---|---|---|---|
| Trend pullback | Join an established move after a pause | Higher highs and higher lows, a moving average, prior swing levels | Price breaks the last swing low in an uptrend (or high in a downtrend) |
| Breakout | Trade the move out of a defined range | Range high and low, volume on the break | Price returns inside the range and holds there |
| Range or mean reversion | Fade moves to the edges of a balanced range | Support and resistance, the session's high and low | Price closes beyond the range edge with follow-through |
Technical analysis in this plan has one job: define where the trade is wrong. Support and resistance give you a stop location. A trend structure tells you which side to favor. Indicators add confirmation, but adding a third or fourth one rarely creates an edge that the first two lacked.
Write the setup as rules:
- If price is in an uptrend on the 5-minute chart and pulls back to the prior swing high, then buy on the first bar that closes back up.
- Stop below the pullback low. Target at 2R or the session high, whichever comes first.
- Invalid if price closes below the prior swing low before entry, or if the stop the setup needs does not fit the size budget.
That last line ties strategy back to risk. A setup that only works with a stop your account cannot afford is not a setup you can trade yet.
You can read the direction correctly and still have no valid entry. Those are two separate decisions, and the log should record them separately.
Related lesson: Technical analysis beginner guide
Writing a Futures Trading Plan
A futures trading plan is the written version of every decision you would otherwise make in the moment. It exists because decisions made mid-trade are made under pressure, and pressure is when rules get bent.
A first plan needs these parts, each with a reason:
- Market and contract. One micro contract, so the dollar math stays fixed while you learn.
- Session. One time window, so the trades in the sample are comparable.
- Setup. The if/then rules, including invalidation.
- Risk per trade. A fixed percentage or dollar amount, and the sizing formula that turns it into contracts.
- Daily stop. A loss amount or number of losing trades that ends the day. It exists because the trade after two quick losses is the one most likely to break the rules.
- Trade limit. A maximum number of trades per session, which keeps a slow market from turning into forced activity.
- Journal fields. Date, setup, entry, stop, exit, result in R, a screenshot and one line on whether you followed the plan.
- Review cadence. When you read the log (weekly) and when you are allowed to change a rule (only at review, never mid-session).
The plan should be short enough to read before every session. If it takes ten minutes, it will not get read on the days it matters most.
Related lesson: How to create a trading plan
Testing Your First 20 Futures Trades
Testing your first 20 futures trades is the step that separates a learning process from a hobby. Record every trade as a multiple of the amount risked, which is what R means. A trade that makes twice its risk is plus 2R. A full stop-out is minus 1R. A scratch is near zero.
Here is a constructed 20-trade sample, built for the arithmetic and not taken from real results. It uses $50 of risk per trade and an assumed all-in cost of $2.50 per round turn (substitute your own figure).
| Metric | Value | How it is derived |
|---|---|---|
| Trades | 20 | 8 winners and 12 losers in one market and one session |
| Win rate | 40% | 8 divided by 20 |
| Average winner | 1.78R | 14.25R of wins divided by 8 |
| Gross result | 3.05R | 14.25R of wins minus 11.20R of losses |
| Cost drag | 1.00R | $2.50 divided by $50 is 0.05R per trade, times 20 |
| Net result | 2.05R | 3.05R minus 1.00R |
| Expectancy | 0.1025R per trade | 2.05R divided by 20, or $5.13 per trade at $50 of risk |
| 95% range on expectancy | -0.51R to +0.71R | Standard deviation of 1.39R divided by the square root of 20, times 1.96 |
| 95% range on win rate | 18.5% to 61.5% | Standard error of 10.95 percentage points, times 1.96 |
| Break-even win rate at 2R | 35.00% | 33.33% before costs, raised by the 0.05R cost per trade |
At first glance this looks like a working method: 40% winners, a near-2R average win and a positive net result. The interval says otherwise. The expectancy range runs from minus 0.51R to plus 0.71R, which includes zero. This sample fits a real edge and no edge equally well.
One rough week would not prove the method broken, and one good week would not prove it works. How many trades would it take to tell? If the mean and spread stayed exactly the same, the 95% interval would clear zero only after about 709 trades, roughly 700. That number is the honest answer to "when do I know it works?" It is also why the 20-trade gate tests process (did you follow the rules, size correctly, log everything), not profitability.
Costs and Break-Even in Your First Futures Trades
Costs hit small stops hardest. The same $2.50 round turn is 0.05R on a $50 stop, 0.125R on a $20 stop and 0.025R on a $100 stop. On a 2R target, that moves the break-even win rate from 33.33% with no costs to 35.00%, 37.50% and 34.17% respectively.
So a scalping-style setup with tight stops needs a noticeably higher win rate just to stand still. Put your real commission and fees into the log from trade one, so the expectancy you calculate is the one you would actually earn.
Related lesson: Trading expectancy
Futures Compared With Stocks and CFDs
Futures differ from stocks and CFDs in ways that change how a beginner should learn them.
| Feature | Futures | Stocks in a margin account | CFDs |
|---|---|---|---|
| Where it trades | Regulated futures exchanges | Stock exchanges | Off-exchange with a dealer, outside the US |
| What margin means | A performance bond, settled daily | A loan from the broker | A dealer deposit |
| Day-trading rule | No pattern day trader rule | Pattern day trader rule, now being replaced | Set by the dealer and local regulator |
| Shorting | A sell order opens a short | Requires borrowing shares | Dealer allows long or short |
| US retail access | Yes, through a registered futures broker | Yes | Not allowed off-exchange |
The day-trading row answers a common question. The $25,000 minimum comes from FINRA's pattern day trader rule for stock margin accounts. Futures were never under that rule. FINRA has also adopted new intraday margin standards that replace the old day-trading requirements, including the $25,000 minimum: effective June 4, 2026, with a phase-in that ends October 20, 2027. During the phase-in, some stock brokers may still apply the old rule.
On CFDs, the CFTC treats leveraged retail CFDs as swaps, and US retail traders may not enter them unless they are offered on a designated contract market. That is why US traders who want leveraged index or commodity exposure end up in futures.
Tax treatment also differs. In the US, regulated futures contracts fall under section 1256 of the tax code: gains and losses are treated as 60% long-term and 40% short-term and marked to market at year end. Rules depend on your situation, so check with a tax professional.
Related lesson: Futures vs stocks
Simulated, Evaluated and Live Futures Trading
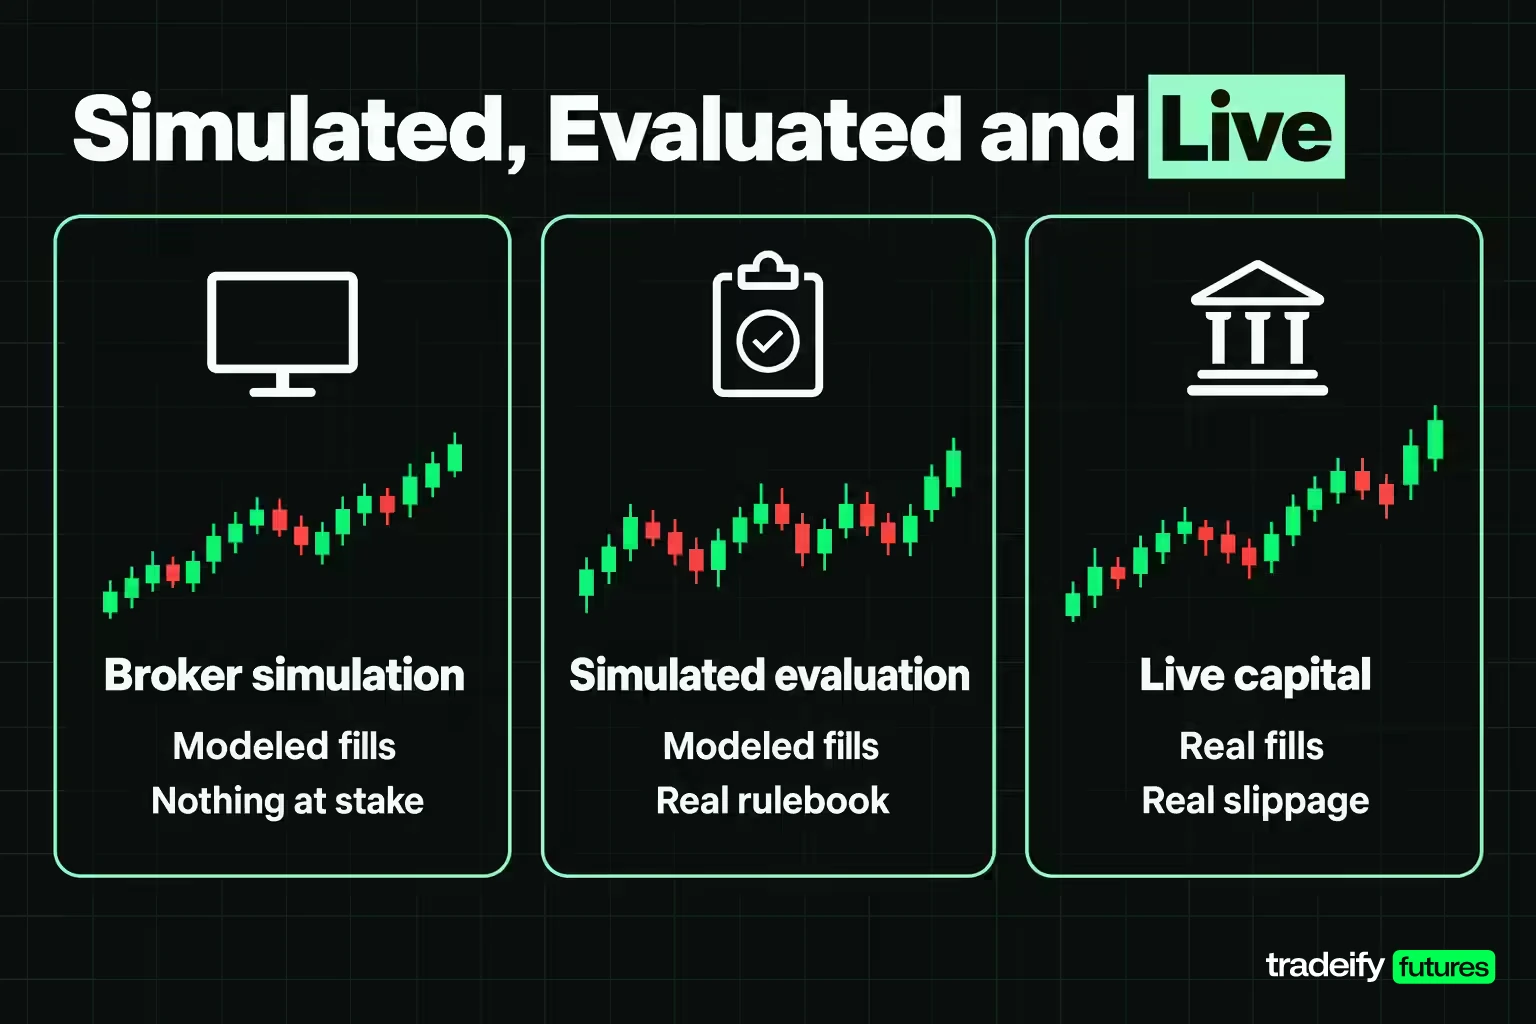
Simulated, evaluated and live futures trading are three different conditions, and the lessons from one transfer to the next only partly.
Broker simulation. Fills are modeled on live prices. A simulator often fills you better than the market would, especially limit orders that the price only touched and stops in fast moves. Nothing is at stake, so the emotional side of trading barely shows up.
A prop firm's simulated evaluation or funded account. Simulated capital under a rulebook. The fills are still modeled, but the rules are real and specific to each firm: daily loss limits, drawdown rules, consistency rules and permitted trading hours differ between programs and change over time. Read the current rulebook of the account itself, because the rule traders break is usually the one they skimmed.
Live brokerage capital. Real fills, real slippage, real margin calls, and no rulebook beyond the market and your broker. It is the only condition where every lesson applies in full, which is why the simulated phase is practice rather than proof. Expect the first live trades to feel different even at one micro contract. Hesitating on an entry you would have taken in simulation is normal, and it belongs in the log like anything else.
On our accounts at Tradeify, evaluations and funded accounts are simulated, every position must be closed by 4:45 PM ET, and size is set by contract limits rather than margin (for example, a 50K account allows up to 4 minis or 40 micros, with 10 micros counting as one mini). Those limits make the sizing formula a daily habit rather than a one-off calculation.
Futures Education Red Flags
Futures education attracts sellers who promise more than any course can deliver. The CFTC suggests starting with free material from public institutions, nonprofits and regulated organizations such as exchanges, and lists the warning signs to watch for:
- Promises of big returns.
- Easy answers and secret tricks.
- Claims of past success you cannot verify, including student testimonials.
- Urgency, such as "only a few seats left."
- A "free" seminar that turns into a pitch for paid training.
- Large upfront commitments before you can judge the quality.
The CFTC also suggests checking whether instructors who are brokers or professionals are registered and have clean disciplinary histories. A good test of any course is whether its claims hold up in your own log.
Related lesson: Practice with paper trading
Common Mistakes Beginners Make With Futures
The mistakes beginners make with futures are predictable, and most of them are sequencing errors rather than gaps in knowledge.
| Mistake | What it looks like | Why it happens | The fix |
|---|---|---|---|
| Learning in the wrong order | Months of chart patterns before ever calculating dollars at risk | Strategy content is more interesting than arithmetic | Put sizing in weeks two and three, before any setup |
| Sizing from conviction | Five contracts because the setup looked strong | Stop distance and contract count get chosen separately | Fix the risk first, derive the count, round down |
| Starting on the full-size contract | One ES and a 10-point stop on a $5,000 account | The full-size contract is the one people hear about | Learn on the micro, where each tick is a tenth of the value |
| Judging a method on a few trades | Adding size after five green days | Five wins feel like proof | Read the interval, not the average, and expect hundreds of trades for a verdict |
| Ignoring costs | Expectancy calculated before commission and fees | A few dollars look trivial next to the risk | Express costs in R and fold them into the break-even win rate |
| Treating simulation as proof | Expecting live results to match simulated fills | Simulators fill better than markets | Track the gap between simulated and live fills once real money is involved |
Related lesson: Common beginner trading mistakes
Checklist Before Trading Futures With More Size
Run this futures checklist before adding contracts, moving from simulation to a prop evaluation, or moving to live capital. Every item is a yes or a no.
- You can state your contract's multiplier, tick size, tick value and approximate notional value without looking them up.
- You can calculate dollars at risk at the stop in under 60 seconds, and you do it before every entry.
- Your stop distance and contract count both fit a risk percentage you wrote down in advance.
- You have at least 20 logged trades in one market, one session and one setup, recorded in R.
- You know your expectancy after costs and the range around it, not just the average.
- You have lived through a losing streak in the log without changing size or rules mid-streak.
- You can name the rule that cost you the most and have already changed or removed it.
- You have read the current margin requirement for your contract and, if a firm is involved, the full rulebook for that account.
If any answer is no, the next step is more simulated trades on the same plan, not a bigger position.
Related lesson: Risk management for traders
Futures Trading Questions From Beginners
How long does it take to learn futures trading?
The mechanics take about a week and the sizing formula an afternoon. Judging whether a method works takes far longer: a 20-trade sample cannot separate an edge from luck, and a clear verdict can take hundreds of trades. A 12-week plan gets you to a reviewable record and a decision point, not to mastery.
Can I teach myself futures trading?
Yes. Exchanges, regulators and broker education cover everything a beginner needs, and the CFTC suggests starting with free material from those sources. What self-teaching usually lacks is structure, so set gates for each stage and keep a trade log that you review every week.
Is $100 enough to trade futures?
Not under any risk rule that survives a losing streak. One MES with a 10-point stop risks $50, which is half of a $100 account, and 1% of $100 is $1, less than one $1.25 MES tick. A $100 account would also need to meet the broker's margin requirement, so it is better spent on time in a simulator.
Do you need $25,000 to trade futures?
No. The $25,000 figure comes from FINRA's pattern day trader rule for stock margin accounts, and futures were never subject to it. That rule is itself being replaced by new intraday margin standards, with a phase-in ending October 20, 2027. Futures still require the margin set by the exchange and your broker.
Can you make $1,000 a day trading futures?
It is possible on a given day, but not something any method can promise, and chasing it is how small accounts get oversized. One MES needs a 200-point move to make $1,000 and one ES needs 20 points, while a $1,000 winner at 2R means risking $500, or 10% of a $5,000 account. Set a risk percentage and a process instead of a daily dollar target.
Futures trading involves substantial risk of loss and is not suitable for everyone. Leverage means a small market move can produce a large loss, and losses can exceed the money you deposit. Simulated, evaluation and prop firm funded accounts are simulated, and simulated results do not reflect real fills or real trading. The sample figures in this guide are illustrative. Nothing here is investment advice or a recommendation to trade any contract; check current specifications, margins and account rules with the exchange, your broker or the firm before you trade.


