.svg)

.svg)
.svg)


TL;DR: A losing streak calculator estimates how often consecutive losses may occur under stated assumptions. With a 50% loss probability, the chance that the next five independent trades all lose is 3.125%. The chance of encountering a five-loss run somewhere in a longer sample is much higher and requires a run-probability calculation: about 81% over 100 trades, with a median longest streak of six losses. Use streak estimates to stress-test risk and account survival, while allowing for uncertain win rates, correlated losses, costs, and changing market conditions.
Five losses in a row can make a trader question every part of a strategy. Sometimes that reaction reveals a real problem. Sometimes the sequence is an ordinary possibility that was never included in the risk plan.
A losing streak calculator helps separate those possibilities, but only if it answers the right question. “Will the next five trades lose?” and “Will I see five losses in a row during 100 trades?” are very different calculations.
Confusing them can leave you dramatically underprepared for a normal run of losses.
Losing streak calculator
Enter your win rate, how many trades you want to plan for, and the streak length you are worried about. The calculator returns two different probabilities, the typical longest streak for that sample, and the dollar cost of the streak at your planned risk per trade.
Choose the right losing streak inputs
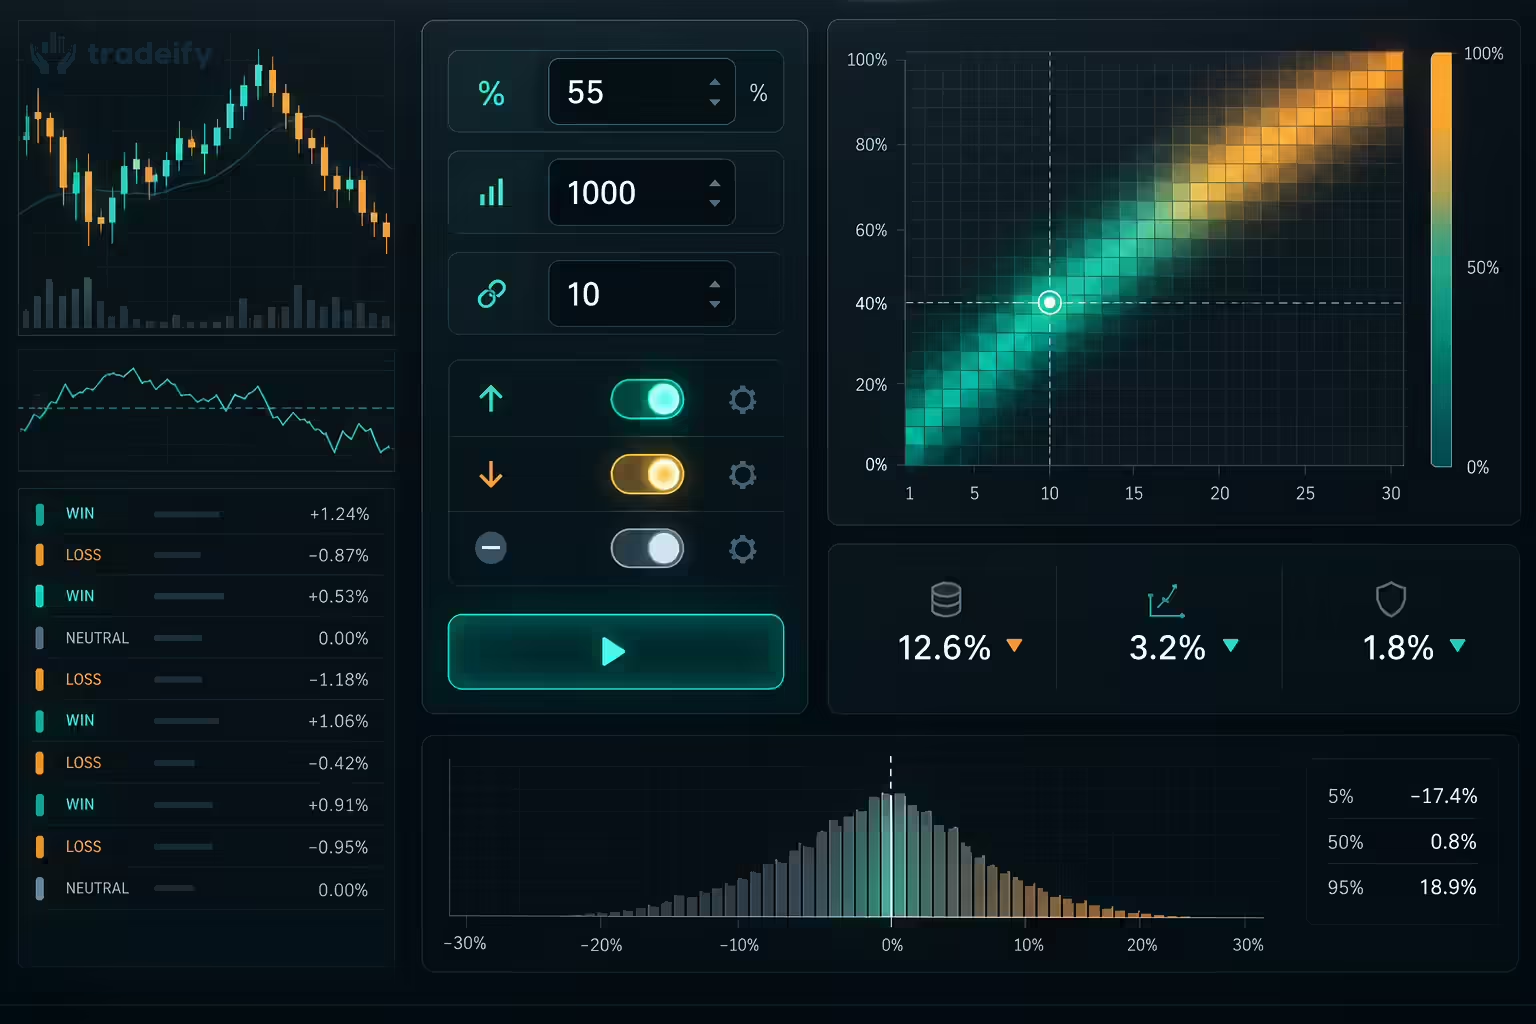
Start with an estimated win rate, a number of trades, and the streak length you want to test. If your strategy has breakeven trades, define how the calculator handles them.
Some tools treat outcomes as simply win or loss. Others allow a neutral result that interrupts a losing streak. Neither convention should be left implicit.
The calculator above pairs win rate with sample length, which is the common setup. Before using any tool’s output, check whether it reports an approximate longest streak, a specified run probability, or something else.
Your historical win rate is an estimate, not a permanent property of the strategy. Test a weaker rate as well, especially if your sample is small or your trading conditions have changed.
Calculate the chance of the next losses
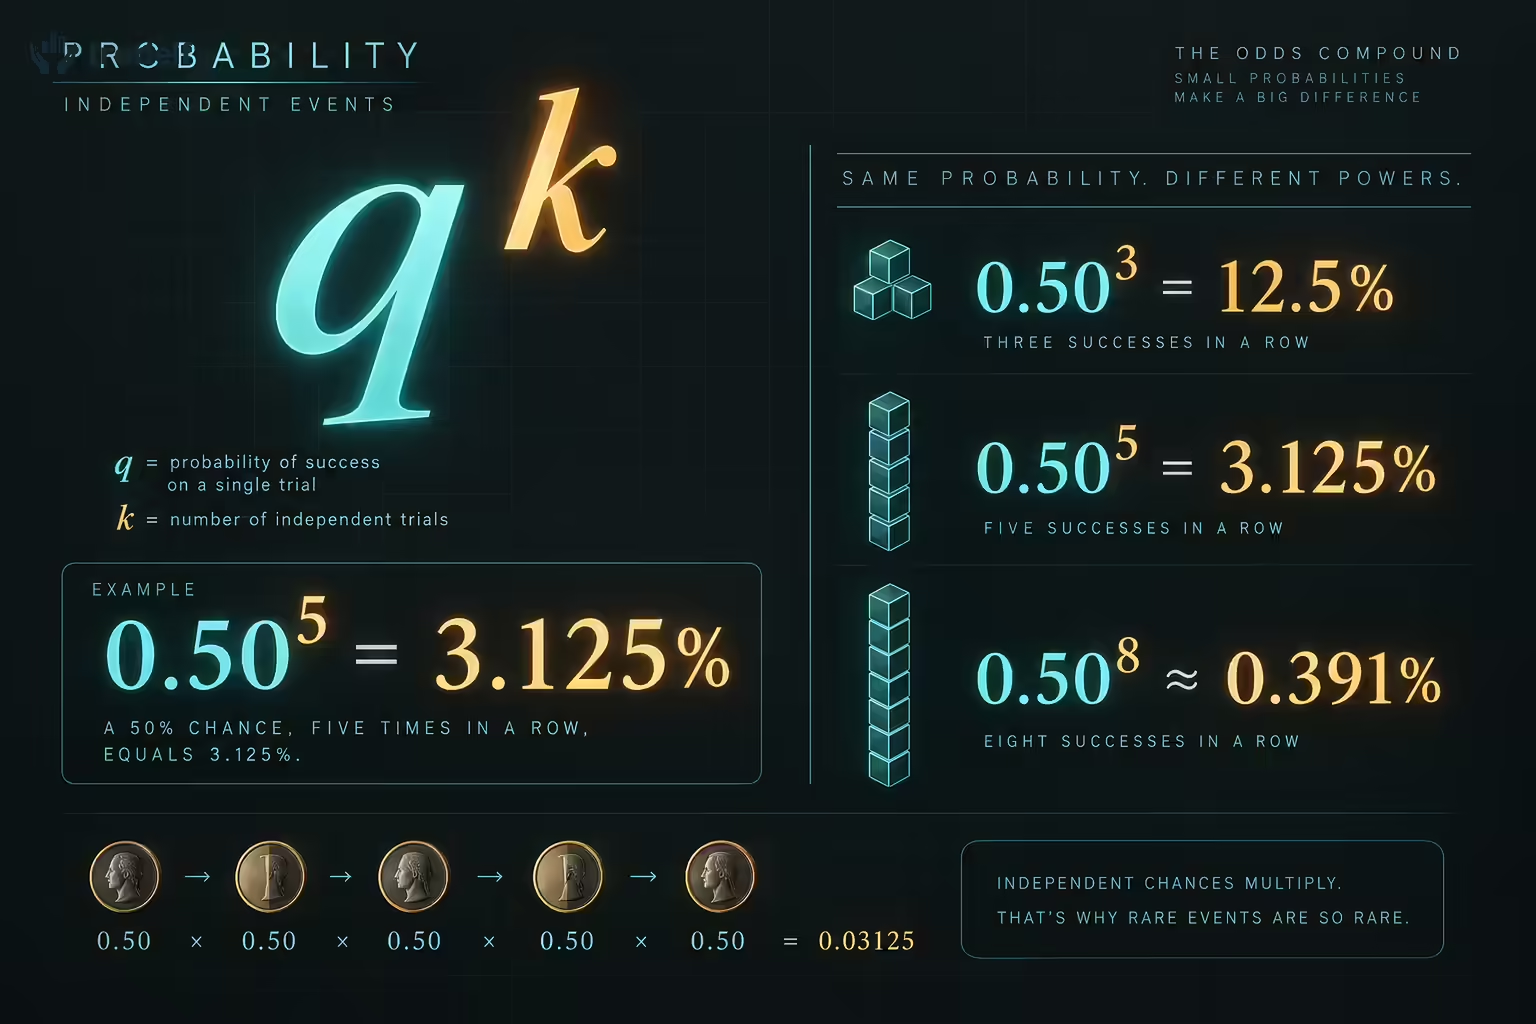
Let q represent the probability of a loss and k the number of consecutive losses. Assuming independent trades and a constant loss probability, the chance that the next k trades all lose is q raised to the power k.
At a 50% win rate, q is 0.50:
- Three specified losses: 0.50³ = 12.5%.
- Five specified losses: 0.50⁵ = 3.125%.
- Eight specified losses: 0.50⁸ = approximately 0.391%.
These figures describe a particular upcoming block. They do not describe the probability of finding at least one such streak anywhere in a much longer sequence.
Also distinguish “at least five consecutive losses” from a run of exactly five bounded by wins. A six-loss run contains five consecutive losses but is not a maximal run of exactly five. Calculator labels need to make that distinction clear.
Calculate a losing streak across many trades
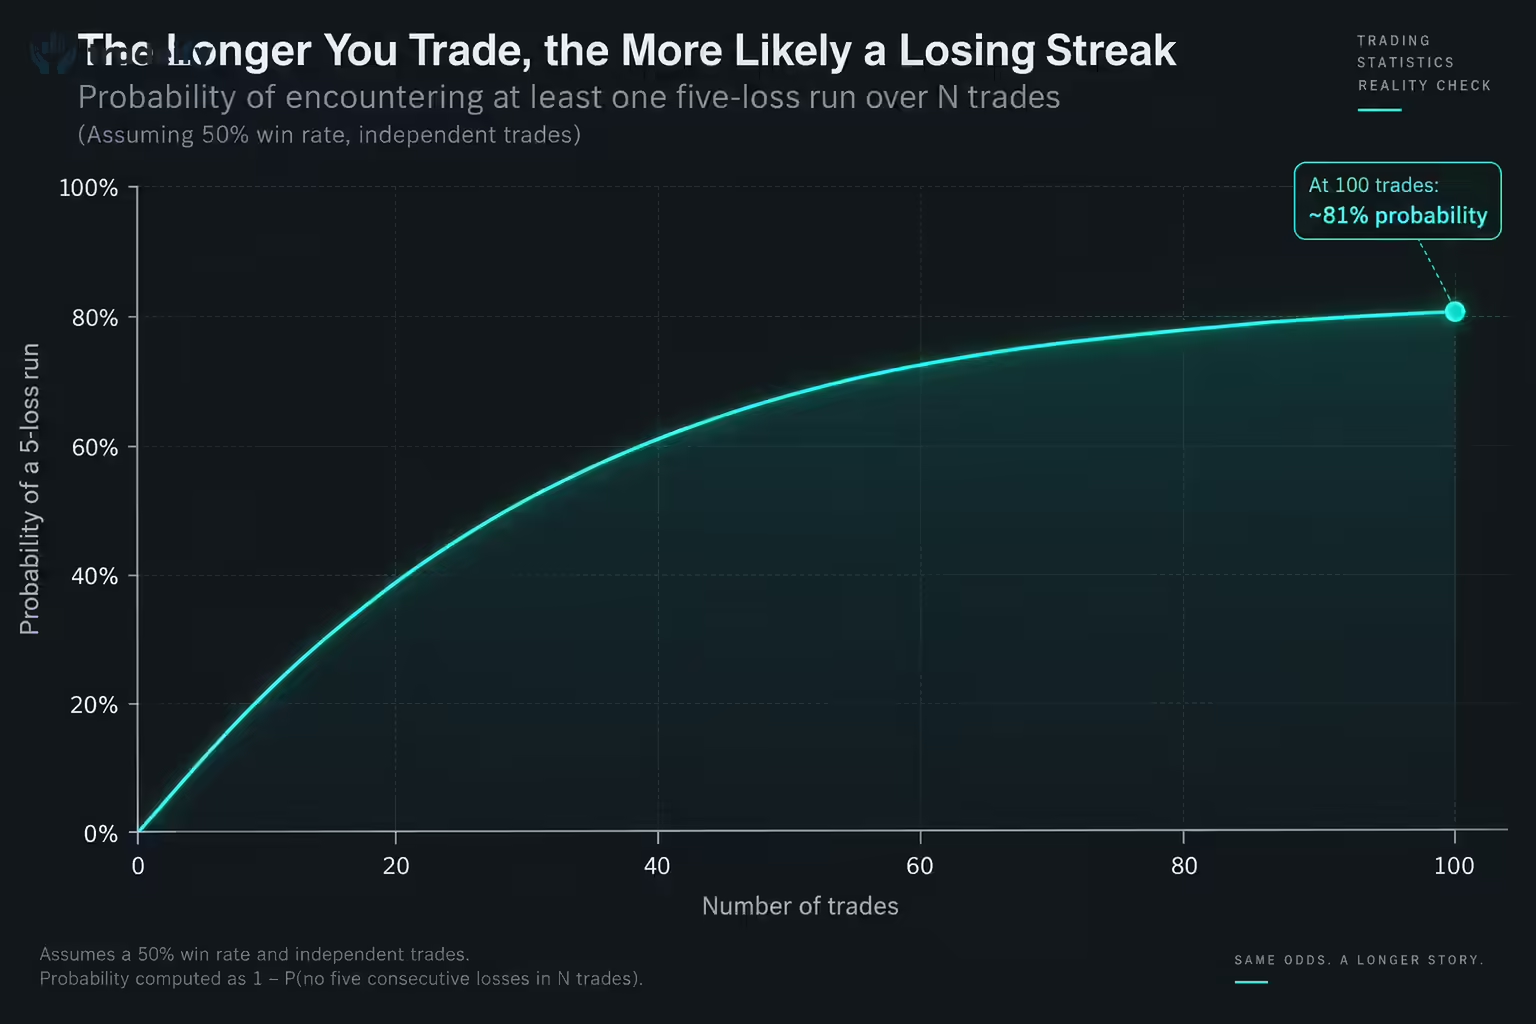
Across a longer sample, there are many opportunities for a streak to begin. Those opportunities overlap, so treating each possible starting point as independent gives an approximation rather than an exact answer.
An exact calculation can track states representing the current run length. For a five-loss threshold, keep probabilities for runs of zero, one, two, three, and four losses, provided the sequence has not already reached five.
Begin with probability 1 in the zero-loss state. For each new trade:
- Move the surviving probability multiplied by the win probability into the zero-loss state.
- Move each state’s probability multiplied by the loss probability into the next run-length state.
- Remove probability that would reach the five-loss threshold.
- Repeat for the full number of trades.
One minus the remaining total probability is the chance of at least one five-loss run. Under the independent 50% win-rate model, that probability over 100 trades is approximately 81%.
That is a very different planning problem from 3.125%. Neither number contradicts the other; they answer different questions.
Normal losing streaks by win rate
The table below uses the same exact run-length method across 100 independent trades. It shows how quickly a normal streak grows as the win rate falls.
| Win rate | Median longest losing streak | Chance of 5+ losses in a row | Chance of 8+ losses in a row | Chance of 10+ losses in a row |
|---|---|---|---|---|
| 40% | 7 losses | 97.6% | 49.0% | 20.5% |
| 50% | 6 losses | 81.0% | 17.0% | 4.4% |
| 60% | 4 losses | 45.9% | 3.6% | 0.6% |
| 70% | 3 losses | 15.3% | 0.4% | Under 0.1% |
A 50% strategy that has never shown six straight losses probably has not been traded long enough yet. A 40% strategy, common for trend-following setups with larger winners, should plan for runs of seven or more as ordinary events rather than warning signs.
Turn a losing streak into an account-risk scenario
Suppose you have a hypothetical $1,200 of usable room above an account’s failure threshold. Your planned loss is $100 per trade before fees and slippage.
Eight full losses would consume $800 before costs. That arithmetic leaves $400 of apparent room, but the plan also needs to account for execution differences and any further movement of the account’s risk threshold.
Do not size a trade so the expected worst streak lands exactly on the failure line. A modeled streak is not a maximum that reality must respect.
With fixed-dollar risk, k full losses cost roughly k times the per-trade loss before costs. With fractional risk against a changing equity base, the calculation differs. After k losses at fraction r, the remaining equity is approximately starting equity × (1 − r)^k, assuming losses are exactly that fraction.
Prop-firm drawdown rules may not behave like an ordinary fixed-equity account. Model the actual floor and its updates separately.
Losing streak assumptions that fail in practice
Trade outcomes are not always independent. Several losses can come from the same unsuitable market condition or from repeatedly entering the same idea.
Your behavior can also connect the trades. Increasing size after a loss or taking a lower-quality setup changes the process the calculator assumed was constant.
Use sensitivity tests. Compare your base win-rate estimate with a lower estimate and consider longer streaks than the central output suggests. A strategy with a 55% historical win rate should not be planned as though 55% is known without error.
Simulation can help when the strategy has varying payoff sizes, serial dependence, or changing risk. Resampling individual trades assumes more independence than resampling blocks, so the simulation method matters too.
Distinguish streak probability from risk of ruin
A losing-streak estimate describes the order of outcomes. Risk of ruin asks whether those outcomes, their sizes, and the account’s constraints can leave you unable to continue. Two strategies with the same win rate can have different ruin risks if one has much larger losses or less drawdown room.
For a simple spreadsheet check on the next specified block, enter win rate in B2 as a percentage and streak length in B3. The formula =(1-B2)^B3 gives the probability that those next B3 trades all lose under the independent, constant-probability model. It does not calculate the chance of finding that run anywhere in a longer history.
At a 60% win rate, the next five losses have a modeled probability of 0.4^5, or 1.024%. Over many opportunities the risk is greater, but it still is not a guarantee. Pair the probability with a dollar-loss scenario, and stress-test larger-than-planned losses as well as longer runs.
Decide how to respond before the losing streak starts
A streak alone does not prove that a strategy stopped working. It also does not prove that continuing unchanged is sensible.
Review whether the trades followed the rules, whether costs or liquidity changed, and whether the market still fits the setup. Define separate responses for ordinary losses and process violations.
A hypothetical plan might stop the session after a preset loss budget, pause immediately after an execution error, and review the strategy after a predefined sample. Those thresholds should come from your testing and constraints, not from a universal trading slogan.
Use a losing streak calculator for preparation
Save the win rate, sample size, streak definition, and method alongside the result. Translate the scenario into dollars, including costs and remaining drawdown room.
Then write what you will do if the sequence occurs. The calculator’s purpose is to make that decision less emotional, not to promise that the next trade will win because several have lost.
Past losses do not make a win due. Protect enough room to follow the process without needing one.
Frequently asked questions
What is a normal losing streak at a 50% win rate?
Over 100 independent trades at a 50% win rate, the median longest losing streak is six trades, and the chance of at least one five-loss run is about 81%. An eight-loss run shows up in roughly 17% of 100-trade samples.
How do you calculate the probability of a losing streak?
For the next k trades, raise the loss probability to the power k. At a 50% win rate, five straight losses is 0.5 to the fifth power, or 3.125%. For a streak anywhere in a longer sample, track run lengths trade by trade or use a calculator that does.
Does a losing streak mean a win is due?
No. Under the independent model, each trade keeps the same odds after a run of losses. Expecting a win to be due is the gambler’s fallacy, and it often leads traders to add size at the worst moment.
How should you size trades for a losing streak?
Size so that a streak longer than your typical worst case, plus costs and slippage, still leaves room above the account’s drawdown limit. If eight losses at your planned size would breach the limit, reduce size before trading rather than after the streak starts.
.svg)
.svg)
.svg)
.svg)








.webp)