.svg)

.svg)
.svg)


TL;DR: A Sortino ratio calculator compares average return above a chosen target with downside deviation below that target. Using returns of +2%, -1%, +3%, -2%, and +1%, a 0% target, and the full five-period denominator gives a 0.6% average return, 1% downside deviation, and a periodic Sortino ratio of 0.60. The same returns give a Sharpe ratio of about 0.32, because Sharpe also counts upside swings as risk. Keep return frequency, target return, fees, and annualization consistent. A high ratio from a short sample does not prove a durable trading edge.
Two strategies can finish with the same profit and feel completely different to trade. One loses modestly on ordinary days. The other stays quiet for weeks, then takes one loss large enough to threaten the account.
A Sortino ratio calculator helps you examine the downside part of that difference. It measures return relative to shortfalls below a target, rather than treating every upward and downward fluctuation alike.
The calculation is useful only when the return series and denominator are defined clearly. Otherwise, comparing two ratios can be more misleading than comparing two profit screenshots.
Sortino ratio calculator
Enter your period returns in percent, a target return for the same period, the downside denominator, and the return frequency. The calculator returns the average return, downside deviation, the periodic Sortino ratio, and an annualized figure using the square-root shortcut.
What a Sortino ratio calculator needs
Choose a consistent series of returns, such as daily account returns or monthly portfolio returns. Then select a minimum acceptable return, often called MAR, for the same period.
A zero target asks whether the strategy generated return relative to losses below zero. A positive target asks a different question: how much return did it generate relative to falling short of that hurdle?
Schwab’s Sortino explanation discusses the ratio as a measure of return relative to downside risk. For your own comparison, document the exact target and calculation convention rather than assuming every platform uses the same one.
Use returns after trading costs when you are evaluating implementable performance. Separate deposits and withdrawals from trading gains so cash movements do not masquerade as returns.
Calculate downside deviation correctly
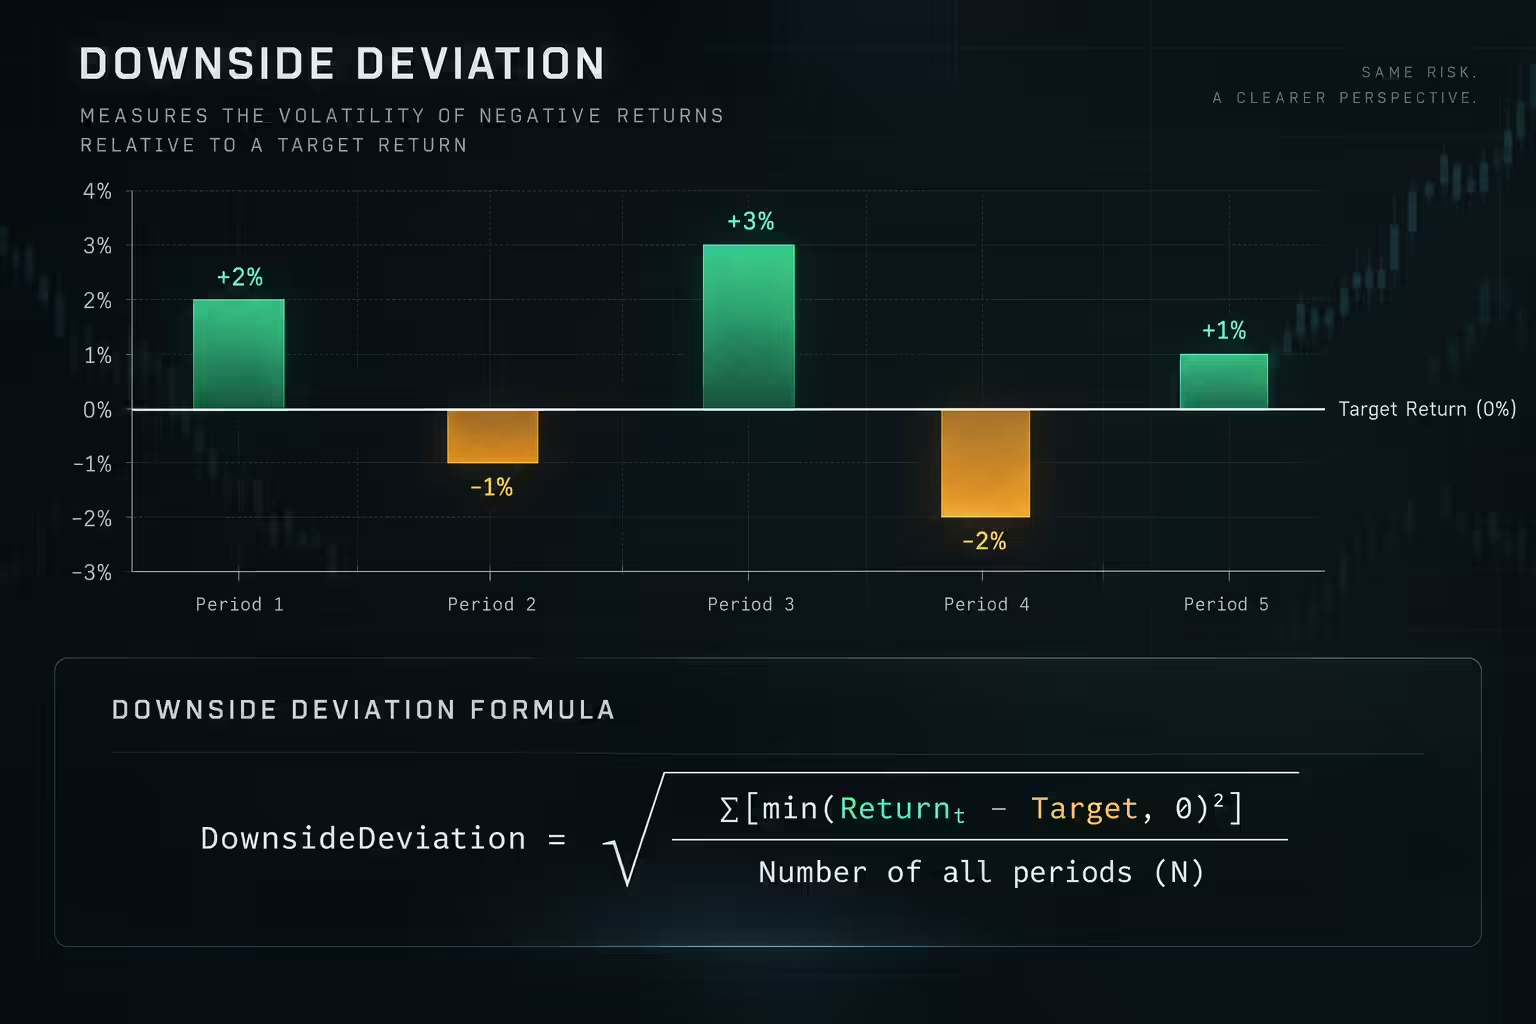
For each period, subtract the target return from the observed return. Keep negative differences and replace positive differences with zero. Square those values, average them, and take the square root.
Using a full-period denominator, the formula is:
Downside deviation = √[Sum of min(Return − Target, 0)² ÷ Number of all periods]
The Sortino ratio is then:
Sortino ratio = (Average return − Target return) ÷ Downside deviation
Some calculators divide by the number of below-target observations instead of all periods. That produces a different downside-deviation figure. Neither label alone tells you which method was used, so check the implementation before comparing results.
Also distinguish standard deviation of the losing observations from downside deviation relative to a target. Those are different calculations.
Work through a Sortino ratio example
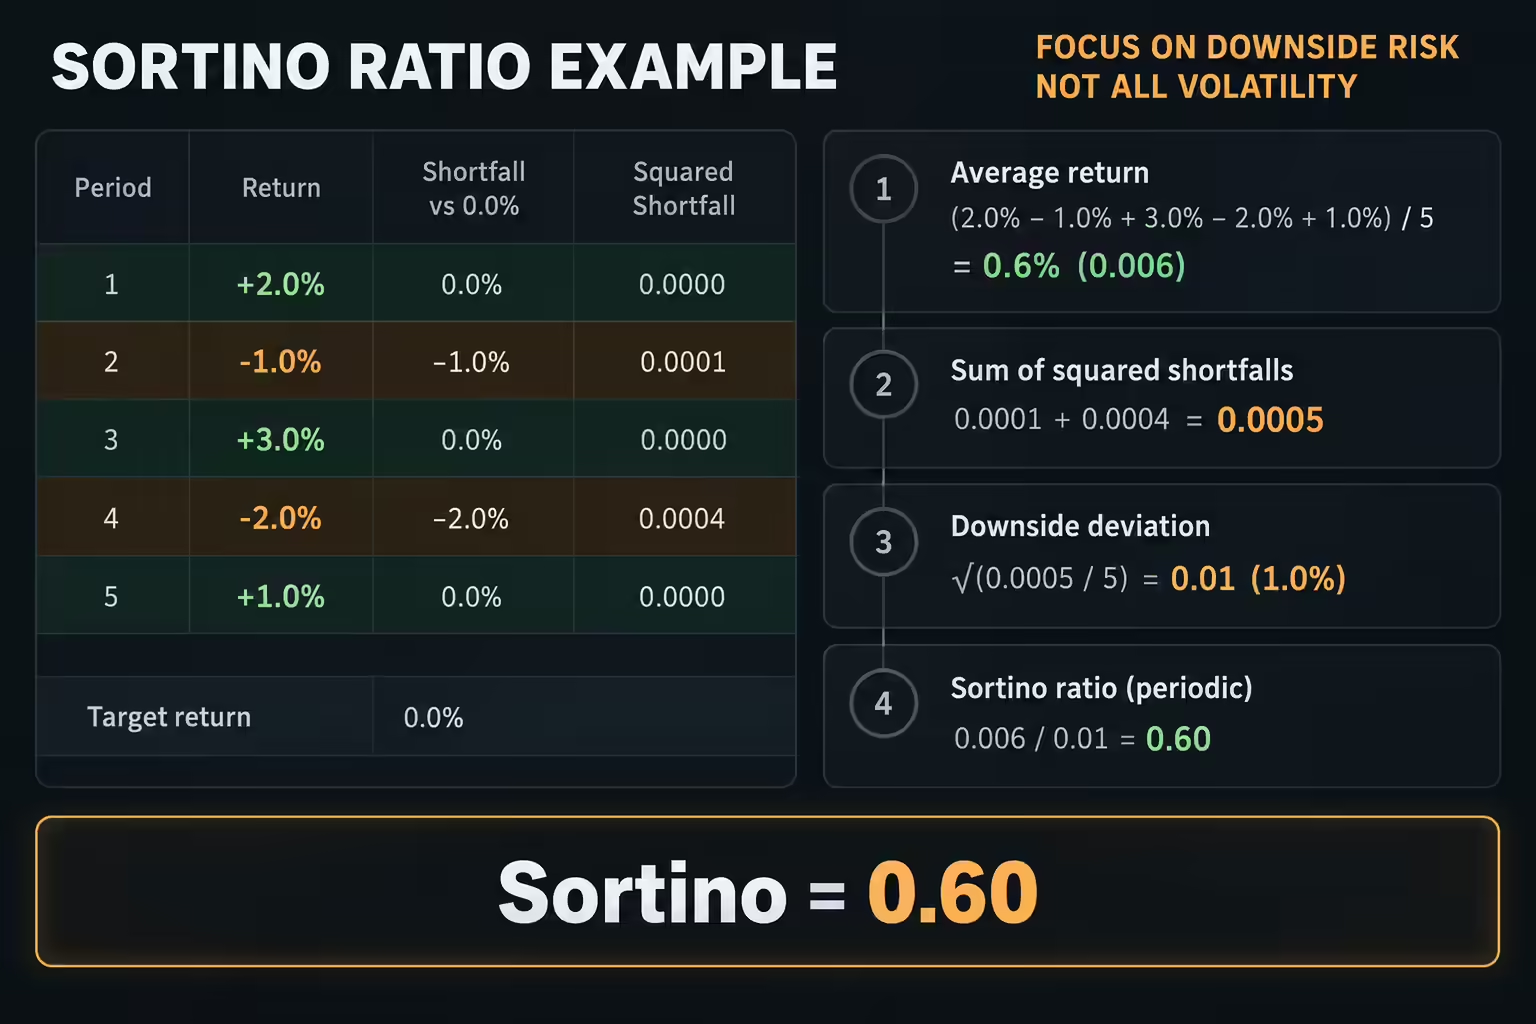
Suppose five hypothetical period returns are +2%, -1%, +3%, -2%, and +1%, with a target of 0%.
The average return is 0.6%. The below-target shortfalls are 0%, -1%, 0%, -2%, and 0%. Working in decimals, their squared values sum to 0.0005.
Divide 0.0005 by all five periods to get 0.0001. Its square root is 0.01, or 1%. The ratio is therefore 0.006 ÷ 0.01 = 0.60.
If you instead divide the squared shortfalls by the two losing periods, downside deviation becomes approximately 1.581%. The resulting ratio is about 0.379.
The underlying returns did not change. The denominator convention did. That is why a calculator should make its method visible. The calculator above lets you switch between both denominator conventions.
Five observations are enough to demonstrate the arithmetic. They are nowhere near enough to establish the quality of a trading strategy.
Sortino ratio vs Sharpe ratio
The Sharpe ratio divides excess return by the standard deviation of every return, so a large winning period raises measured risk just as a large losing period does. The Sortino ratio keeps the same idea but replaces standard deviation with downside deviation, so only shortfalls below the target count.
On the same five returns with a 0% hurdle, standard deviation across all five periods is about 1.85%, which gives a Sharpe ratio of about 0.32. The Sortino ratio is 0.60 because the +2% and +3% periods no longer count against the strategy.
| Ratio | Numerator | Risk measure | What counts as risk |
|---|---|---|---|
| Sharpe ratio | Average return minus the risk-free rate | Standard deviation of all returns | Upside and downside swings alike |
| Sortino ratio | Average return minus the target return | Downside deviation below the target | Only shortfalls below the target |
| Calmar ratio | Annualized return | Maximum drawdown | The deepest peak-to-trough decline |
The target in the Sortino numerator is often zero, the risk-free rate, or a fixed hurdle. Sortino tends to be more informative for strategies with uneven, positively skewed returns, while Sharpe is simpler and more widely reported. Reviewing both on the same return series, plus maximum drawdown, gives a fuller view than any single ratio.
Build a Sortino calculation in a spreadsheet
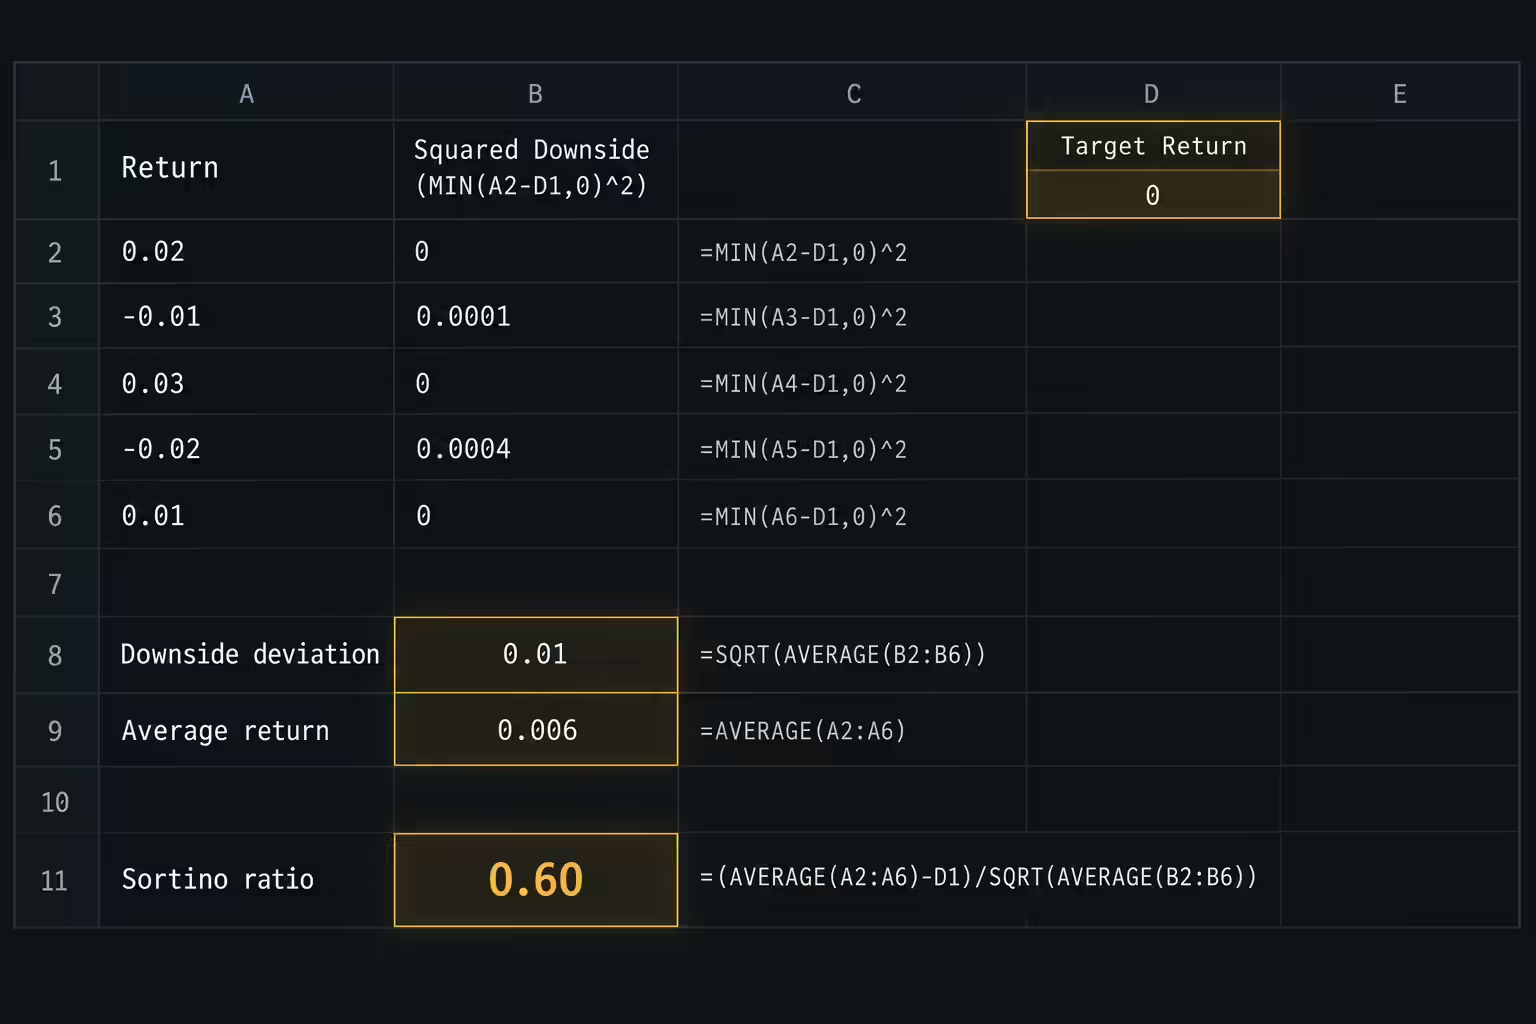
Put periodic decimal returns in cells A2:A6 and the periodic target return in D1. In B2, enter =MIN(A2-$D$1,0)^2 and copy it down.
Calculate downside deviation with =SQRT(AVERAGE(B2:B6)). Calculate the periodic ratio with =(AVERAGE(A2:A6)-D1)/SQRT(AVERAGE(B2:B6)).
Add a check for a zero denominator. If every observation meets the target, the sample downside deviation is zero and the ordinary ratio is undefined. Display that clearly instead of treating it as proof of unlimited quality.
Do not delete zero-return days automatically. First define whether your series measures account performance across all trading sessions or only sessions when the strategy is active. Either choice changes what the ratio describes.
Keep the raw returns available. A dashboard number without its underlying series is difficult to audit.
Annualize a Sortino ratio with care
A periodic ratio should be labeled with its frequency. It is not directly comparable with an annualized figure.
Under simplifying assumptions, analysts often multiply a periodic ratio by the square root of periods per year. Daily returns might use the square root of 252. That shortcut assumes enough stability in the return process to justify the scaling.
Serial dependence, irregular activity, changing position size, and clustered volatility can undermine that assumption. Annualizing a tiny sample can make a weak estimate appear precise.
If you use a positive annual target, convert it to a compatible periodic target before applying the periodic formula. Do not subtract an annual percentage from a daily average return.
What does a negative Sortino ratio mean?
When downside deviation is positive, a negative Sortino means the average return was below the chosen target. It does not necessarily mean the account lost money. A strategy averaging 0.3% per period against a 0.5% target has a negative numerator even though its average return is positive.
There is no universal pass mark at 1, 1.5, or 2. Compare strategies using the same dates, return frequency, target, cost treatment, and downside denominator. Then inspect the number and size of below-target periods. A high ratio built from one small shortfall is less informative than its precision suggests.
For a concrete target conversion, a hypothetical 5% effective annual hurdle corresponds to a monthly target of (1.05)^(1/12) − 1, approximately 0.4074%. Use that monthly target with monthly returns. Label the conversion convention; dividing 5% by twelve is a different, simple-rate approximation.
Interpret Sortino alongside the account’s actual risk
A larger Sortino ratio can indicate stronger return relative to the measured downside, but there is no universal number that makes a strategy safe or appropriate for a funded account.
The ratio does not show the exact path of an intraday drawdown. An account can finish a session positively after having crossed a firm’s real-time loss boundary earlier. A daily-return metric alone will miss that breach.
Pair the ratio with maximum drawdown, worst session, time to recovery, sample length, and results after realistic costs. Review how performance changes across different market conditions.
Be especially cautious when a strategy has many small gains and rare large losses. If the sample has not yet included the damaging event, the ratio can look reassuring for the wrong reason.
Make Sortino comparisons reproducible
Before comparing strategies, use the same dates, frequency, target return, denominator convention, and cost treatment. Record whether annualization is applied.
Then inspect the largest losses behind the number. Ask whether those losses fit your planned size and available account buffer.
Use the ratio to direct further review, not to certify a strategy. A consistent calculation helps you understand past performance; it does not guarantee what the next sample will look like.
Frequently asked questions
Is a Sortino ratio of 1.5 good?
It can be, but there is no universal pass mark at 1, 1.5, or 2. A 1.5 on daily returns means something different from a 1.5 on annualized returns, and the result also depends on the target, the denominator convention, and how many below-target periods the sample contains. Compare it only with ratios calculated the same way over the same dates.
How do you calculate the Sortino ratio?
Subtract the target return from the average period return, then divide by downside deviation. Downside deviation squares only the shortfalls below the target, averages them, and takes the square root. With returns of +2%, -1%, +3%, -2%, and +1% and a 0% target, the average is 0.6%, downside deviation is 1%, and the periodic ratio is 0.60.
Which is better, Sharpe or Sortino?
Neither is better in every case. Sortino penalizes only returns below the target, so it suits strategies with uneven returns where large winning periods would otherwise count as risk. Sharpe treats all volatility alike and is more widely reported, so many traders review both on the same return series.
How do I calculate the Sortino ratio in Excel?
Put decimal returns in A2:A6 and the periodic target in D1. Enter =MIN(A2-$D$1,0)^2 in B2 and copy it down, then use =(AVERAGE(A2:A6)-D1)/SQRT(AVERAGE(B2:B6)) for the periodic ratio. Add a check for a zero denominator in case every period meets the target.
.svg)
.svg)
.svg)
.svg)








.webp)