.svg)

.svg)
.svg)

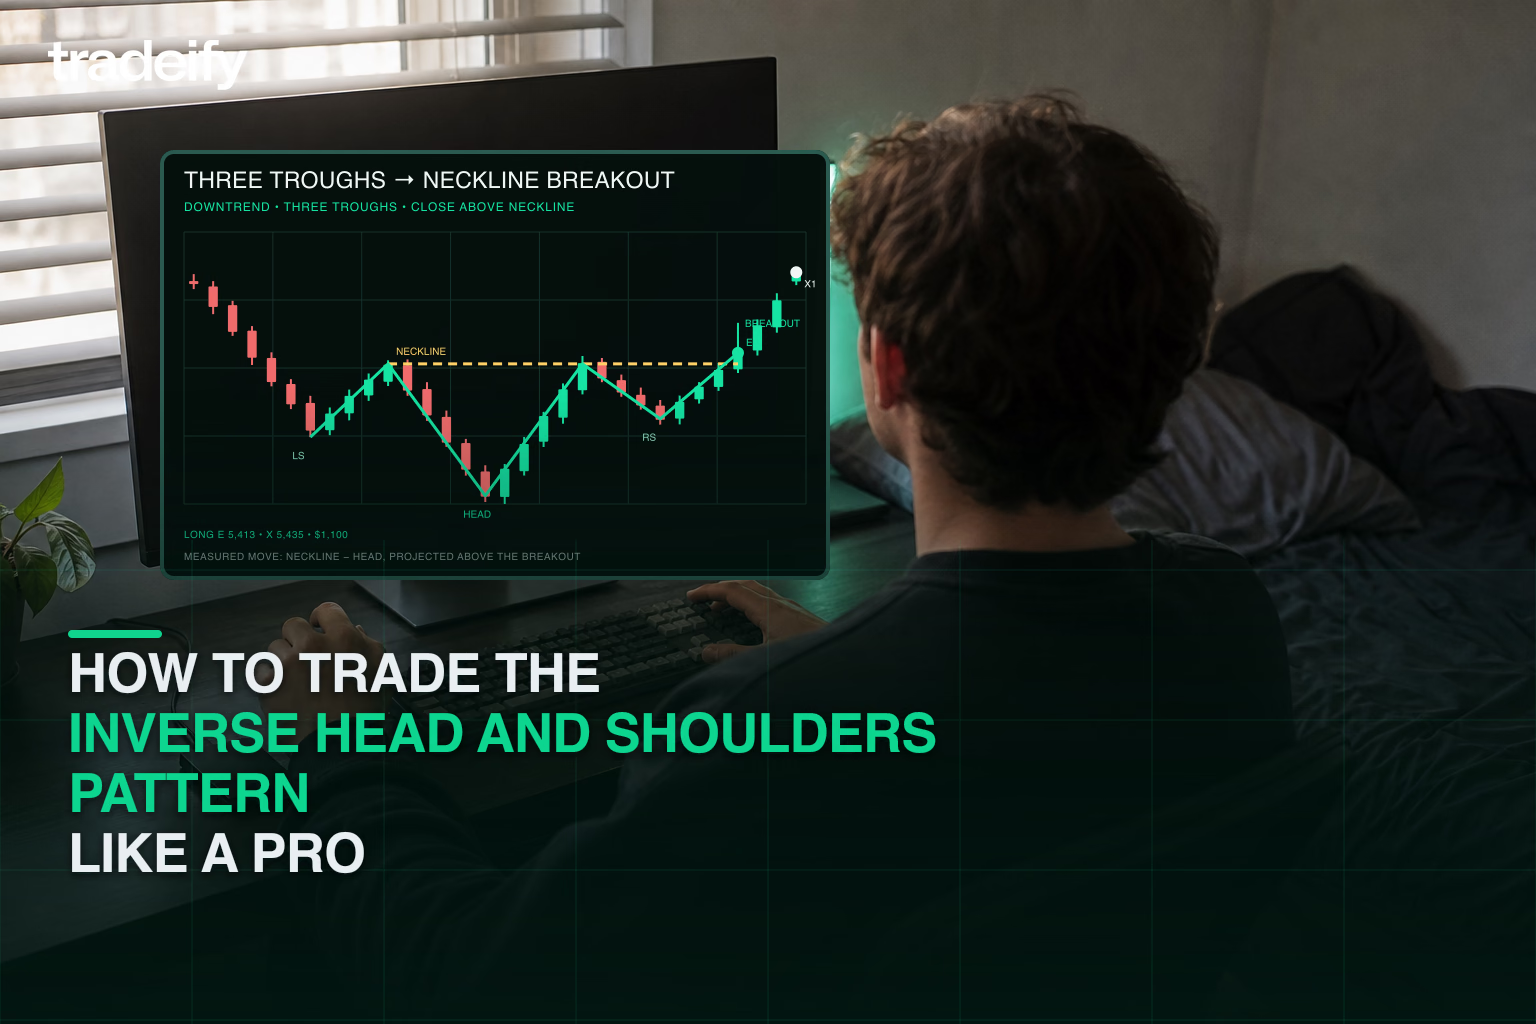


TL;DR: The inverse head and shoulders pattern signals a bullish reversal after a downtrend, with three troughs where the middle one is deepest, confirmed by a neckline breakout. Use volume, retests, and risk rules to avoid false breakouts and trade it like a pro.
In the fast-paced world of trading, recognizing high-probability chart patterns can give you a powerful edge. One of the most reliable and widely respected bullish reversal patterns is the inverse head and shoulders pattern. Whether you’re trading stocks or forex, mastering this formation can help you enter early on trend reversals with strong upside potential.
This guide will show you how to spot, confirm, and execute trades using the inverse head and shoulders pattern - like a pro.
What is the Inverse Head and Shoulders Pattern?
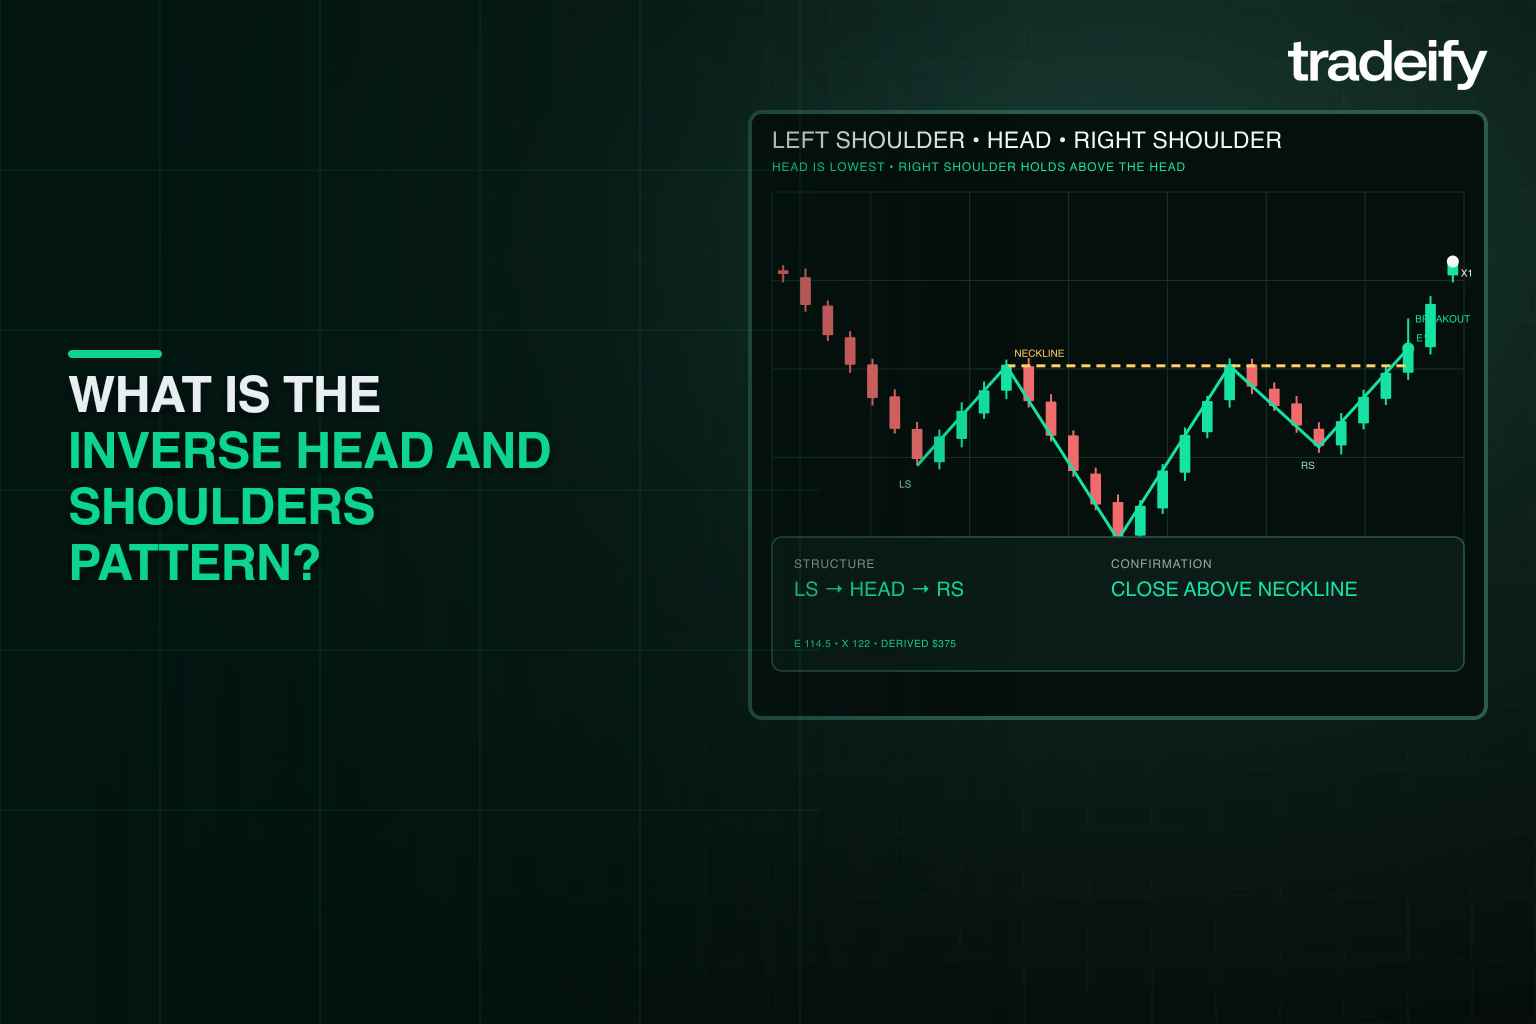
The inverse head and shoulders pattern is a technical analysis formation that signals a reversal of a downtrend into an uptrend. It consists of three distinct troughs (or “lows”) and a resistance level known as the neckline.
Here’s how it looks:
- Left Shoulder – The market makes a decline, followed by a minor rally.
- Head – A deeper low forms, then the price recovers again.
- Right Shoulder – A smaller decline than the head, followed by another recovery.
- Neckline – A resistance line drawn across the peaks of the two rallies.
Once the price breaks above the neckline, it confirms the breakout and opens the door for a potential bullish move.
Why This Pattern Matters
- ✅ Reliable Reversal Indicator: It consistently appears at the end of bearish trends.
- ✅ Clear Trade Levels: Provides obvious entry, stop-loss, and target levels.
- ✅ Works in Any Market: Equally effective in forex and stock trading.
- ✅ Visual Confidence: Easy to identify on most charting platforms.
- ✅ Historically Profitable: Frequently used by institutional traders and retail professionals alike.
How to Identify It Step by Step
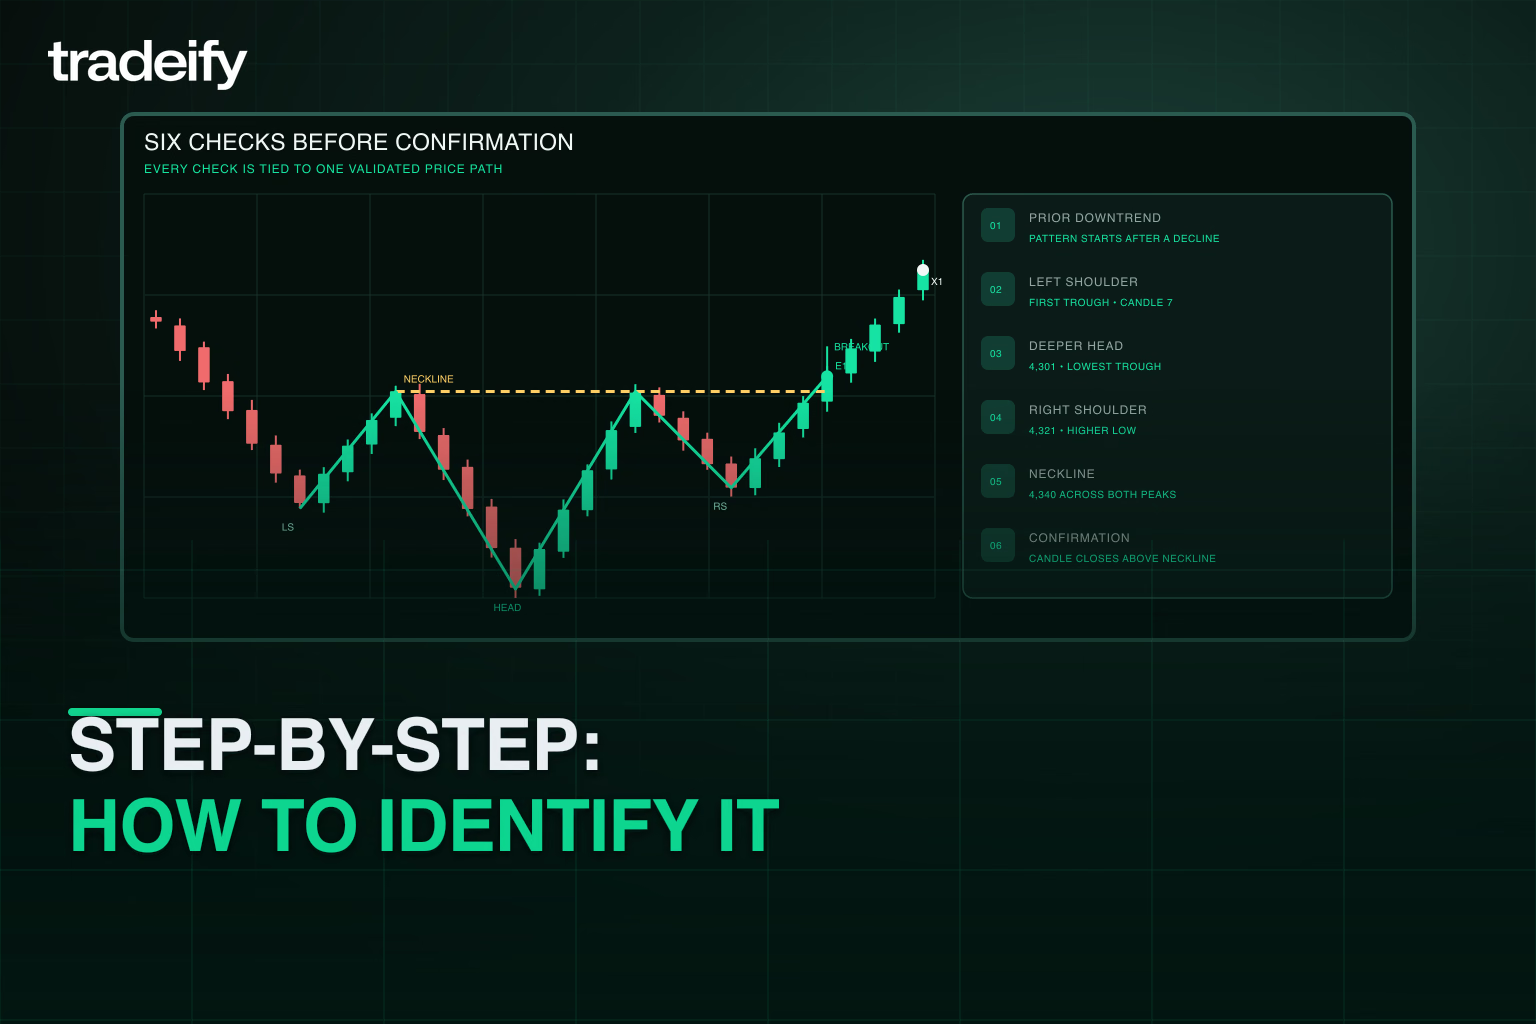
Before you trade it, you need to recognize it. Here's what to look for:
1. Existing Downtrend
- The pattern only has meaning if it occurs after a sustained bearish move.
2. Left Shoulder
- Price makes a new low, then rebounds modestly.
3. Head
- Price drops even lower than the left shoulder, forming the lowest low.
- A strong recovery follows, testing prior resistance.
4. Right Shoulder
- A smaller dip forms, ideally near the same level as the left shoulder.
- The recovery challenges the neckline again.
5. Neckline
- Draw a line across the two peaks (post-left shoulder and post-head).
- This is your breakout line - once broken, it signals entry.
6. Pattern Symmetry
- Well-formed patterns tend to show symmetry between the left and right shoulders.
- Uneven shoulders are still tradable but may signal less conviction.
Entry and Exit Strategy
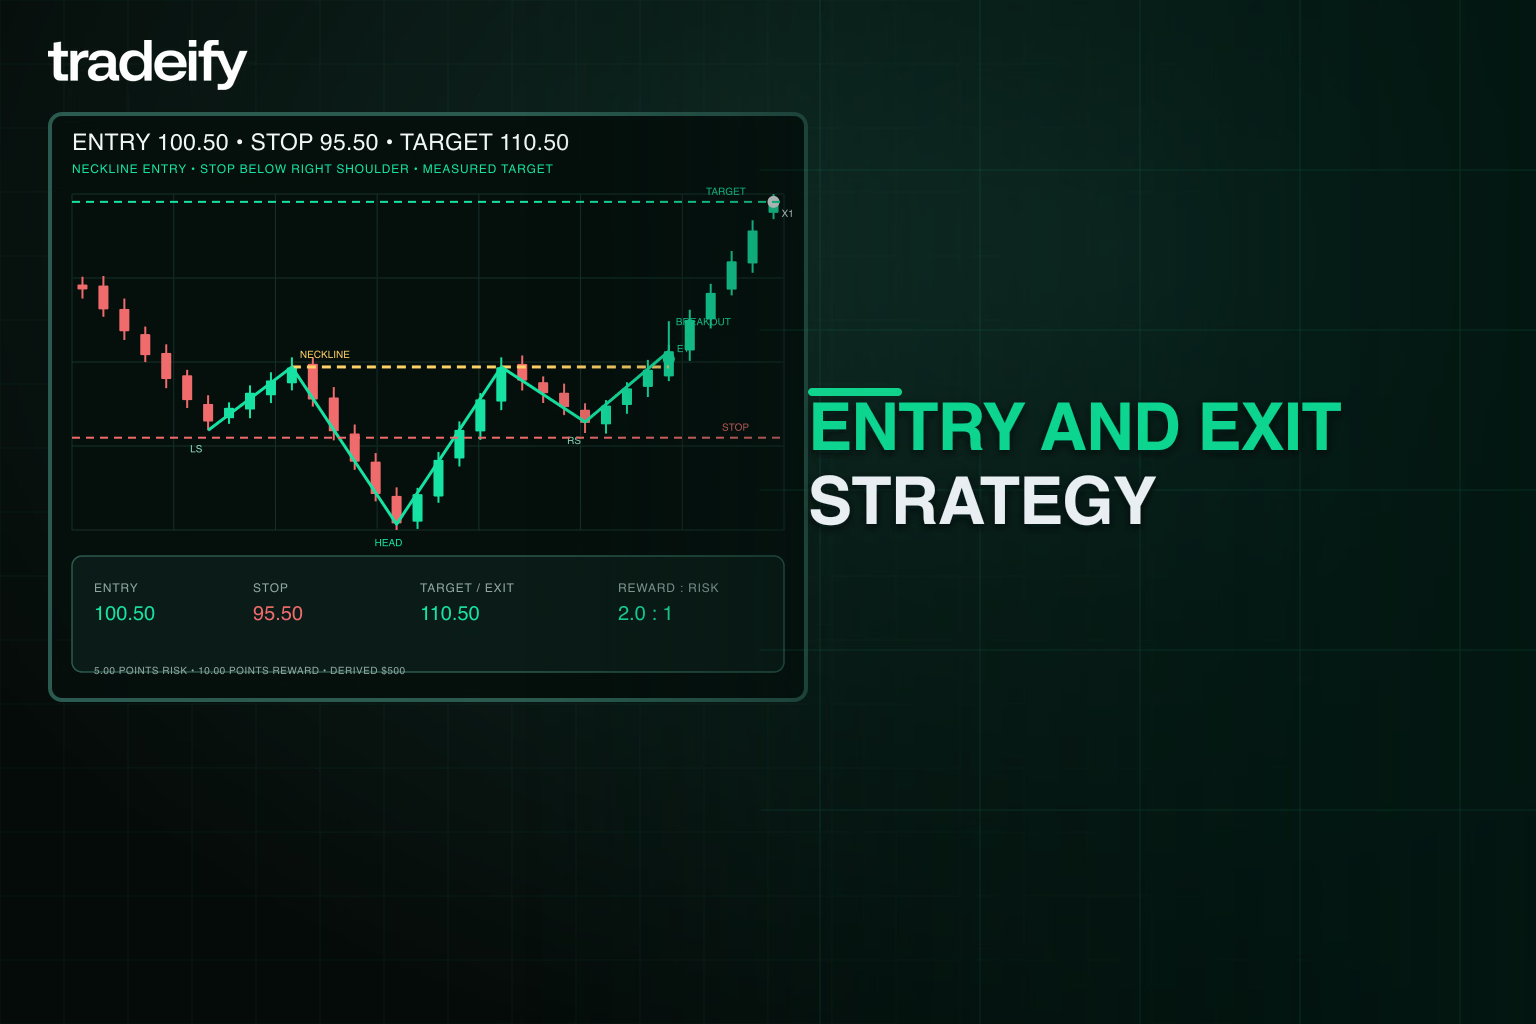
Let’s break down a clean execution method to trade the inverse head and shoulders pattern effectively.
📌 Entry Point
- Wait for a candle to close above the neckline.
- Enter on the next candle open or a retest of the neckline.
🛑 Stop-Loss Placement
- Below the right shoulder for conservative risk.
- Or below the head if you want more room (but more risk).
🎯 Profit Target
- Measure the distance between the head low and the neckline.
- Project this distance upward from the breakout point to set your take-profit.
Real-World Examples
Forex EUR/USD
- The pair forms an inverse head and shoulders pattern on the H4 chart.
- Neckline sits at 1.1100; head low is at 1.0950.
- Upon breakout:
- Entry: 1.1110
- Stop-Loss: 1.1045
- Target: 1.1260 (neckline + pattern height)
Stocks Tesla (TSLA)
- TSLA drops to $180 (left shoulder), $170 (head), and recovers to $190 (neckline).
- The right shoulder bottoms at $175.
- On breakout:
- Entry: $192
- Stop-Loss: $174
- Target: $210 (calculated from neckline to head depth)
Additional Insight
- These patterns also work well intraday (15m/30m charts) for day traders.
- In forex, they often align with key news-driven reversals, such as NFP or central bank events.
Volume and Confirmation
Limitations and Disadvantages
False Breakouts and Failed Patterns
A breakout above the neckline does not guarantee a sustained move. Two common failure modes:
- Bull trap (fakeout). Price pierces the neckline, triggers entries, then reverses back below it. This often happens on low volume, near resistance clusters, or ahead of major news where liquidity thins.
- Failed pattern. Price breaks out, rallies part of the measured move, then rolls over and breaks back below the neckline - the pattern itself was valid, but the follow-through lacked conviction.
Practical rules to reduce exposure to false breakouts:
- Require a decisive close above the neckline on the timeframe you trade, not an intraday spike.
- Demand volume expansion on the breakout candle; a breakout on flat or declining volume is suspect.
- Wait for a retest of the neckline as support - a clean retest that holds offers a lower-risk entry and confirms the level.
- Set the stop below the right shoulder (conservative) or below the breakout candle low (tighter). If the stop would violate a prop-firm trailing drawdown rule, reduce size or stand aside.
No pattern works every time. The inverse head and shoulders has specific drawbacks that show up in live trading:
- Subjective identification - the left and right shoulders rarely align perfectly, and traders often disagree on whether a formation qualifies.
- Delayed confirmation - you must wait for a candle to close above the neckline, which can mean missing a chunk of the initial move.
- Lower reliability on shorter timeframes - intraday patterns (15m, 30m) produce more false signals than daily or weekly charts.
- Volume can diverge - a breakout on declining volume often fails, but rising volume is not a guarantee of follow-through.
TrendSpider notes that the pattern should not be relied on as the sole indicator for making trading decisions
and should be used in combination with other technical analysis tools and fundamental analysis to confirm the potential trend reversal (source).
For extra confidence:
- 📈 Look for rising volume on the breakout candle - thin order books can gap past your level (see Market Liquidity Guide).
- 🔁 A retest of the neckline post-breakout can offer a lower-risk second entry - the same principle applies around news events where liquidity pulls and returns.
- 🔍 Use confirming indicators like RSI or MACD showing bullish divergence near the head.
- 🧠 If RSI breaks above 50 on the breakout, that adds conviction.
Common Mistakes to Avoid
Even pros can slip up if they ignore key signals. Watch out for:
- ❌ Entering too early before the neckline breaks.
- ❌ Forcing the pattern on a chart that doesn’t clearly meet the criteria.
- ❌ Neglecting volume confirmation, especially in low liquidity markets.
- ❌ Setting tight stops too close to the breakout or shoulder level - see How to Improve Stop Loss Placement.
- ❌ Overleveraging - it’s a strong pattern, but still requires risk control (see Prop Firm Position Sizing and the One Percent Rule).
Best Practices
To truly trade the inverse head and shoulders pattern like a pro:
- 🔁 Use multiple timeframes: Spot the pattern on higher TFs, trade on lower ones - Futures Trading for Beginners covers multi-timeframe analysis.
- 🧩 Combine with fundamentals: For stocks, look at earnings or news that may support the reversal.
- 🧠 Journal your trades: Patterns repeat, and reviewing your wins and losses can sharpen your edge.
- 🎯 Stick to a risk-reward ratio of at least 1:2.
- ⚙️ Use alerts on your trading platform to notify you when neckline levels are approached.
Frequently Asked Questions About Inverse Head and Shoulders
Is an Inverse Head and Shoulders Bullish?
Yes. It is a bullish reversal pattern that forms after a downtrend and signals a potential shift to an uptrend when price breaks above the neckline.
Is Inverse Head and Shoulders Good?
It is one of the more reliable bullish reversal patterns when confirmed by volume and a clean neckline break, but no pattern is foolproof - false breakouts occur, especially on lower timeframes or in choppy markets.
What Does a Reverse Head and Shoulders Look Like?
Three troughs: a deeper middle trough (the head) between two shallower troughs (the shoulders), with a resistance line (neckline) connecting the peaks between them. A breakout above the neckline completes the pattern.
Can Head and Shoulders Be Bullish?
The standard head and shoulders is bearish. Its inverse, the inverse head and shoulders, is the bullish counterpart. Do not confuse the two; they signal opposite directions.
How to Trade Inverse Head and Shoulders?
Wait for a candle to close above the neckline, then enter on the next open or a retest. Place the stop below the right shoulder (conservative) or below the breakout candle. Target the measured move: neckline-to-head distance projected upward from the breakout.
Take Your Strategy Further with Tradeify
Learning to trade the inverse head and shoulders pattern is only the beginning. To unlock your full potential, you need the right tools, real capital, and a professional network.
Join Tradeify today and access:
- Real funding accounts with no personal risk
- Advanced charting and analytics
- Daily educational content and trade breakdowns
- A vibrant community of traders to learn and grow with
Don’t trade alone - trade smarter, with Tradeify.
Final Thoughts
The inverse head and shoulders pattern is a cornerstone of technical analysis and a must-have in your trading toolkit. It provides structure, confidence, and a statistically reliable edge in spotting bullish reversals. When executed with discipline and confirmation, it can become a cornerstone of your trading playbook.
Start spotting it, practicing it, and trading it - the right way. And remember, the markets favor the prepared. So prepare with purpose, and trade with Tradeify.
.svg)
.svg)
.svg)
.svg)








.webp)