



TL;DR: How to start trading comes down to one decision: can your account survive the loss your setup needs? On Micro E-mini S&P 500 futures, an 8-point stop is $40, so one contract at 1% risk needs $4,000. Learn one market, practice on a demo, and size from your stop. Write a plan, journal every trade, and judge rule-following before profit.
How to start trading is less about finding the right indicator and more about doing a few unglamorous things in the right order. Most beginners want the setup first. The question that actually decides whether a first account lasts is smaller: how much can this account lose on one trade before the honest answer is no trade at all?
So you learn how one market works, you work out what a loss costs in dollars, you write rules before money is on the line, and you practice until those rules hold up on a bad day.
The order matters because each step answers a question the next one depends on. You cannot size a position until you know what one tick is worth. You cannot judge a strategy until you have a journal. And you cannot tell whether a loss was a bad trade or a good trade that lost until you wrote down what a good trade was supposed to look like.
This guide walks through that sequence for a complete beginner, with worked numbers on a Micro E-mini S&P 500 futures contract, plain comparisons of the markets most beginners consider, and the failure modes that end most first accounts.
How to Start Trading in Nine Steps
If you want to start trading without wrecking a first account, treat it as a sequence where each step produces something concrete before you move on. Here is the full path in order.
- Learn how a trade works: bid, ask, spread, long, short and what a fill costs.
- Decide whether you want to trade or invest, because the two need different time, tools and temperament.
- Learn the dozen terms a first trade depends on, such as tick value, leverage, margin and slippage.
- Pick one market and one instrument you can afford to trade at a sensible size.
- Work out your trading capital from your stop distance, not from a broker's minimum deposit.
- Choose a registered broker and a platform you can operate without thinking.
- Write a one-page trading plan with entry rules, exit rules, risk per trade and a daily stop.
- Practice the plan on a demo account until you can follow it for a full block of trades.
- Place small live trades, journal every one, and review in blocks before changing anything.
Each step has a test. If you cannot say what one tick of your instrument is worth in dollars, step three is not done. If your plan has no daily loss limit, step seven is not done. A missing answer is the next task, not something to fix after the first loss.
The rest of this guide takes those steps one at a time, with numbers where numbers decide the outcome.
Related lesson: What is trading
What Trading Is and How a Trade Works
Trading is buying and selling a financial instrument to profit from price changes over a short to medium period, rather than owning it for years. Every trade has two sides: someone willing to buy and someone willing to sell, matched through an exchange or a dealer.
At any moment a market shows two prices. The bid is the highest price a buyer is offering right now. The ask (or offer) is the lowest price a seller will accept. The gap between them is the spread, and it is the first cost you pay on every trade.
A worked trade on a futures contract
Take the Micro E-mini S&P 500 futures contract (MES). CME Group's specification sets it at $5 times the S&P 500 index, so each full index point is worth $5, and the smallest price move (one tick) is 0.25 points, worth $1.25.
Say MES is quoted at 7,000.00 bid and 7,000.25 ask (round illustrative prices, not a live quote).
- Buy one contract at the market and you pay the ask, 7,000.25.
- If you sold immediately you would get the bid, 7,000.00.
- With no price movement at all, you are already down one tick, $1.25 per contract, before commission.
That one-tick spread is $12.50 on the full-size E-mini S&P 500 (ES), which is $50 per point, ten times MES. Same market, same chart, a very different bill.
Long and short positions
Going long means buying first and selling later, profiting if price rises. Going short means selling first and buying back later, profiting if price falls. In futures, shorting is as simple as selling a contract; no borrowing step is involved.
On one MES contract, worth $5 per point, a long entry at an illustrative 7,000 that exits at 7,010 makes 10 points, or $50 on one MES. Exit at 6,990 instead and it loses $50. A short at 7,000 has the same figures reversed. The math is symmetric; how it feels when the trade goes against you is not.
Why most futures trades never reach delivery
The CFTC notes that most futures contracts are liquidated (closed out with an offsetting trade) before delivery, and some contracts settle in cash. A day trader buying MES is not acquiring stocks; they hold a contract whose value tracks the index, and they close it with an opposite order. The CFTC also warns that speculating in futures is rarely suitable for retail customers, and that many lose all their money and can owe more than they invested. Read that line before you read anything about strategy.
Related lesson: How financial markets work
Trading vs Investing Before You Start
Trading and investing both involve buying assets, but they ask different things of you. Investing typically means holding a diversified set of assets for years and letting time do most of the work. Trading means taking positions for minutes to weeks and needing each decision to be right often enough, after costs, to beat simply holding.
The practical differences for a beginner:
| Factor | Trading | Investing |
|---|---|---|
| Holding period | Seconds to weeks | Years |
| Decisions per month | Dozens to hundreds | A handful |
| Main cost drag | Spreads, commissions, slippage | Fund fees, taxes on sales |
| Time needed | Screen time during market hours | Periodic review |
| US tax on stocks | Gains held one year or less are short-term, taxed as ordinary income | Gains held more than one year can qualify for long-term rates |
US regulated futures have their own tax treatment: under Section 1256 of the tax code, gains and losses are generally treated as 60% long-term and 40% short-term regardless of holding period, and open contracts are marked to market at year end. Check the rules for your own situation with a tax professional.
Neither choice is better in general. If you want market exposure for retirement and have no interest in watching charts, investing fits. If you want to learn to make short-term decisions under uncertainty and accept the higher odds of losing, trading is the activity this guide covers.
Related lesson: Trading vs investing
Trading Terms to Learn Before You Start
Trading vocabulary matters only where it changes a decision. These are the terms a first trade depends on, each with what it means in practice.
| Term | Plain meaning | Why it matters on day one |
|---|---|---|
| Tick | The smallest price increment an instrument can move | Every stop and target is counted in ticks |
| Tick value | Dollars gained or lost per tick per contract | Turns a stop distance into a dollar risk; $1.25 on MES, $12.50 on ES |
| Point | A full unit of price; four ticks on MES | MES pays $5 per point, ES pays $50 |
| Contract or lot | The standard unit you trade | Sets the minimum position size |
| Notional value | Price times multiplier, the full exposure | At an illustrative 7,000, one MES controls $35,000 and one ES $350,000 |
| Margin | A good-faith deposit held against a futures position, not a down payment | Lets a small deposit control large exposure |
| Leverage | Exposure divided by the money put up | Amplifies gains and losses equally |
| Pip | The standard price unit in forex, usually 0.0001 on major pairs | Forex position sizing is counted in pips |
| Liquidity | How easily you can trade without moving price | Liquid markets have tighter spreads and fewer bad fills |
| Volatility | How far and fast price moves | Higher volatility means wider stops and bigger dollar risk |
| Stop-loss order | An order that exits when price hits a set level | Caps the planned loss, though fills can slip |
| Slippage | The difference between the price you expected and the fill | A real cost that grows in fast markets |
| Position size | How many contracts or shares you hold | The one variable you fully control |
Two trading terms that change your risk
Two terms deserve extra attention when you start trading: tick value and leverage. One ES moves in the same ticks as one MES but at ten times the dollar value, so switching contracts without redoing your sizing multiplies your risk by ten. And leverage limits differ by market: US rules require a retail forex deposit of at least 2% of notional on major currency pairs, which works out to a maximum of 50:1.
A stop-loss order is a plan, not a guarantee. Investor.gov notes that a stop order becomes a market order once the stop price is reached, and the fill can differ from the stop price, especially in a fast-moving market.
Related lesson: Tick size and tick value
Choosing a Market to Start Trading
Choosing your first trading market is a sizing and schedule decision before it is a preference. The right first market is one you can trade at a small enough size, during hours you are actually free, with costs that do not eat your edge.
| Market | Smallest typical unit | Typical hours (ET) | Leverage | Beginner trap |
|---|---|---|---|---|
| Stocks | One share | 9:30 AM to 4:00 PM core session | None in a cash account; margin accounts need $2,000 minimum equity | Trading illiquid names with wide spreads |
| ETFs | One share | Same as stocks | Same as stocks | Buying leveraged ETFs without knowing they reset daily |
| Futures | One contract (micros are the small version) | Nearly 24 hours, Sunday 6:00 PM to Friday 5:00 PM for equity index | Built in through margin | Using a full-size contract when the stop needs a micro |
| Forex | Broker-defined lots | 24 hours on weekdays | Up to 50:1 on majors under US rules | High leverage with a small account |
| Options | One contract, generally 100 shares | Stock market hours | Built in through the premium | Buying cheap options that decay to zero |
| Crypto | Fractions of a coin | Continuous on most venues, weekends included | Varies widely by venue | Weekend moves with no one watching |
A simple rule for picking one market
When you start trading, pick the market where three things line up: a contract or share size that lets your stop fit inside 1% to 2% of your account, trading hours that overlap with your free time, and enough liquidity that the spread is usually one tick or close to it.
For many beginners in the US with a small account, that points to either liquid stocks in a cash account or micro futures. Micro futures offer small dollar risk per point and nearly 24-hour access. Stocks offer simplicity and no built-in leverage. Investor.gov notes that crypto asset characteristics and risks vary significantly, which is a reason to treat crypto as its own subject rather than a casual first market.
Then stay in that one market long enough to learn what normal looks like. The temptation after a rough week is to try a market that seems to be moving better. That feels productive, but it resets your learning each time, because you never collect enough repetitions in one place to know what an ordinary day looks like there.
Related lesson: How to choose a market to trade
How Much Trading Capital You Need to Start
Trading capital is the money you can lose without it changing your life, and the amount you need is set by your stop distance, not by a broker's minimum deposit. A broker may let you open an account with very little. Whether you can trade sensibly with it is a separate question.
Working backward from the stop
The method is three steps.
- Find where your trade idea is wrong. That is your stop, measured in points or ticks.
- Convert the stop to dollars per contract using the tick value.
- Divide your risk budget (a fixed percentage of the account) by that dollar figure and round down.
On MES, an 8-point stop costs $40 per contract, a 20-point stop $100, and a 40-point stop $200. Here is how many contracts each account can hold at 1% risk per trade.
| Account size | 1% risk budget | MES at 8-point stop | MES at 20-point stop | MES at 40-point stop |
|---|---|---|---|---|
| $2,000 | $20 | 0 | 0 | 0 |
| $5,000 | $50 | 1 | 0 | 0 |
| $10,000 | $100 | 2 | 1 | 0 |
| $25,000 | $250 | 6 | 2 | 1 |
Account size needed for one MES contract
In the 1% sizing table for MES, the zeros are the honest answer. A $2,000 account cannot hold one MES contract at any of these stops without breaking a 1% rule. To hold one contract at 1%, an 8-point stop needs $4,000, a 20-point stop needs $10,000, and a 40-point stop needs $20,000. A wider stop is not just a style choice. It is a capital requirement.
What a small account can and cannot do
A $500 account risking 1% has $5 per trade. One MES contract with an 8-point stop risks $40, which is 8% of that account on a single trade. A $1,000 account at 1% has $10, enough for a 2-point MES stop (8 ticks) and not much else.
Stocks scale down more easily. With a $1,000 account and a $10 risk budget, a $50 stock with a stop $2 below entry allows 5 shares, a $250 position. The share is the smallest unit, so the sizing math still works at small balances.
The same logic explains why the full-size contract is a different decision. An 8-point stop on ES is $400 per contract, ten times the MES figure. A trader who moves up without redoing the table finds out the difference in one session.
Related lesson: How much money do you need to start trading
Choosing a Trading Broker and Platform
Choosing a trading broker is one of the first practical steps to start trading, and it begins with one check that takes five minutes: is the firm registered with the regulator for the product you want to trade? Everything else (fees, platforms, apps) comes after.
How to check a broker's registration
- Futures brokers: the CFTC requires firms that handle customer funds for futures to register with the National Futures Association (NFA). NFA's BASIC database is a free tool for researching the background of derivatives firms and individuals before you open a futures account.
- Futures commission merchant vs introducing broker: per NFA definitions, an FCM accepts orders and holds customer money; an introducing broker accepts orders but does not hold customer money and works through an FCM. Know which one has your funds.
- Stock and options brokers: NFA itself points investors to FINRA's BrokerCheck to research securities firms and brokers.
A broker that cannot be found on the relevant registry is a reason to stop, whatever its marketing says.
What to compare between brokers
| Factor | What to check | Why it matters |
|---|---|---|
| Products | Does it offer the exact market and contract you chose? | Not every broker offers micros, options or every exchange |
| Total cost per trade | Commission plus exchange, clearing and regulatory fees | Small accounts trade small targets, so fees are a large share |
| Market data | Is real-time data included or a monthly add-on? | Delayed data is fine for learning, not for live entries |
| Platform | Desktop, web and mobile; order types supported | You need bracket orders and a fast flatten button |
| Demo account | Can you practice on the same platform you will trade live? | Practice on a different platform builds the wrong habits |
| Account minimums | Deposit floor and any margin account minimum | A margin stock account needs $2,000 minimum equity under FINRA rules |
Five platform actions to learn before trading
The platform is where most first mistakes happen: wrong contract month, wrong quantity, an order type you did not mean. Pick one platform and learn five actions until they are automatic: enter with a bracket (stop and target attached), move a stop, cancel all orders, flatten a position, and check your fills. A beginner does not need every indicator; they need those five actions to work under pressure.
Writing Your First Trading Plan
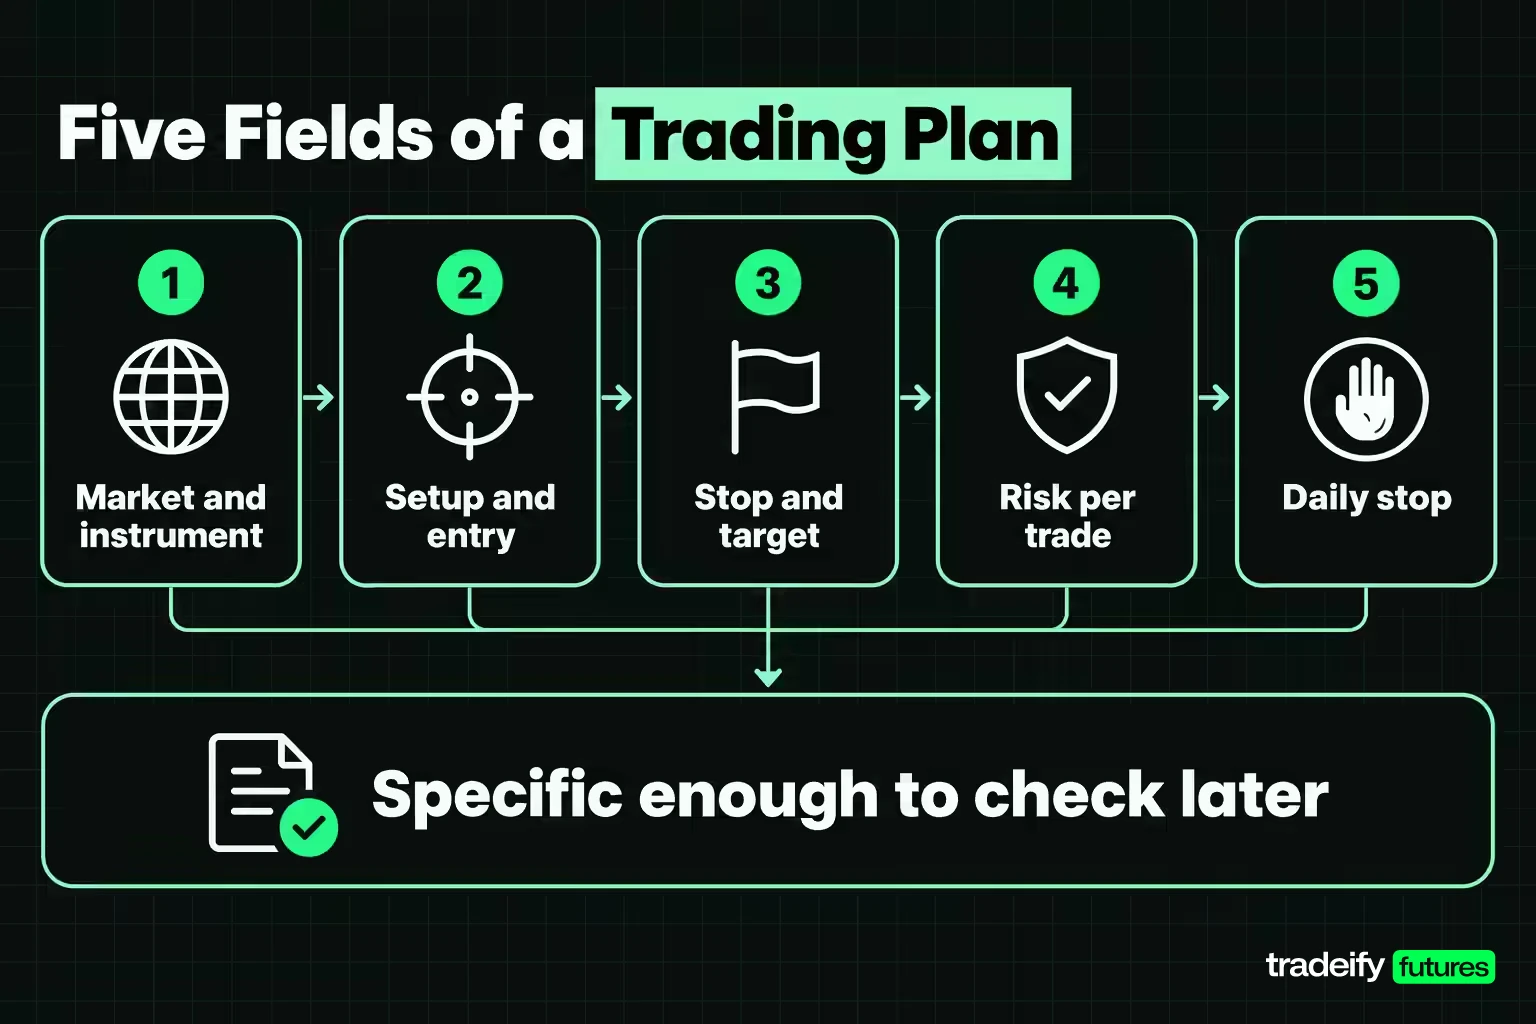
A trading plan is a short written document that decides your trades before emotion gets a vote. It does not need to be long. It needs to be specific enough that someone else could read it and tell whether you followed it.
| Plan field | What to write | Illustrative example |
|---|---|---|
| Market and instrument | One instrument only | MES |
| Trading hours | When you trade and when you stop | First 90 minutes after the 9:30 AM ET stock open |
| Setup | The condition that makes a trade valid | Pullback to a prior swing level in the direction of the 15-minute trend |
| Entry | The exact trigger | Limit order at the level after a rejection candle closes |
| Stop | Where the idea is wrong | Beyond the swing level, about 8 points on the illustrative setup |
| Target | Where you take profit | At least twice the stop distance |
| Risk per trade | Fixed percentage of the account | 1% |
| Daily stop | What ends the session | Two full losses or the daily dollar limit, whichever comes first |
| Review | When you review | Every 20 trades, never mid-session |
The illustrative example is there to show how specific each field should be, not as a strategy to copy. "I will be careful today" is not a rule. "I stop after two losing trades" is.
The 5-3-1 rule as a narrowing tool
The 5-3-1 rule is an informal forex framework: watch up to five currency pairs, use three predefined strategies, and trade one main session. It is not a regulatory or technical rule, and narrowing your focus does not make the market more predictable. Its value for a beginner is the idea behind it: limit what you watch so you get enough repetitions of the same situation to learn from. For a first plan, even stricter narrowing (one instrument, one setup, one session) usually works better.
What makes a trading plan fail
Most first plans fail in one of three ways. They have no daily loss limit, so one bad morning becomes a bad month. They describe a setup so loosely that almost anything qualifies. Or they get rewritten after every losing trade, which means there is no plan at all, only a running commentary. Write it, follow it for a full review block, and change it only at the review.
Related lesson: Build your first trading plan
Technical and Fundamental Analysis Basics for Traders
Technical analysis and fundamental analysis are two ways traders decide when and why to act. Technical analysis reads price and volume on a chart. Fundamental analysis looks at the information that moves price: economic data, central bank decisions and, for stocks, company results. Most short-term traders lean on charts and treat scheduled news as a risk event.
Technical analysis tools to learn first
Beginners often pile on indicators. A short list goes further:
- Candlestick charts: each candle shows open, high, low and close for a period. Learn to read what a long wick or a wide-range candle says about who was in control.
- Support and resistance: price levels where the market has turned before. They are areas where orders may cluster, not walls.
- Trend structure: higher highs and higher lows in an uptrend, lower highs and lower lows in a downtrend.
- Volume: how much traded. A breakout on rising volume carries more information than one on thin volume.
- One moving average: a smoothed line of recent prices that helps you see direction at a glance.
The trap is treating an observation as a confirmation. Price touching a support level is an observation. A rejection from that level, with a candle closing back above it, is a confirmation your plan can act on. Price breaking through and holding below is the invalidation. Seeing the first and acting as if you saw the second is how many early losses start.
Fundamental analysis and scheduled news
For futures and forex traders, fundamental analysis mostly means knowing the calendar. The US Consumer Price Index is released at 8:30 AM ET on scheduled dates, and the Federal Reserve's FOMC holds eight scheduled meetings a year. Releases like these can move index, rate and currency futures sharply within seconds, with wider spreads and more slippage.
A beginner does not need to forecast the numbers. The useful habit is to check the calendar before each session, know which releases fall inside your trading hours, and decide in your plan whether you stand aside, reduce size, or trade them. Spreads and fills around releases are part of that decision.
Related lesson: Technical analysis complete beginner guide
Trading Strategies and Styles for Beginners
Trading styles differ mainly by how long positions are held, and that holding period sets your stop width, your capital needs and how much screen time you need. Investor.gov describes day traders as rapidly buying and selling throughout the day, holding for seconds or minutes, and warns that day trading is extremely risky and can produce substantial losses in a very short time.
| Style | Typical holding period | Screen time | Stop width | Beginner fit |
|---|---|---|---|---|
| Scalping | Seconds to minutes | Constant | Very tight | Poor: costs are a large share of each small target |
| Day trading | Minutes to hours, flat by the close | A focused session | Tight to moderate | Workable with micros and a strict daily stop |
| Swing trading | Days to weeks | Check-ins, often end of day | Wide | Workable with enough capital for wide stops |
| Position trading | Weeks to months | Low | Very wide | Closer to investing; needs the most capital per trade |
The capital link is direct. On MES, an 8-point day-trading stop is $40, while a 40-point swing stop is $200, five times more per contract. A style is only an option if your account can carry its stops at your risk rule.
Swing trading also carries overnight and weekend gap risk: price can open far beyond your stop, and the stop fills at the next available price. Day trading avoids holding through the close but asks for more decisions per week, and more decisions means more chances to break your own rules.
For a first strategy, pick one style that fits your schedule and account, and one setup within it. Strategy variety is something you earn after a journal shows what works for you.
Related lesson: Trading styles explained
Risk Management Rules for New Traders
Risk management in trading is the set of rules that keeps a normal losing streak from ending your account. It matters more for a beginner than any setup, because a beginner's edge is unproven and their losing streaks are coming either way.
Four core risk rules
- Fixed risk per trade: risk the same small percentage of the account on every trade, commonly 1% to 2%. Do not raise it after a win or to win back a loss.
- A stop on every trade, placed by structure: put the stop where the idea is wrong, then let the stop distance set the position size. Never choose the stop by how much you are willing to lose.
- A daily loss limit: decide in advance what ends the session, such as two full losses. When it is hit, you stop.
- One position at a time at first: two open trades in related markets can double your real risk without you noticing.
Why risk per trade decides survival
Losing streaks are normal even for a strategy with an edge. Over 100 independent trades with a 50% win rate, the chance of at least one run of five or more losses in a row is about 81.0%, and the chance of eight or more is about 17.0%. At a 45% win rate those odds rise to 92.0% and 30.7%. These are probabilities from simple arithmetic, not predictions, but they show that a long losing run is something to plan for, not a sign of bad luck.
Here is what ten straight losses do at different fixed risk levels.
| Risk per trade | Account left after 10 straight losses |
|---|---|
| 1% | 90.4% |
| 2% | 81.7% |
| 5% | 59.9% |
| 10% | 34.9% |
At 1%, ten losses are a bad week you can recover from. At 10%, the same streak leaves about a third of the account. That is usually when the real damage starts, because the pressure to get it back pushes size up at exactly the moment the trader is least objective.
How costs change the break-even win rate
A raw risk-to-reward ratio ignores costs. Add them, and the win rate you need goes up. Using an illustrative friction of $4.50 per MES round turn ($2.00 commission plus one tick of slippage on entry and exit), here is the break-even win rate.
| Setup | Break-even win rate before costs | After costs on a $40 stop | After costs on a $100 stop |
|---|---|---|---|
| 1.5 to 1 | 40.0% | 44.5% | 41.8% |
| 2 to 1 | 33.3% | 37.1% | 34.8% |
| 3 to 1 | 25.0% | 27.8% | 26.1% |
Tight stops feel safer, but they are where costs hurt most. On a 3-point MES target, $15 gross, $4.50 of friction is 30% of the gain. Replace the illustrative cost with your broker's actual all-in rate before relying on these numbers.
Related lesson: Risk management for traders
Practicing Trading on a Demo Account
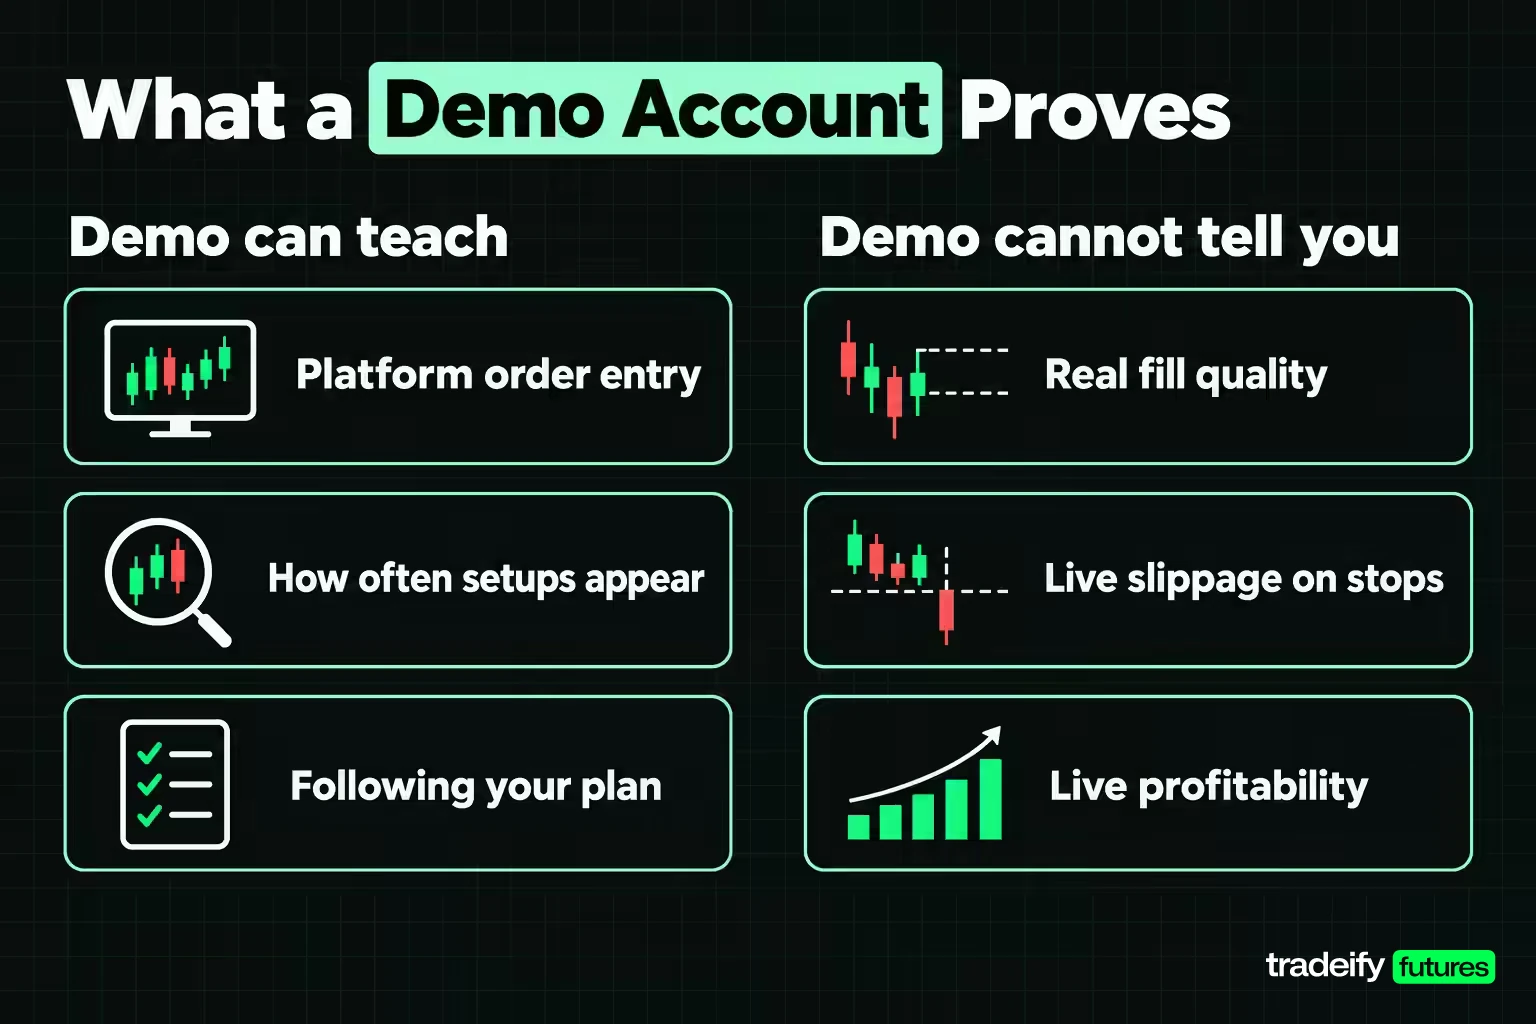
A demo account (also called paper trading or simulated trading) lets you trade with fake money on real or near-real prices. It is the right place to learn a platform and test whether you can follow your plan, and the wrong place to predict live results.
What demo trading teaches a beginner
- Learning the platform's five core actions until you make no order-entry mistakes.
- Testing whether your written setup appears often enough to trade.
- Practicing the boring parts: placing a bracket, moving a stop, stopping at your daily limit.
- Building the habit of journaling every trade.
What a demo account cannot tell you
Simulated fills can be kinder than real ones. A demo may fill your limit order the moment price touches it, when in a live market you might not get filled at all. Slippage on stops is often smaller in simulation. And with no real money at stake, it is easier to sit through a losing trade or take a setup you would hesitate on live.
So a demo result is a result about the simulation. A profitable month on a demo account does not prove the strategy works live, and a losing one does not prove it fails. What a demo can prove is narrower and still useful: whether you do what your plan says when nothing is forcing you to.
A demo pass condition before trading live
Give the demo a pass condition that does not depend on profit. A useful one: follow your plan on every trade in a block of 20 trades, with no order-entry errors and no broken daily stops. If you break a rule, the block restarts. When you pass, go live at the smallest size your market allows, and expect your behavior to feel different once the money is real.
Related lesson: Practice with paper trading
Placing Your First Live Trade
Your first live trade is the moment you actually start trading with real money, and it is a test of execution and nerves, not a business plan. The goal is to place it exactly as written, at the smallest size, and handle whatever happens next by the rules. Expect it to feel bigger than the dollar amount suggests. That is normal, and it is exactly why the size should be small.
A pre-trade checklist
Before you click, you should be able to answer each of these:
- What is the instrument, and is it the correct contract month?
- Where is the stop, in points and in dollars?
- How many contracts or shares does the risk rule allow?
- Where is the target, and is it at least the ratio your plan requires?
- Is a scheduled data release due during the trade?
- How much more can you lose today before your daily stop ends the session?
If any answer is missing, the trade waits.
Order types for a first trade
- Limit order: buys or sells at your price or better, but may not fill. Good for entries at a planned level.
- Market order: fills right away at the best available price, paying the spread and any slippage.
- Stop order: becomes a market order when the stop price is reached, so the fill can be worse than the stop in a fast market.
- Bracket order: an entry with a stop and a target attached, where one exit cancels the other. It puts your exits in place before you have time to second-guess them.
For a first live trade, a bracket order removes the most common early mistake, which is entering without a stop and then deciding where it goes after the trade moves against you.
Stock account rules for a first trade
If your first market is stocks, two account rules matter. In a cash account, trades settle T+1 (one business day), and you must pay for a purchase before selling it; Investor.gov notes that buying and selling before paying is freeriding and can lead to a 90-day freeze. The old $25,000 pattern day trader minimum for margin accounts is being replaced by FINRA's intraday margin standards, effective June 4, 2026 with a phase-in through October 20, 2027, so check which rules your broker currently applies. Futures were never subject to the pattern day trader rule.
Related lesson: Place your first trade
Trading Psychology When You Are Starting Out
Trading psychology is mostly about recognizable behaviors that appear right after a win or a loss. Feeling frustrated after a clean setup loses is normal. The problem is what that feeling makes you do next, so the answer is a rule decided before the feeling shows up.
| What happens | What it looks like | Precommitted rule |
|---|---|---|
| Revenge trading | Taking a lower-quality trade right after a loss to win it back | Daily stop of two full losses, no exceptions |
| Sizing up on confidence | Doubling size after two winners | Risk percentage changes only at a scheduled review |
| Chasing a missed entry | Entering late because price moved without you | A missed entry is a different trade; it needs its own valid setup |
| Moving the stop | Widening the stop so the loss does not have to be taken | Stops only move in the direction that reduces risk |
| Overtrading a slow market | Inventing setups because nothing is happening | A maximum number of trades per session |
| Reading too much into a small sample | Calling a strategy broken after five trades | Judge only at the end of a review block |
Process milestones instead of profit targets
In the first ninety days after you start trading, profit numbers mean very little because the sample is small. Track process instead: the share of trades that followed the plan, the number of sessions that ended at the daily stop rather than past it, and the number of order-entry errors. A trader who reaches high rule adherence with small losses has made real progress, even with a negative balance.
It also helps to admit that early trading is uncomfortable. Hesitating on a valid setup after a loss is common, and so is overconfidence after a good week. Neither says anything permanent about you. Both say the next trade should be taken at the same size, by the same rules.
Related lesson: Trading psychology
Keeping a Trading Journal From the Start
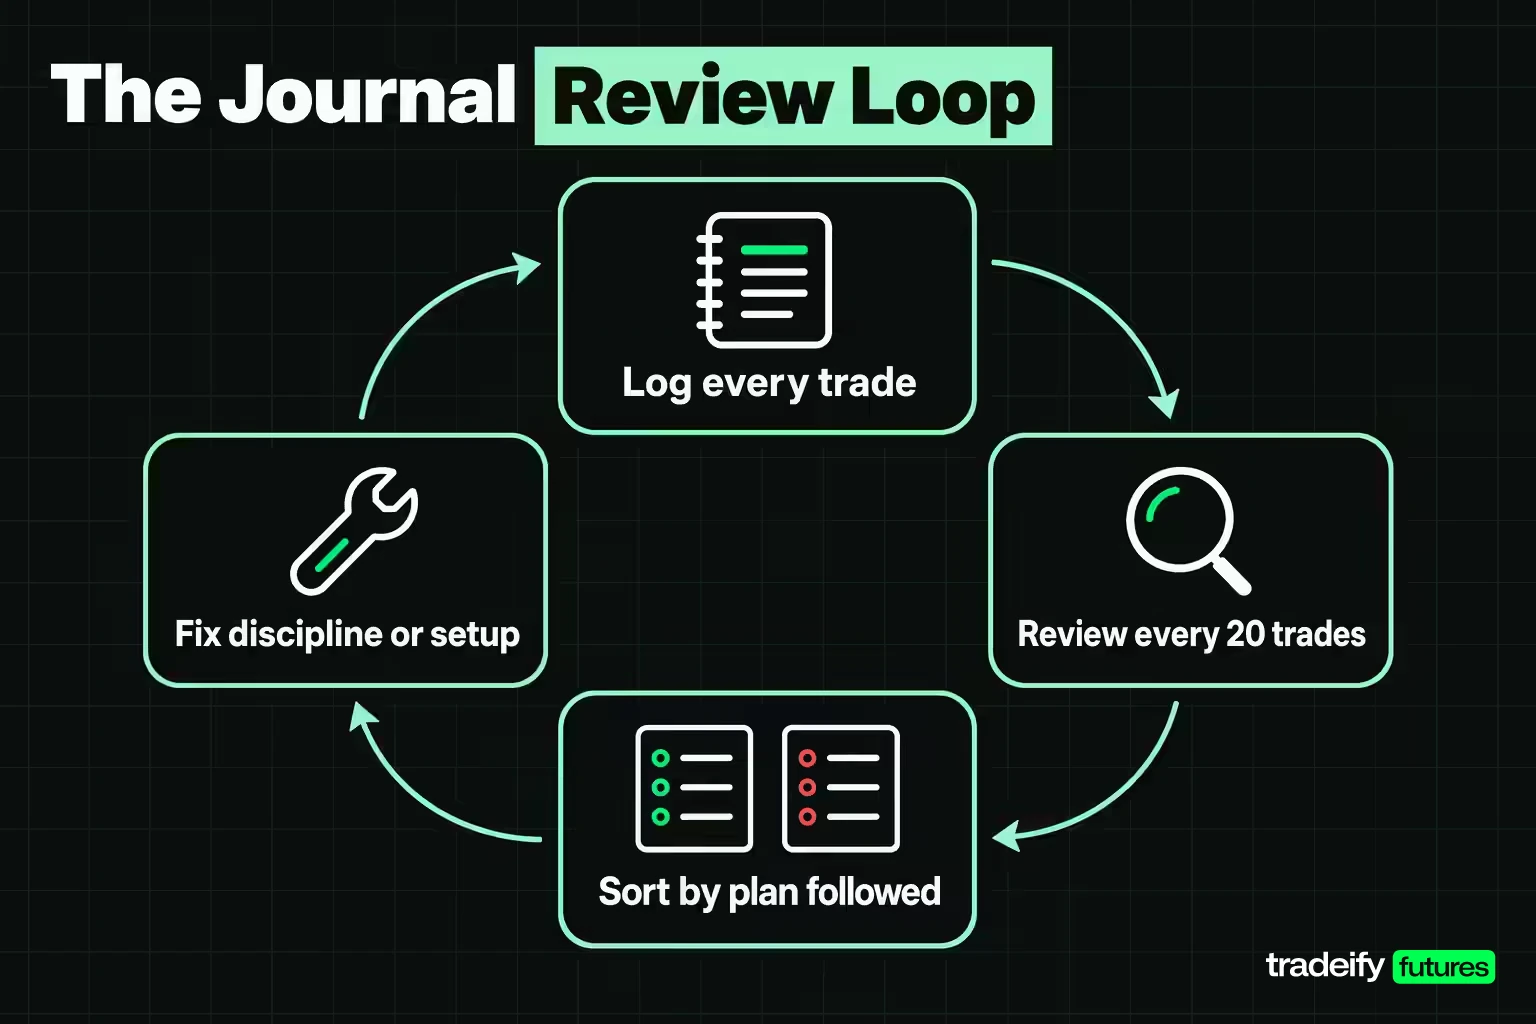
A trading journal is a record of every trade and the reasoning behind it, and it is the only reliable way to tell whether a problem is your strategy or your execution. Memory edits out the trades you would rather forget.
What to log on every trade
| Field | Example entry |
|---|---|
| Date and time | Tuesday, 10:05 AM ET |
| Instrument and side | MES, long |
| Setup name | Pullback to prior swing level |
| Planned entry, stop and target | 7,000.25 / 6,992.25 / 7,016.25 (illustrative) |
| Actual fill and exit | Fill price and exit price |
| Size | 1 contract |
| Result in dollars and in R | Dollar result, and result as a multiple of planned risk |
| Plan followed | Yes or no, with the rule broken if no |
| Note | One sentence on what you saw and felt |
The "plan followed" column is the most important one in the table. It separates two very different problems: a valid setup that lost (normal, keep going) and a trade that should never have been taken (a discipline problem to fix).
How to review a trading journal
Review in blocks, not trade by trade. After every 20 trades, sort by "plan followed" and compare the two groups. If rule-breaking trades are where the losses cluster, the fix is discipline, not a new strategy. After a larger sample, such as 50 trades or more, you can start asking whether the setup itself has an edge after costs.
Related lesson: How to keep a trading journal
Prop Firm Evaluations as Another Way to Start Trading
Prop firm evaluations are a different way to start trading futures without depositing your own trading capital. Instead of funding a brokerage account, you pay a fee to trade a simulated account under the firm's rules. If you meet the profit target without breaking the rules, you may get a simulated funded account, and profits there can lead to real payouts under the firm's payout policy.
What a prop firm evaluation changes for a beginner
- Capital: you trade a larger simulated balance than many beginners could fund themselves, so the sizing table works at bigger account sizes.
- Loss cap: your personal market risk is limited to the fee you pay rather than a margin call, but trading still involves risk, and the fee itself can be lost.
- Rules: a typical firm sets a trailing drawdown, often a daily loss limit, contract limits and required trading hours. Breaking a rule usually ends the account.
What a prop firm evaluation does not change
The account is simulated, so everything about demo fills and behavior still applies. The rules also add pressure: a trailing drawdown punishes the same oversized, revenge-driven trading that ends personal accounts, only faster. A beginner who wants to start trading this way but has not yet passed a demo pass condition usually just pays the evaluation fee to learn the same lessons.
The firm's rules are effectively a risk plan written for you, which can help if you read them before the first trade and size to them. Check whether drawdown is measured end-of-day or intraday, whether positions must close each day, and what counts as a rule breach, before you buy anything.
On our accounts, evaluations and funded accounts are simulated, and they are sized by contract limits rather than margin: a 25K account allows 1 mini or 10 micros. The Growth evaluation on a 25K account has a $600 daily loss limit, every position is closed by 4:45 PM ET with no overnight holds, and accounts are one-time purchases with no subscription.
How to Start Trading FAQ
Is day trading easy to learn?
Day trading is simple to start and hard to do well. A study by Barber, Lee, Liu, Odean and Zhang of Taiwanese day traders found more than 75% quit within two years, and less than 1% earned predictable profits. The mechanics take weeks to learn; consistent rule-following under pressure takes much longer.
What is the 5-3-1 rule in trading?
The 5-3-1 rule is an informal forex framework: up to five currency pairs, three predefined strategies and one main trading session. It is a focus aid, not a regulation or a profit method. Its useful idea is narrowing what you trade so you get repeated practice on the same situations.
How do I trade stocks?
Open an account with a FINRA-registered broker, fund it, and place buy or sell orders during market hours, with a 9:30 AM to 4:00 PM ET core session on the NYSE. In a cash account, trades settle in one business day and you must pay for purchases before selling. A margin account needs $2,000 minimum equity.
Is $500 enough to start trading?
$500 is enough to learn but rarely enough to trade futures at a sensible risk level. At 1% risk, $500 allows $5 per trade, while one MES contract with an 8-point stop risks $40, or 8% of the account. Small stock positions or a demo account fit that balance better.
How much can you make day trading with $1000?
With $1,000, most day traders make little or lose money, and there is no reliable figure to expect. At 1% risk, a $1,000 account risks $10 per trade, so even a good month is a small dollar amount. Treat a $1,000 account as tuition for learning execution, not as an income source.
How much do day traders make per month?
Most make nothing or lose money. In a study by Chague, De-Losso and Giovannetti of Brazilian index futures day traders who kept trading more than 300 days, 97% lost money after fees, and only 1.1% earned more than the Brazilian minimum wage. Monthly income claims online rarely show the losing accounts.
Your First Week After You Start Trading
The first week after you start trading should be about building the routine, not about results. Here is a concrete schedule.
- Day one: write the five numbers that define your first trade: the instrument and its dollars per point, your stop in points and dollars, your risk per trade, the contracts that risk allows, and the dollar loss that ends the session.
- Day two: open the demo on the platform you will use live and practice the five core actions until they are automatic.
- Days three to five: trade the plan on the demo, journal every trade, and stop at the daily limit even when it feels unnecessary.
- End of the week: count how many trades followed the plan. That number, not the profit, decides whether you keep practicing or start your 20-trade demo pass block.
If any of the five numbers is missing, that is the next task, not the next trade.
This article is educational and is not financial advice or a recommendation to trade any instrument. Trading stocks, options, futures, forex and crypto involves substantial risk of loss, and with futures and other leveraged products you can lose more than you deposit. All prices, stops and costs here are illustrative, contract specifications and broker rules change, and demo, evaluation and funded accounts are simulated, so their results do not reproduce live trading.


