



TL;DR: Piercing line and dark cloud cover pattern setups are one two-candle reversal, mirrored for each direction. The second candle opens beyond the first candle's extreme and closes past the midpoint of its body, but not past its open. A close exactly at the midpoint fails, and a close past the open makes it an engulfing pattern instead. Published testing shows modest reversal rates, so the stop, target and cost decide whether the trade is worth taking.
You see a red candle close near its low, the next candle gap lower, and then buyers take back more than half of the drop. The question is whether that is a reversal worth trading or just a bounce. The piercing line and dark cloud cover exist to answer that question, and they are the same idea pointed in opposite directions.
A piercing line can show buyers taking back more than half of a down session. A dark cloud cover can show sellers giving back more than half of an up session. Both record a failed push at a location. Neither tells you what the next candle will do.
This guide treats the pair as one pattern with two sides. It sets out the exact candle tests, runs one illustrative E-mini S&P 500 construction through both directions, prices each entry choice in points, ticks and dollars, and shows what published testing says about how often each pattern actually works.
What the Piercing Line and Dark Cloud Cover Pattern Is
The piercing line and dark cloud cover pattern is a pair of two-candle reversal shapes. In each one, the second candle points the opposite way to the first and drives back into the first candle's body past its halfway mark, without covering the whole body.
A piercing line is the bullish side. Price has been falling, a long red candle prints, and the next candle opens below that red candle's low. It then rallies and closes above the midpoint of the red body but below the red candle's open. Thomas Bulkowski's definition is a black candle followed by a white one that opens below the black candle's low and closes between the midpoint of the black body and its opening price.
A dark cloud cover is the bearish side. Price has been rising, a long green candle prints, and the next candle opens above that green candle's high. It then sells off and closes below the midpoint of the green body but above the green candle's open. CandleScanner lists the piercing pattern as its direct opposite.
So the colour order sets the direction. Red then green after a decline is a piercing line pointing up. Green then red after a rise is a dark cloud cover pointing down.
The claim each pattern makes is narrow. It says one push failed hard enough to give back more than half of the prior session. It does not say the trend has changed, and it does not say how far price will travel. That narrowness is useful, because it gives you a specific level where the idea is wrong.
How to Identify a Piercing Line or Dark Cloud Cover
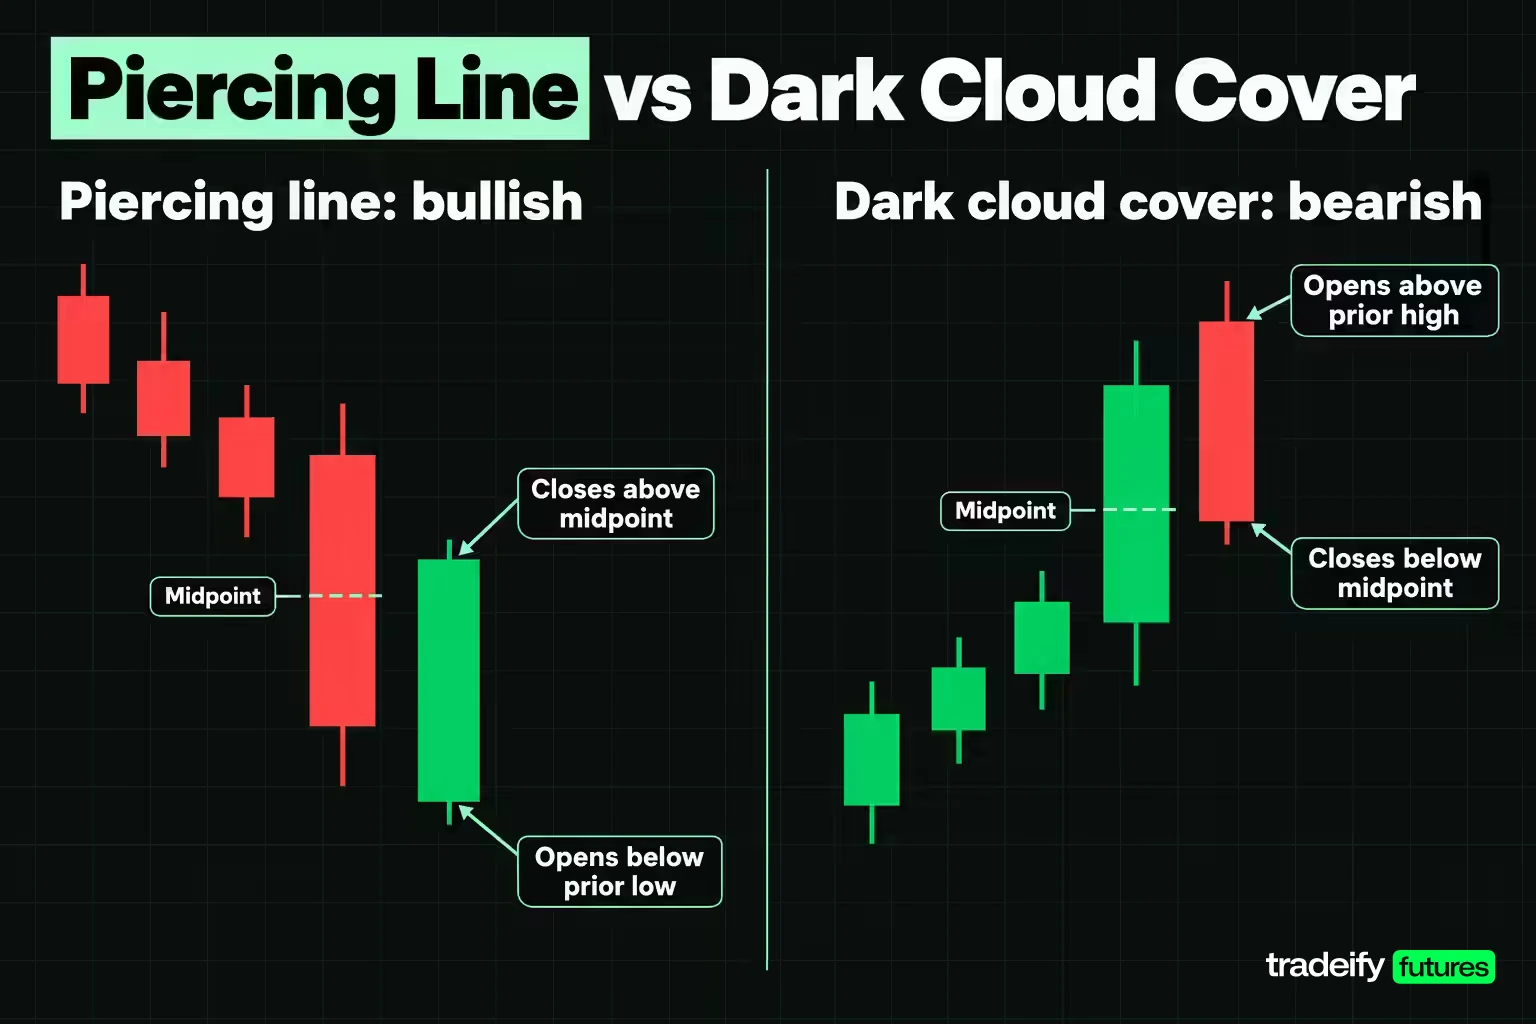
Identifying a piercing line or dark cloud cover comes down to five tests run in order. If any one fails, the pair is something else, and the published statistics for these two patterns stop applying.
- A prior move exists. A piercing line needs a decline into it, and a dark cloud cover needs a rise.
- The first candle has a real body in the direction of that move. Red for the piercing line, green for the dark cloud cover. Most definitions want a long body, not a small one.
- The second candle opens beyond the first candle's extreme. Below the red candle's low for a piercing line, above the green candle's high for a dark cloud cover.
- The second candle closes strictly past the midpoint of the first body.
- The second candle closes short of the first candle's open.
| Test | Piercing line, bullish | Dark cloud cover, bearish |
|---|---|---|
| Prior move | A decline | A rise |
| First candle | Red, close below open | Green, close above open |
| Second candle colour | Green, close above open | Red, close below open |
| Second candle open, strict test | Below the first candle's low | Above the first candle's high |
| Second candle open, loose test | Below the first candle's close | Above the first candle's close |
| Second candle close, must pass | Above the first body's midpoint | Below the first body's midpoint |
| Second candle close, must not pass | The first candle's open | The first candle's open |
| Close exactly at the midpoint | Fail | Fail |
| Close past the first candle's open | Bullish engulfing instead | Bearish engulfing instead |
| Signal direction | Up | Down |
The midpoint rule for piercing line and dark cloud cover candles
The midpoint is the whole test, so compute it as a price, not a feeling. Take the first candle's open and close, halve the distance, and add it to the lower of the two. A red candle that opens at 6040.00 and closes at 6014.00 has a 26.00 point body and a midpoint of 6027.00.
A piercing line needs a close above 6027.00. A close at exactly 6027.00 is a fail, not a pass. That sounds pedantic, but it is where screens, scripts and traders disagree, and a rule that rounds or allows a small tolerance will admit trades the definition rejects.
The open condition and the gap debate
The open is where sources split. The strict version requires the second candle to open beyond the first candle's extreme, which is a true gap. That is Bulkowski's definition and the one his statistics were measured on.
Other sources relax it. CandleScanner accepts an open equal to the prior high on a dark cloud cover, noting that the relaxed rule increases the number of patterns found. Many charting scripts go further and only ask for an open beyond the prior close, treating a gap as a strength factor rather than a requirement.
Pick one version, write it down and keep it fixed. A loose-open pair is still a real penetration of the prior body, but it is not the pattern that produced the published reversal rates, so quoting those rates for it mixes two different samples.
The Market Psychology Behind Piercing and Dark Cloud Candles
The psychology of a piercing line is a story about who gets trapped. On the first candle, sellers control the session and close it near the low. The next session opens even lower, below the prior low, and anyone short feels the decline is confirmed. Late sellers often join at exactly that point.
Then the session turns. Buyers absorb the selling, price climbs back through the prior close and keeps going past the middle of the red body. By the close, everyone who sold in the lower half of the prior session is underwater. Those traders are the fuel for a reversal, because their stops sit above them.
A dark cloud cover runs the same story upside down. Buyers close the first session near its high, the next session opens above that high, and the gap looks like strength. Late buyers chase it. Sellers then take the session back below the middle of the green body, and the gap buyers are now trapped above the market.
The midpoint matters for a reason. A close in the near half of the prior body is a bounce that the prior side can still claim. A close past the midpoint means the counterattack took back the majority of the prior session's move. Beyond the prior open, the shape becomes an engulfing pattern and the story is a full reversal of the session.
Recognising the trap does not mean the trapped traders will exit. They can hold, add, or simply wait, and the original trend can resume. The psychology explains why the pattern sometimes works. It does not tell you that it will, and that gap between a good story and a paid trade is where most pattern traders get caught.
Piercing Line vs Engulfing, Thrusting and Other Similar Patterns
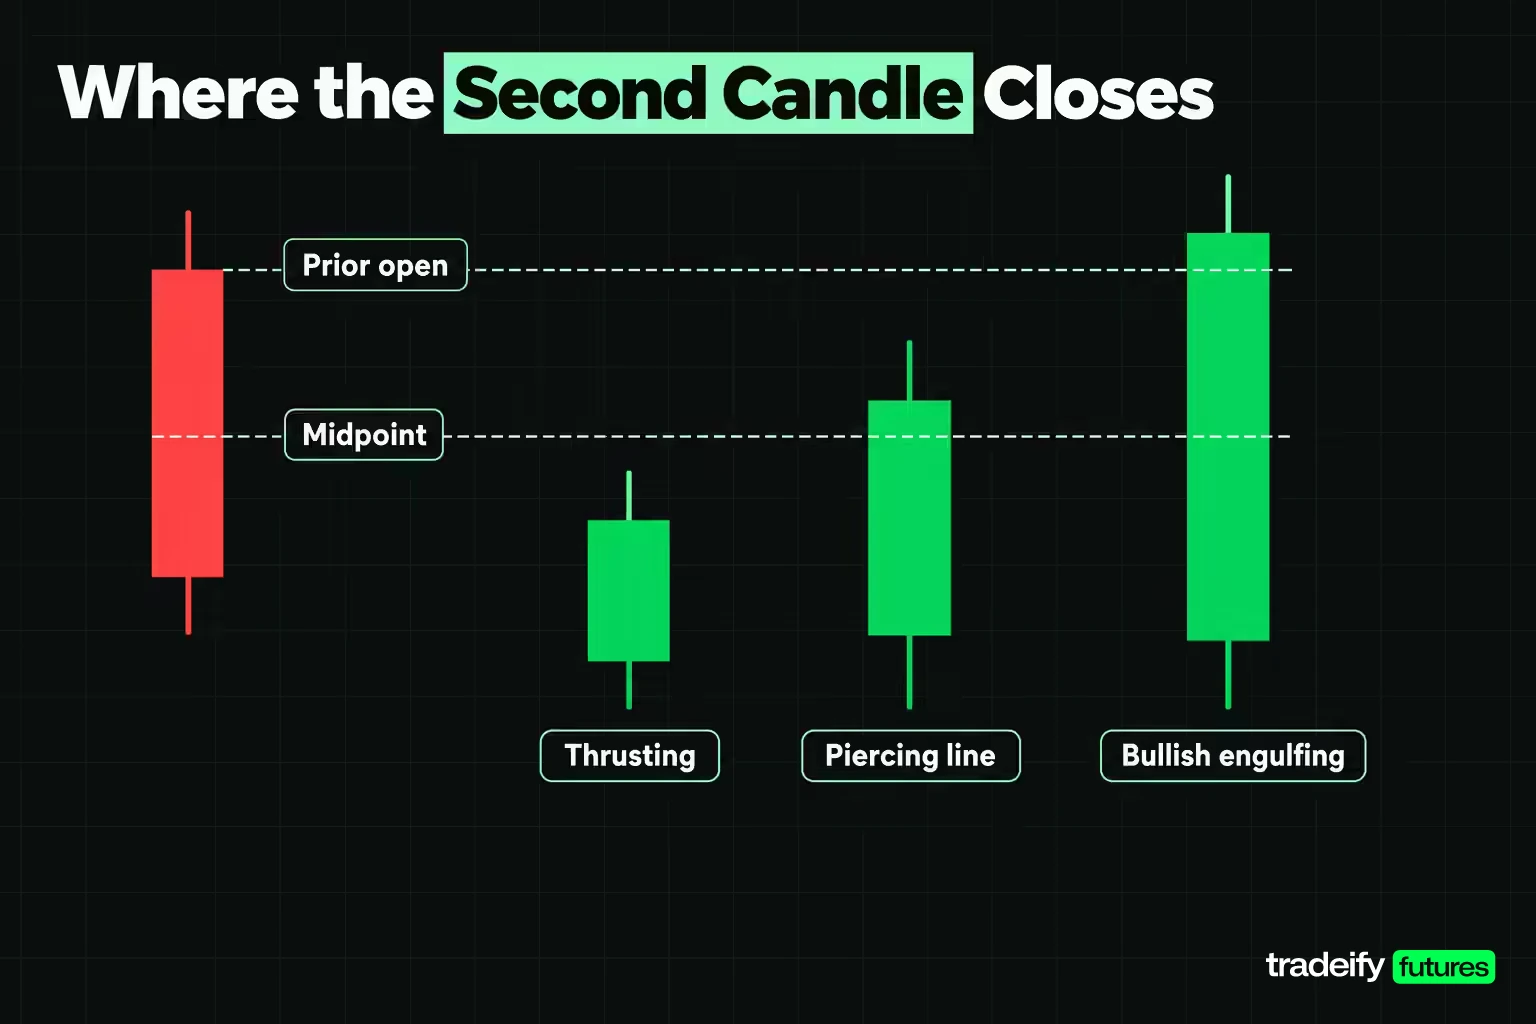
A piercing line sits on a ladder of similar two-candle shapes, and the only thing that separates them is where the second candle closes. Bulkowski tests each rung separately, and their records differ.
| Where the second candle closes, bullish case | Pattern name | Bulkowski's tested behaviour |
|---|---|---|
| At or near the first candle's low | On neck | Bearish continuation 56% of the time |
| Just inside the first candle's body | In neck | Bearish continuation 53% of the time |
| Near but below the first body's midpoint | Thrusting | Bullish reversal 57% of the time |
| Above the midpoint, below the first open | Piercing pattern | Bullish reversal 64% of the time |
| Above the first candle's open | Bullish engulfing | A separate pattern with its own record |
The bearish side works the same way. A dark cloud cover closes past the midpoint of the green body and short of its open. Once the red body closes below the green candle's open, it covers the whole green body and becomes a bearish engulfing. Bulkowski himself points readers from the dark cloud cover to the bearish engulfing because the two look so alike.
Related lesson: Engulfing candlestick patterns
Three other neighbours cause confusion:
- A harami is the reverse geometry. The second body sits entirely inside the first body, with no open beyond the first candle at all.
- A tweezer bottom or top is two candles with matching lows or highs. It is about the extreme, not about how far the second body travelled.
- Three white soldiers and three black crows are three-candle runs of same-colour bodies. They describe a move that has already happened rather than a single failed push.
The practical rule is to check the upper bound before you call it a piercing line. A close past the first candle's open looks like the strongest version of the pattern, and it is a different pattern with a different record.
A Worked Piercing Line and Dark Cloud Cover Example
This worked example runs one illustrative E-mini S&P 500 construction through both directions, so the two patterns are compared on the same kind of geometry rather than on two unrelated charts. Every price is a round illustrative level, not market data. The ES tick is 0.25 index points.
Testing seven piercing line closes
A decline that started at 6072.00 runs into a red candle that opens at 6040.00, trades up to 6042.00, down to 6010.00 and closes at 6014.00. The body is 26.00 points and the midpoint is 6027.00. The next candle opens at 6008.00, below the red low, so it clears the strict open test. Its low is 6006.00 in every version. Now vary only its close.
| Green candle close | Penetration of the 26.00 point red body | Verdict |
|---|---|---|
| 6020.50 | 6.50 points, 25.00% | Fail, below the 6027.00 midpoint |
| 6027.00 | 13.00 points, 50.00% | Fail, exactly at the midpoint is not a pass |
| 6027.25 | 13.25 points, 50.96% | Pass by one tick |
| 6031.50 | 17.50 points, 67.31% | Pass, a clean piercing line |
| 6038.00 | 24.00 points, 92.31% | Pass, a deep piercing line close to the red open |
| 6040.00 | 26.00 points, 100.00% | Edge case, closes exactly at the red open |
| 6042.00 | 28.00 points, 107.69% | Not a piercing line, it is a bullish engulfing |
Two rows carry the lesson. The 6027.25 close passes by a single tick, so any rounding in your rule changes the answer. The 6042.00 close looks like the most bullish version and is not the pattern at all, because the green body has swallowed the red body.
Testing seven dark cloud cover closes
The dark cloud cover side uses its own illustrative ES construction. A rise that started at 5980.00 runs into a green candle that opens at 6010.00, trades down to 6008.00, up to 6042.00 and closes at 6040.00. The body is 30.00 points and the midpoint is 6025.00. The next candle opens at 6043.00, above the green high, and trades up to 6045.00 before turning.
| Red candle close | Penetration of the 30.00 point green body | Verdict |
|---|---|---|
| 6032.50 | 7.50 points, 25.00% | Fail, above the 6025.00 midpoint |
| 6025.00 | 15.00 points, 50.00% | Fail, the same boundary mirrored |
| 6024.75 | 15.25 points, 50.83% | Pass by one tick |
| 6020.00 | 20.00 points, 66.67% | Pass, a clean dark cloud cover |
| 6012.50 | 27.50 points, 91.67% | Pass, a deep dark cloud cover |
| 6010.00 | 30.00 points, 100.00% | Edge case, closes exactly at the green open |
| 6009.00 | 31.00 points, 103.33% | Not a dark cloud cover, it is a bearish engulfing |
The dark cloud cover numbers are close to the piercing line version but not identical. This green body is 30.00 points, against a 26.00 point red body in the piercing line example, so the same one-tick pass is a smaller share of the larger body. Compare penetration as a percentage of the first body, never in raw points.
Neither sweep says anything about location. A qualifying piercing line that forms straight into resistance, with the higher timeframe still falling, is a valid pattern and a poor trade.
Confirmation Techniques for Piercing Line and Dark Cloud Signals
Confirmation for a piercing line or dark cloud cover means waiting for price to do something after the pattern that supports the reversal. The three common versions are a next-candle close beyond the signal candle, a breakout close beyond the whole pattern, and a break of a nearby trendline or level.
Bulkowski uses the breakout version. On his piercing pattern example, the upward breakout comes when price closes above the top of the candle pattern. On the dark cloud cover, the downward breakout comes when price closes below the lowest low in the pattern. CandleScanner adds that confirmation can take the form of breaking a support level or a trend line.
Pricing the cost of confirmation
Confirmation is real evidence, and it is not free. The stop stays one tick beyond the two-candle extreme, while the entry moves further away from it. On the illustrative ES construction, the shallow 6027.25 piercing line has its stop at 6005.75 and a target at the 6072.00 origin of the decline. The costs assume $5.00 per Micro E-mini round turn, which is 1.00 index point.
| Entry choice, long side | Entry | Risk | Reward | Reward to risk after cost | Break-even hit rate |
|---|---|---|---|---|---|
| Signal candle close | 6027.25 | 21.50 points, 86 ticks | 44.75 points, 179 ticks | 1.94 to 1 | 33.96% |
| Next close above the signal high of 6029.00 | 6029.25 | 23.50 points, 94 ticks | 42.75 points, 171 ticks | 1.70 to 1 | 36.98% |
| Breakout close above the pattern top of 6042.00 | 6042.25 | 36.50 points, 146 ticks | 29.75 points, 119 ticks | 0.77 to 1 | 56.60% |
The short side shows the same shape. The shallow 6024.75 dark cloud cover has its stop at 6045.25 and a target at the 5980.00 origin of the rise.
| Entry choice, short side | Entry | Risk | Reward | Reward to risk after cost | Break-even hit rate |
|---|---|---|---|---|---|
| Signal candle close | 6024.75 | 20.50 points, 82 ticks | 44.75 points, 179 ticks | 2.03 to 1 | 32.95% |
| Next close below the signal low of 6022.00 | 6021.75 | 23.50 points, 94 ticks | 41.75 points, 167 ticks | 1.66 to 1 | 37.55% |
| Breakout close below the pattern bottom of 6008.00 | 6007.75 | 37.50 points, 150 ticks | 27.75 points, 111 ticks | 0.69 to 1 | 59.00% |
A light confirmation costs a few points of edge. A full breakout confirmation on a pattern this tall can eat most of the target, which is why a confirmed entry needs its own stop and target rather than the original plan carried forward.
The three-candle rule for both patterns
The three-candle rule is a trader convention, not a codified standard. It says a two-candle reversal earns its signal only when a third candle closes beyond it, higher for a piercing line and lower for a dark cloud cover.
It overlaps with the three outside patterns, which are related but built on an engulfing middle candle rather than a piercing one. Bulkowski tests three outside up as a bullish reversal 75% of the time and three outside down as a bearish reversal 69% of the time. Those rates belong to those patterns, not to a piercing line plus a third candle.
Related lesson: Three methods and three outside patterns
Support and Resistance Locations for Both Patterns
Location decides more about a piercing line or dark cloud cover than the shape does. A piercing line at an established support level says buyers defended a price that already mattered. The same shape in the middle of a range says much less, because there was no level to defend.
Bulkowski's notes point in a specific direction. Piercing patterns within a third of the yearly low performed best in his testing, and he advises avoiding them when the primary trend is downward. His example shows both piercing patterns in a brief pullback inside a primary uptrend.
His dark cloud cover notes describe the mirror. The best setup appears when price is already trending lower, an upward retrace forms, and the dark cloud cover ends that retrace. In both cases the pattern works best as the end of a counter-move, not as a call that the main trend has flipped.
So the useful question is not whether you have a piercing line. It is whether you have a piercing line at the end of a pullback into support, inside a trend that points the same way. That is a narrower setup, and it fires less often. Fewer trades is the point.
The second candle can also become a level of its own. CandleScanner notes that when a dark cloud cover reverses an uptrend, its second candle forms a resistance zone. The same logic applies in reverse to the second candle of a piercing line as possible support on a later retest.
Related lesson: Support and resistance
Volume on the Second Candle of Each Pattern
Volume adds a second reading to a piercing line or dark cloud cover. The candle shape shows that price reversed. Volume shows how much trading it took to do it.
CandleScanner states that a dark cloud cover's reliability is higher when volume increases on the second candle. The same reasoning applies to a piercing line. A second candle that reverses more than half the prior session on heavier volume than the first suggests real participation. A reversal on thin volume can be a quiet drift that a single large order undoes.
Futures need one adjustment. ES trades on CME Globex from Sunday 6:00 PM to Friday 5:00 PM ET, with a daily maintenance break from 5:00 PM to 6:00 PM ET. Overnight volume is usually lighter than regular-session volume, so an intraday piercing line that forms overnight will often show low volume for reasons that have nothing to do with conviction. Compare the second candle's volume with the same time of day on previous sessions, not with the busiest candle on the chart.
Use volume as a filter rather than a trigger. A pattern that fails the midpoint test does not become valid because volume was high.
Related lesson: What is volume
Indicators That Pair With Piercing and Dark Cloud Setups
Indicators work best with a piercing line or dark cloud cover when they answer a question the candles cannot, such as trend direction, stretch or location. They do not make a failed pattern pass.
- Moving averages as a trend filter. TradingView's built-in candlestick detectors offer a 50-period simple moving average as their trend filter, with price below the average treated as a downtrend. A piercing line below a falling 50-period average is fighting the trend that Bulkowski warns against.
- RSI for stretch and divergence. RSI runs from 0 to 100, and readings below 30 are conventionally called oversold and above 70 overbought. A piercing line with RSI coming up from below 30, or making a higher low while price makes a lower low, adds a momentum argument to the price argument.
- MACD for momentum turning. A MACD histogram that stops falling as a piercing line prints suggests downside momentum is fading. It is a slower reading, so it usually confirms late.
- Fibonacci retracements for location. A dark cloud cover that forms at a 50% or 61.8% retracement of the prior down leg marks a common place for a counter-move to stall.
The trap is stacking indicators until something agrees. If you keep adding tools until the chart says yes, the tools are not filtering anything. Choose one filter for trend and one for location, write them down, and judge the pattern only after both are checked.
Related lesson: Relative strength index
How to Trade a Piercing Line or Dark Cloud Cover
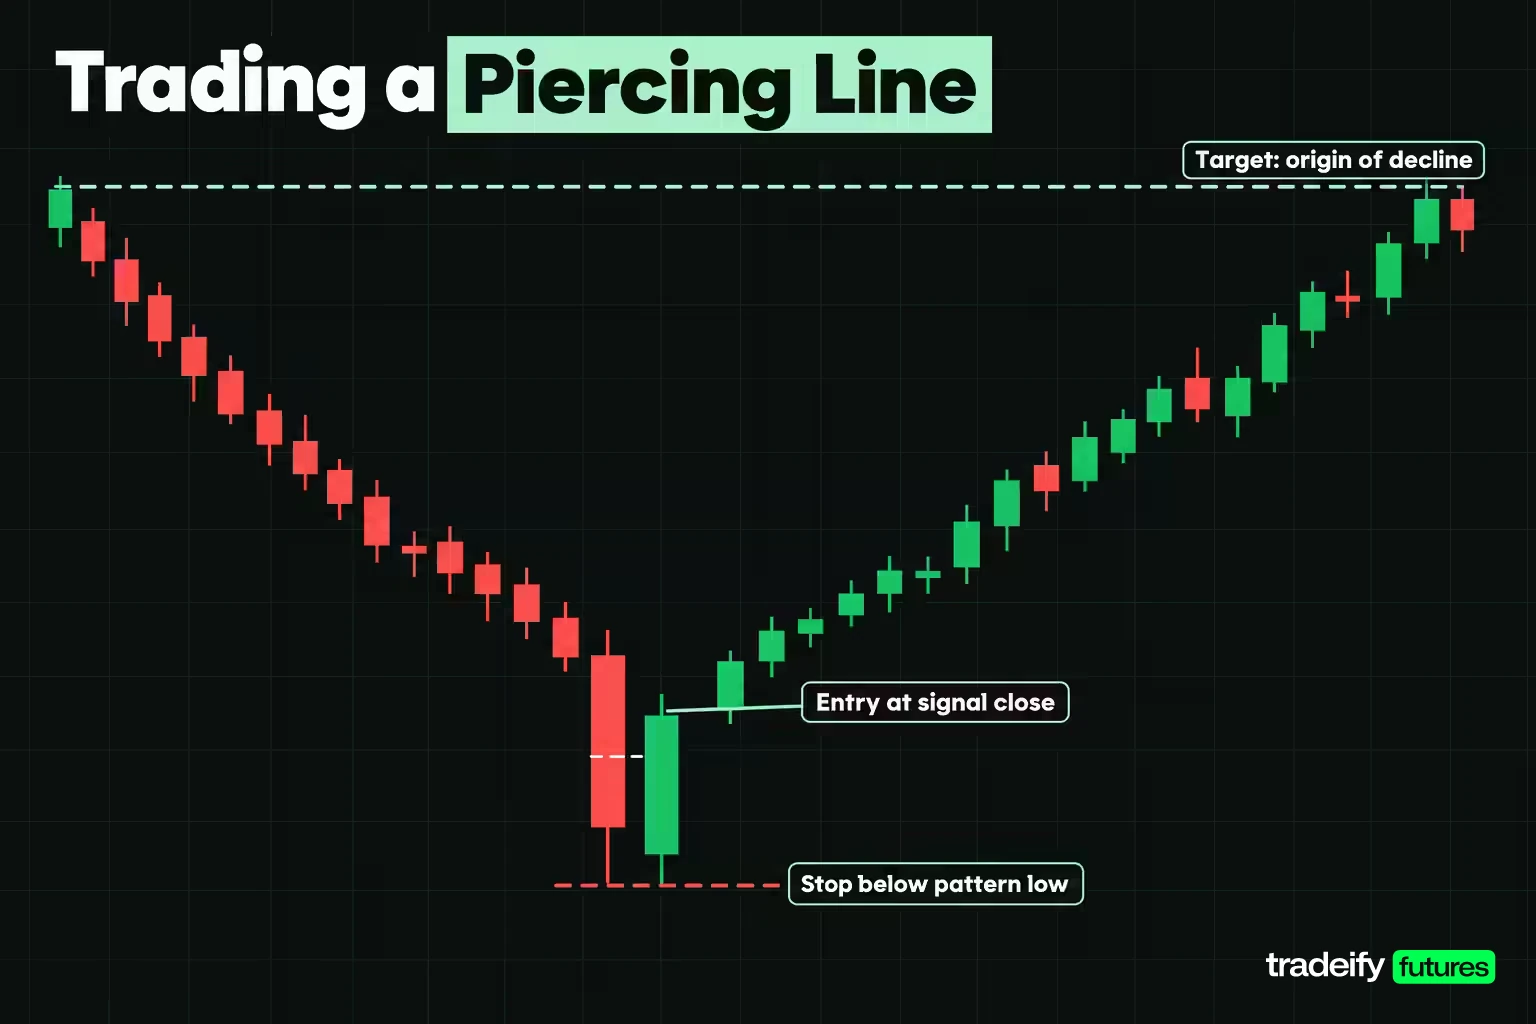
Trading a piercing line or dark cloud cover comes down to four decisions made before the order goes in: the entry, the stop, the target and the size. The pattern supplies the stop. Everything else is your plan.
Entry, stop and target for each pattern
The common entries are the signal candle's close, a confirmation close beyond the signal candle, or a limit order on a pullback toward the midpoint. The common stop goes one tick beyond the two-candle extreme, which is the lowest low of the pair for a piercing line and the highest high for a dark cloud cover. A logical target is the origin of the prior move or the nearest opposing level.
Pricing shallow, clean and deep closes
The table prices the illustrative ES construction on both sides with the stop one tick past the pattern extreme and the same assumed $5.00 Micro E-mini round-turn cost. The Micro E-mini is $5 per index point with a 0.25 point tick worth $1.25.
| Side and close | Penetration | Risk | Reward | Reward to risk before cost | After cost | Break-even hit rate | Micro E-mini risk |
|---|---|---|---|---|---|---|---|
| Long, shallow 6027.25 | 50.96% | 21.50 points, 86 ticks | 44.75 points, 179 ticks | 2.08 to 1 | 1.94 to 1 | 33.96% | $107.50 |
| Long, clean 6031.50 | 67.31% | 25.75 points, 103 ticks | 40.50 points, 162 ticks | 1.57 to 1 | 1.48 to 1 | 40.38% | $128.75 |
| Long, deep 6038.00 | 92.31% | 32.25 points, 129 ticks | 34.00 points, 136 ticks | 1.05 to 1 | 0.99 to 1 | 50.19% | $161.25 |
| Short, shallow 6024.75 | 50.83% | 20.50 points, 82 ticks | 44.75 points, 179 ticks | 2.18 to 1 | 2.03 to 1 | 32.95% | $102.50 |
| Short, clean 6020.00 | 66.67% | 25.25 points, 101 ticks | 40.00 points, 160 ticks | 1.58 to 1 | 1.49 to 1 | 40.23% | $126.25 |
| Short, deep 6012.50 | 91.67% | 32.75 points, 131 ticks | 32.50 points, 130 ticks | 0.99 to 1 | 0.93 to 1 | 51.72% | $163.75 |
The table runs against intuition. The deepest penetration looks like the strongest reversal, and it is the worst trade on both sides. A deeper close sits further from the pattern extreme, so the stop gets wider while the target gets closer. Both deep rows fall below 1 to 1 after cost and need a hit rate above 50% just to break even.
Sizing a piercing line trade from the stop
Size for a piercing line or dark cloud cover comes from the stop, not from the pattern's reputation. Take an illustrative ES piercing line with a 6027.25 close and a 21.50 point stop, and a deeper version with a 6038.00 close and a 32.25 point stop. On an illustrative $25,000 account risking 0.5% per trade, the budget is $125. One E-mini on the shallow version risks $1,075.00, or 4.30% of the account, and one on the deep version risks $1,612.50, or 6.45%. The E-mini does not fit that budget at all.
The Micro E-mini, at $5 per point, fits once on the shallow piercing line at $107.50, and once on a shallow dark cloud cover with a 20.50 point stop at $102.50. Clean and deep closes with stops of 25.25 points or more risk over $125 per Micro, so they size to zero. When the stop is too wide for one contract, skip the trade. Moving the stop inside the pattern to make the size work turns a defined invalidation into a guess.
Related lesson: Position sizing
Market Conditions and Timeframes for These Candlestick Patterns
Market conditions change what a piercing line or dark cloud cover can tell you. In a clean trend, the pattern is most useful at the end of a pullback, where it says the counter-move has failed and the trend may resume. In a choppy range, two-candle reversals appear constantly at both edges and in the middle, and most of them mean very little.
The open condition interacts with the market you trade. Stocks have a closed overnight period, so a gap beyond the prior high or low is common on daily stock charts. ES trades nearly around the clock with only a one-hour daily break, so its next bar usually opens close to the prior close. On intraday futures bars, the strict gap rule rarely fires outside the session reopen or a sharp news move. That is one reason so many futures charting tools use the looser open test, and one reason statistics built on daily stocks may not carry over.
Timeframe is a trade-off between noise and stop width. Lower timeframes produce more patterns and more false ones, because a two-candle shape on a 1-minute chart can come from a single order. Higher timeframes produce fewer patterns with wider stops. In an illustrative ES piercing line or dark cloud cover with a first body of 26.00 to 30.00 points, a stop one tick beyond the pattern sits 20.50 to 32.75 points from the entry, which is $1,025.00 to $1,637.50 on one E-mini.
A common approach is to find the location on a higher timeframe and take the pattern on a lower one, so the stop stays small while the level still matters.
Related lesson: Multiple timeframe analysis
Advantages of Trading Piercing Line and Dark Cloud Cover Patterns
The advantages of the piercing line and dark cloud cover pattern are mostly practical. They come from the structure of the shape more than from its success rate.
- A clear invalidation. The two-candle extreme is a known price before you enter, so the stop is defined by the pattern rather than guessed.
- An objective test. The midpoint and the open bound are numbers, so two traders or a script can agree on whether the pattern exists.
- Enough frequency to build a sample. Bulkowski ranks the piercing pattern 40th and the dark cloud cover 46th of 103 for frequency, which is mid-list. They appear often enough to journal a meaningful number of cases.
- A readable sentiment shift. The second candle shows one side taking back most of the other side's session, which is easy to see and explain.
- Portable across markets. The test needs only open, high, low and close, so it applies to futures, stocks, forex and crypto charts, with the open-condition caveat for near-24-hour markets.
The advantage that matters most is the first one. A known stop turns a vague reversal idea into a priced trade you can accept or reject, and rejecting it is a perfectly good outcome.
Limitations and Published Reliability of Both Patterns
The main limitation of both patterns is that their published reliability is modest. Bulkowski describes the dark cloud cover's reversal performance as poor, and the follow-through data from CandleScanner shows why a reversal rate should never be read as a win rate.
| Source and sample | What was measured | Reported result |
|---|---|---|
| Bulkowski, piercing pattern | Tested as a bullish reversal | 64% reversal rate, frequency rank 40, overall performance rank 13 of 103 |
| Bulkowski, dark cloud cover | Tested as a bearish reversal | 60% reversal rate, frequency rank 46, overall performance rank 22 of 103 |
| CandleScanner, 502 S&P 500 stocks, 2,236,421 daily candles, July 1995 to June 2015 | Dark cloud cover frequency | 4,109 occurrences, 0.64% of all pattern occurrences, average frequency 544.3 candles |
| CandleScanner, 5-candle testing period | Dark cloud cover follow-through | 18.49% FALSE, 34.22% LOW, 20.00% MEDIUM, 27.24% HIGH |
| CandleScanner, 10-candle testing period | Dark cloud cover follow-through | 16.91% FALSE, 28.30% LOW, 17.77% MEDIUM, 36.75% HIGH |
Add CandleScanner's FALSE and LOW rows and 52.71% of its dark cloud covers showed no clear move over five candles, falling to 45.21% over ten. Roughly half the time, the pattern was weak or wrong.
Why a reversal rate is not a hit rate
A reversal rate counts whether price changed direction at all. A hit rate counts whether it travelled far enough to reach your target before your stop. A 60% reversal rate can still lose money if the reversals are small and the stop is wide.
The other limitations follow from the definition:
- Statistics measured on daily US stocks with a strict gap may not hold on intraday futures bars with a loose open test.
- A tall pattern means a wide stop, and the deep-penetration versions price below 1 to 1.
- The pattern says nothing about how far the reversal will run, so the target always comes from somewhere else.
- Both patterns are common enough that a trader looking for one will usually find one.
Related lesson: Backtesting a trading strategy
Common Piercing Line and Dark Cloud Cover Mistakes
Most piercing line and dark cloud cover losses come from a short list of repeatable mistakes. Each one has a fix that can be written into a rule.
| Mistake | What it looks like | Why it fails | The fix |
|---|---|---|---|
| Rounding the midpoint | A close at or a tick short of 50% is counted | The definition needs a close strictly past the midpoint | Compute the midpoint as an exact price and require a close beyond it |
| Calling an engulfing a piercing line | The second close passes the first candle's open | The shape and its record change once the body is covered | Check the upper bound before quoting any statistic |
| Mixing open rules | Loose-open pairs judged by strict-open statistics | The published rates came from the gap version | Fix one open rule and keep your sample consistent |
| Ignoring stop width | A deep penetration is taken because it looks strong | The stop widens and the target shrinks | Price the trade and skip it below 1 to 1 after cost |
| No prior move | The pair prints in the middle of a range | There was no push to fail | Require a measured prior move into a level |
| Fighting the primary trend | A piercing line inside a full downtrend | Bulkowski found that setup performed worst | Trade it as the end of a pullback in the main trend |
| Carrying the old plan after confirmation | The original ratio is used for a later entry | The entry moved and the stop did not | Re-price the trade at the entry you actually got |
| Finding the pattern after deciding | The pattern is used to justify a planned trade | A search for the shape will usually succeed | Run the checklist before looking for a reason |
Why deep penetration is the costliest pattern mistake
The deep-penetration mistake is arithmetic, not judgement. On the illustrative ES long, the 6038.00 close penetrates 92.31% of the red body and leaves a 32.25 point stop against a 34.00 point target, which is 0.99 to 1 after cost. The pattern looks its strongest exactly when the trade is weakest.
Related lesson: Confirmation bias
A Pre-Trade Checklist for Piercing and Dark Cloud Setups
A short checklist keeps a piercing line or dark cloud cover trade honest. Run the six questions in order and stop at the first failure.
- Is there a measured prior move into the pattern, a decline for a piercing line or a rise for a dark cloud cover?
- Does the second candle meet the open rule you fixed in advance, beyond the first candle's extreme or only beyond its close?
- Where is the first body's midpoint as an exact price, and did the second candle close strictly past it?
- Did the second candle stop short of the first candle's open, or is it actually an engulfing pattern?
- Where is the two-candle extreme, and does a reachable target still pay at least 1.5 to 1 after cost from your real entry?
- Does the location make sense, at support or resistance, at the end of a pullback, with the higher timeframe pointing the same way?
If all six clear, size from the stop and write the result in your journal, including the penetration percentage and the open rule used. After a few dozen entries, your own record will tell you more about these patterns on your market than any published table.
Running the checklist under intraday account rules
On our accounts, every position is closed by 4:45 PM ET on regular trading days, and nothing is held overnight. That means a daily piercing line can mark the level, but the trade itself has to work inside one session. Our contract limits also set size, for example 1 mini or 10 micros on a 25K account, so pricing the stop in Micro E-mini terms first is a practical habit. WealthCharts includes Chart Replay if you want to practise the checklist on historical data first.
Related lesson: How to keep a trading journal
Piercing Line and Dark Cloud Cover FAQ
Is the dark cloud cover pattern bullish?
No, the dark cloud cover is bearish. It forms after a rise, its second candle opens above the prior high and closes below the midpoint of the prior green body, and it points down. In Bulkowski's testing it reversed downward 60% of the time.
Is a piercing line bullish or bearish?
A piercing line is bullish. It forms after a decline, its second candle opens below the prior low and closes above the midpoint of the prior red body, and it points up. Bulkowski found it reversed upward 64% of the time.
What is the difference between a piercing line and a bullish engulfing?
The difference is how far the second candle closes. A piercing line closes past the midpoint of the red body but below its open. A bullish engulfing closes above the red candle's open, so its body covers the whole red body.
What is the 3 candle rule?
The 3 candle rule says a two-candle reversal counts only after a third candle closes beyond it, higher for a piercing line and lower for a dark cloud cover. It is a trader convention, not a fixed standard. Price that later entry before you take it, because waiting moves the entry away from the stop.
What are the top 3 reversal candlestick patterns?
By Bulkowski's overall performance ranking of 103 candlestick patterns, the top three are the bearish three line strike, the bullish three line strike and three black crows. Other sources rank them differently, so there is no settled list. The piercing pattern ranks 13th and the dark cloud cover 22nd.
How reliable is the dark cloud cover pattern?
The dark cloud cover is a modest signal on its own. Bulkowski measured a 60% reversal rate, and CandleScanner's scan of 4,109 cases found 52.71% showed weak or no follow-through over five candles. Location, trend and the payoff of the trade matter more than the pattern alone.
Trading Risk for Piercing Line and Dark Cloud Setups
Trading futures involves substantial risk of loss and is not suitable for everyone, and leverage means losses can exceed what you expect on a single trade. A stop order does not guarantee your exit price, and fast markets can fill far from the level you set. Every price, account figure and position size in this guide is an illustrative example, not a record of a real trade or a promise of any result. Published pattern statistics describe past samples and may not repeat. Evaluation and funded prop firm accounts are simulated, and simulated results do not represent live trading. This guide is general education, not investment advice.


