.svg)

.svg)

How to write entry and exit rules that define when a trade is allowed, what invalidates it, and how it ends, then test them without hindsight.

.svg)

Set a maximum trades per day cap from your tested setup frequency and all-in costs, with a loss budget that ends the session.
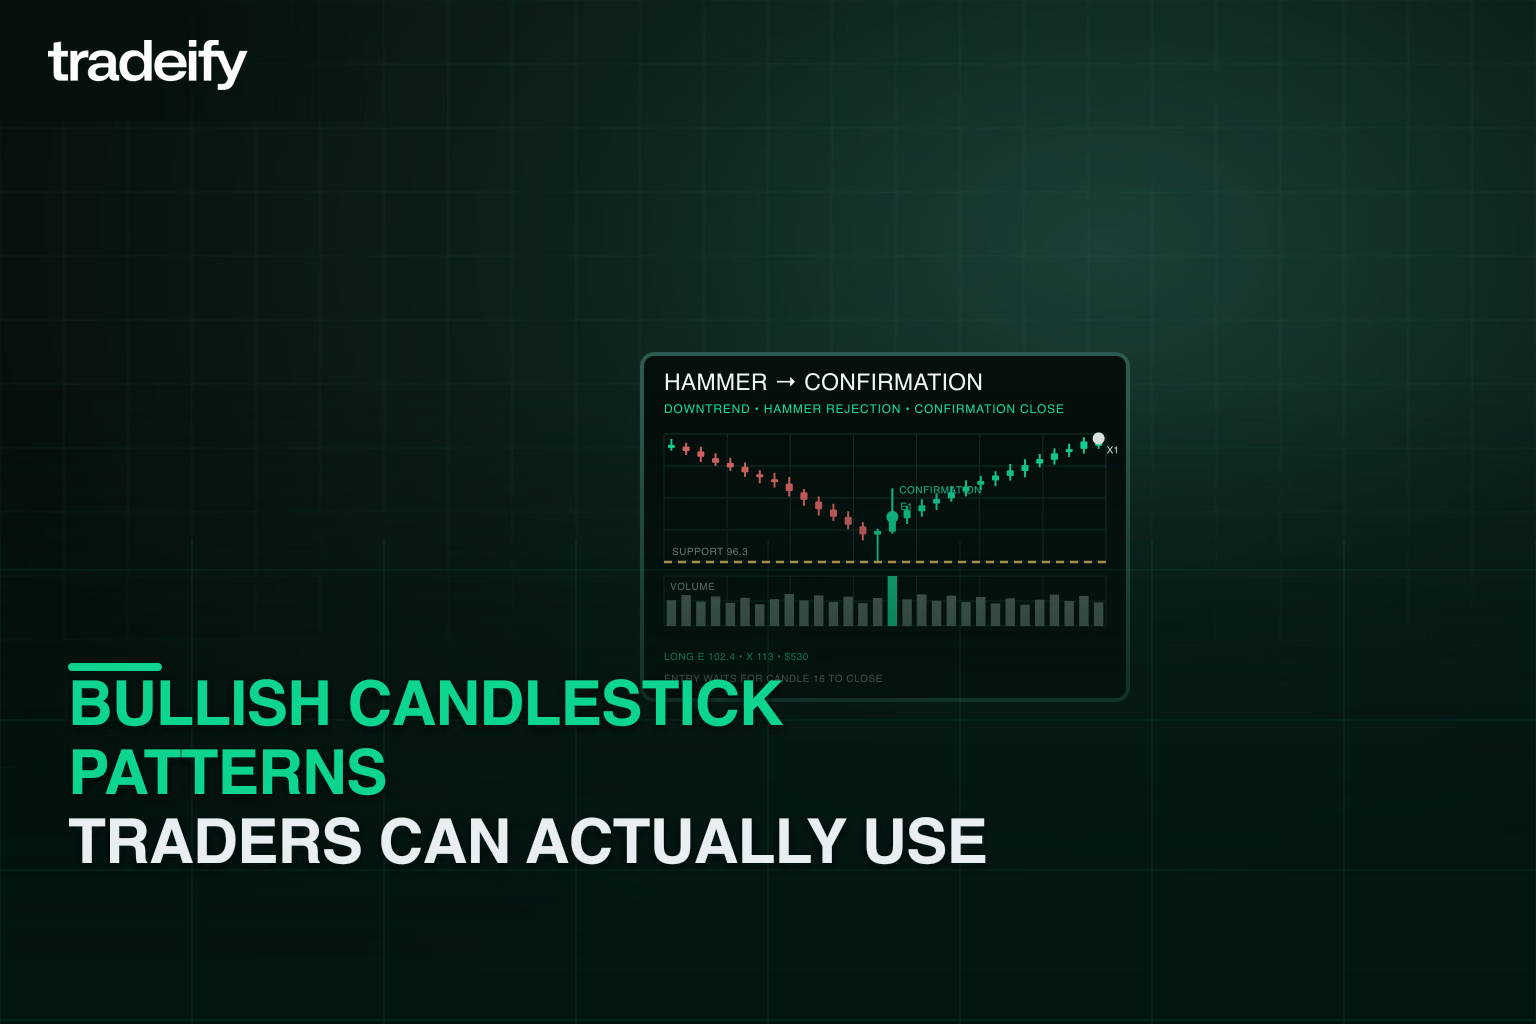
Bullish candlestick patterns can flag a reversal, but context and confirmation decide if a setup is tradable. Learn formations, triggers, and invalidation.

A gamma squeeze explained for futures traders: dealer hedging mechanics, the downside version, and how to manage the volatility without breaking account rules.
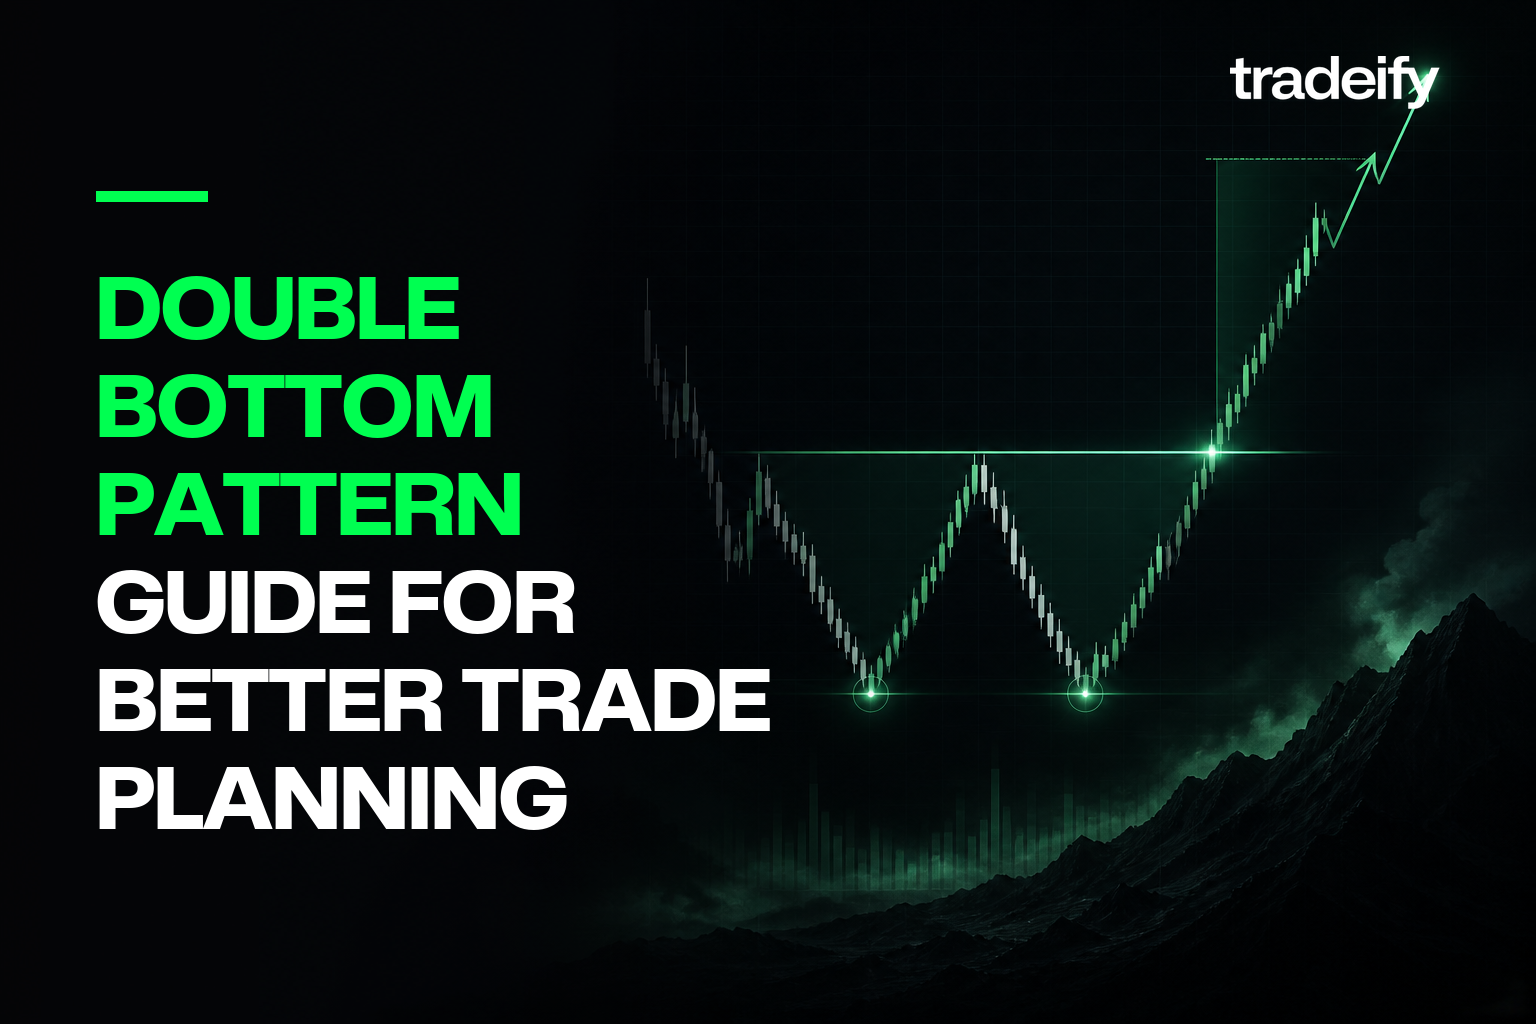
How to read a double bottom pattern, from the two support tests and neckline break to invalidation, measured moves, and position sizing for futures traders.
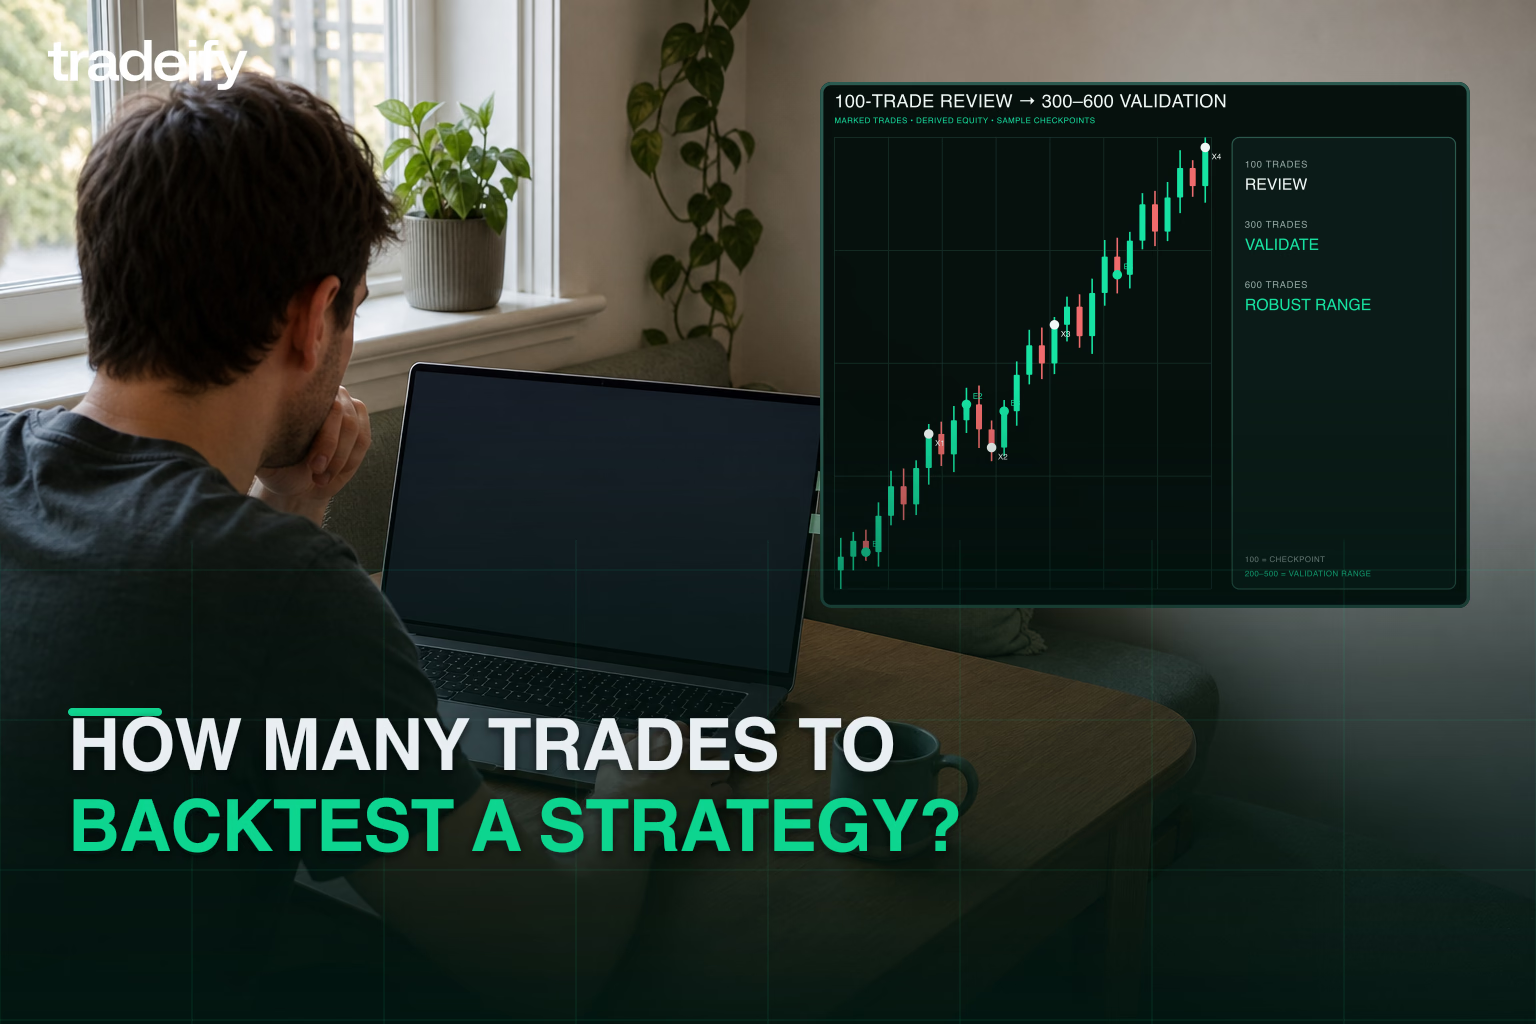
How many trades a strategy backtest needs, why 100 is only a checkpoint, and how bias, costs, and market conditions affect sample reliability.
Market sentiment indicators for day traders, including the VIX, put/call ratio, COT report, Fear and Greed Index, and intraday internals.
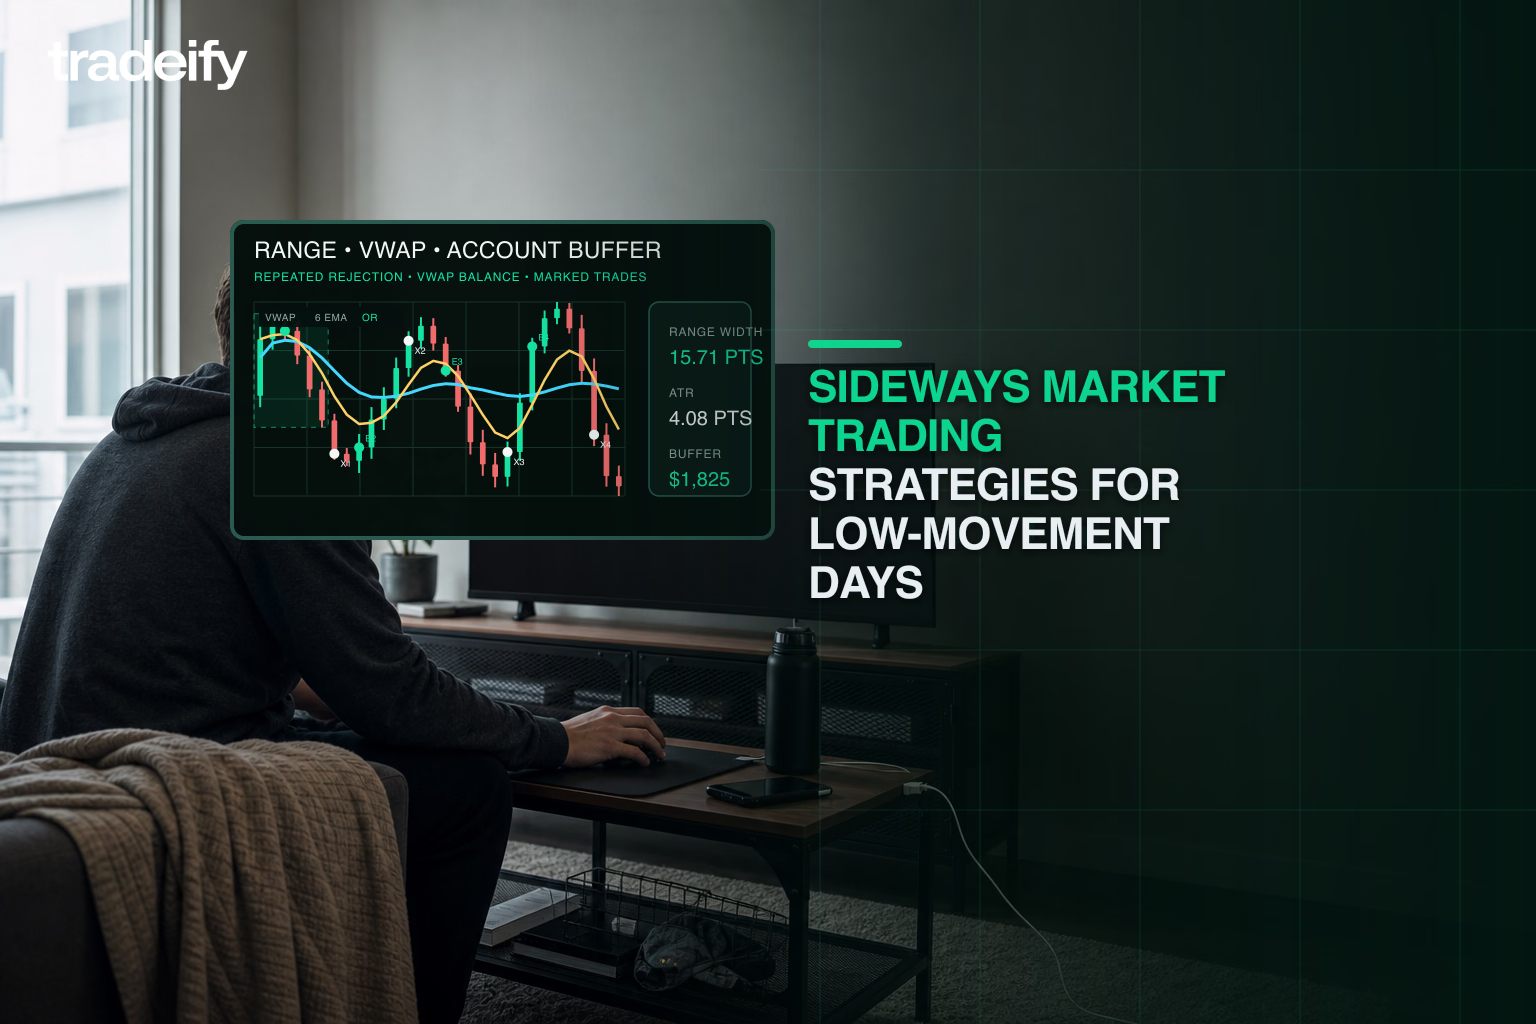
Futures markets spend most of their time ranging. Range fading, VWAP mean reversion, Volume Profile levels, and funded-account risk rules for low-movement days.
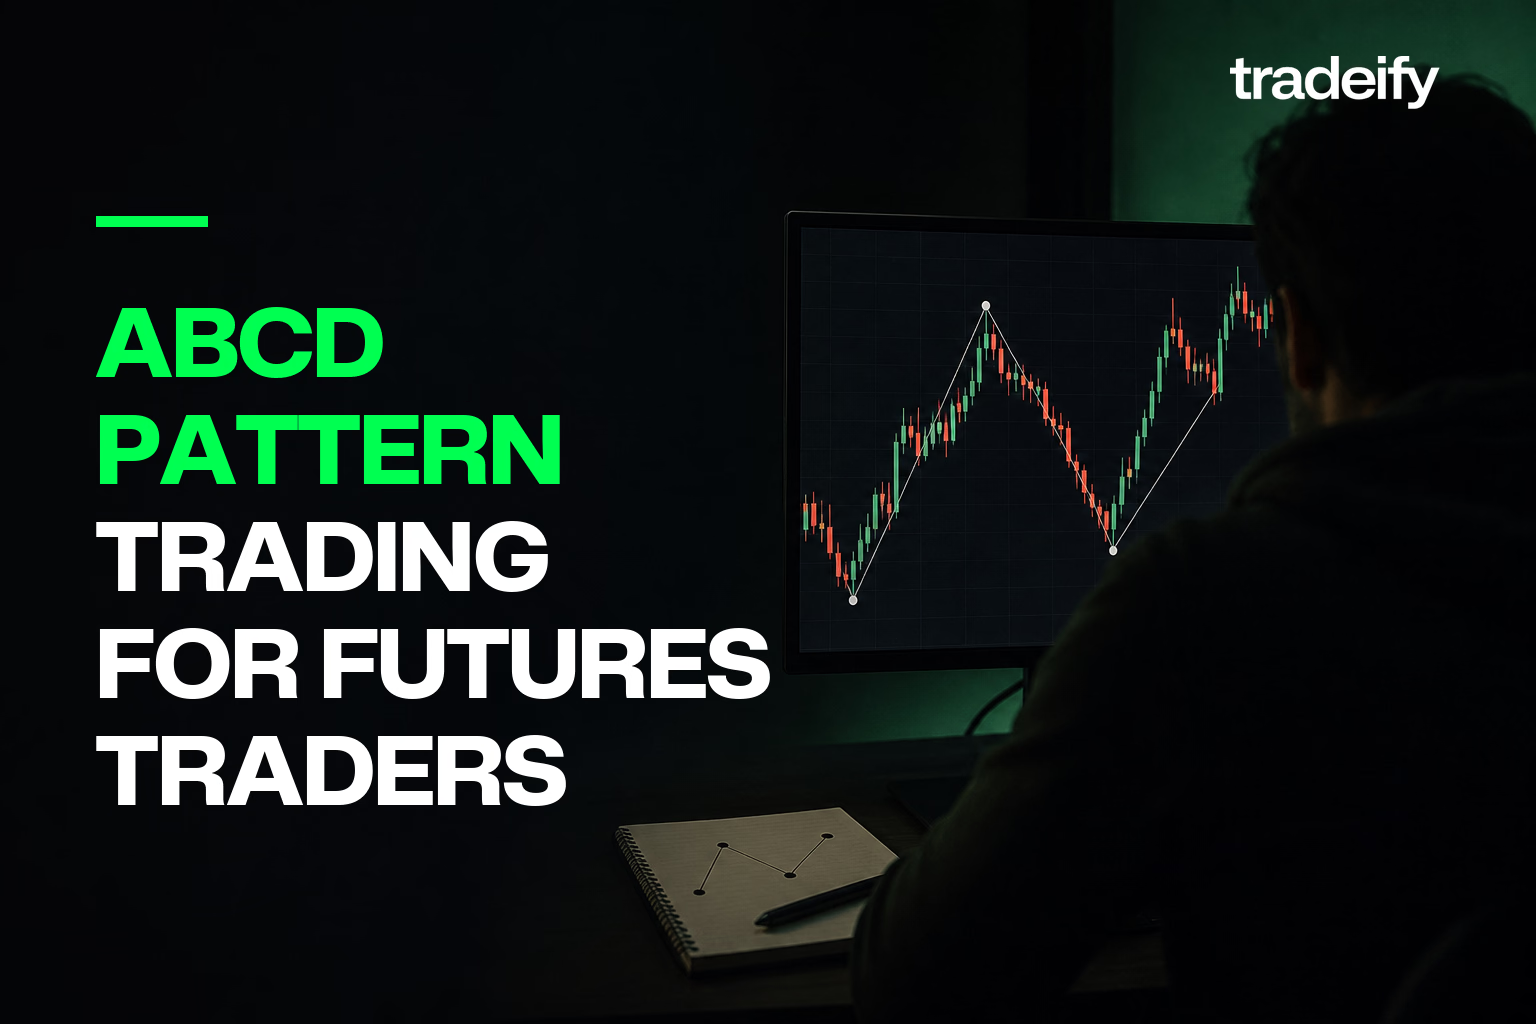
The ABCD pattern explained for futures traders, with the ratios that define the D zone, entry and invalidation rules, and how it compares with other formations.
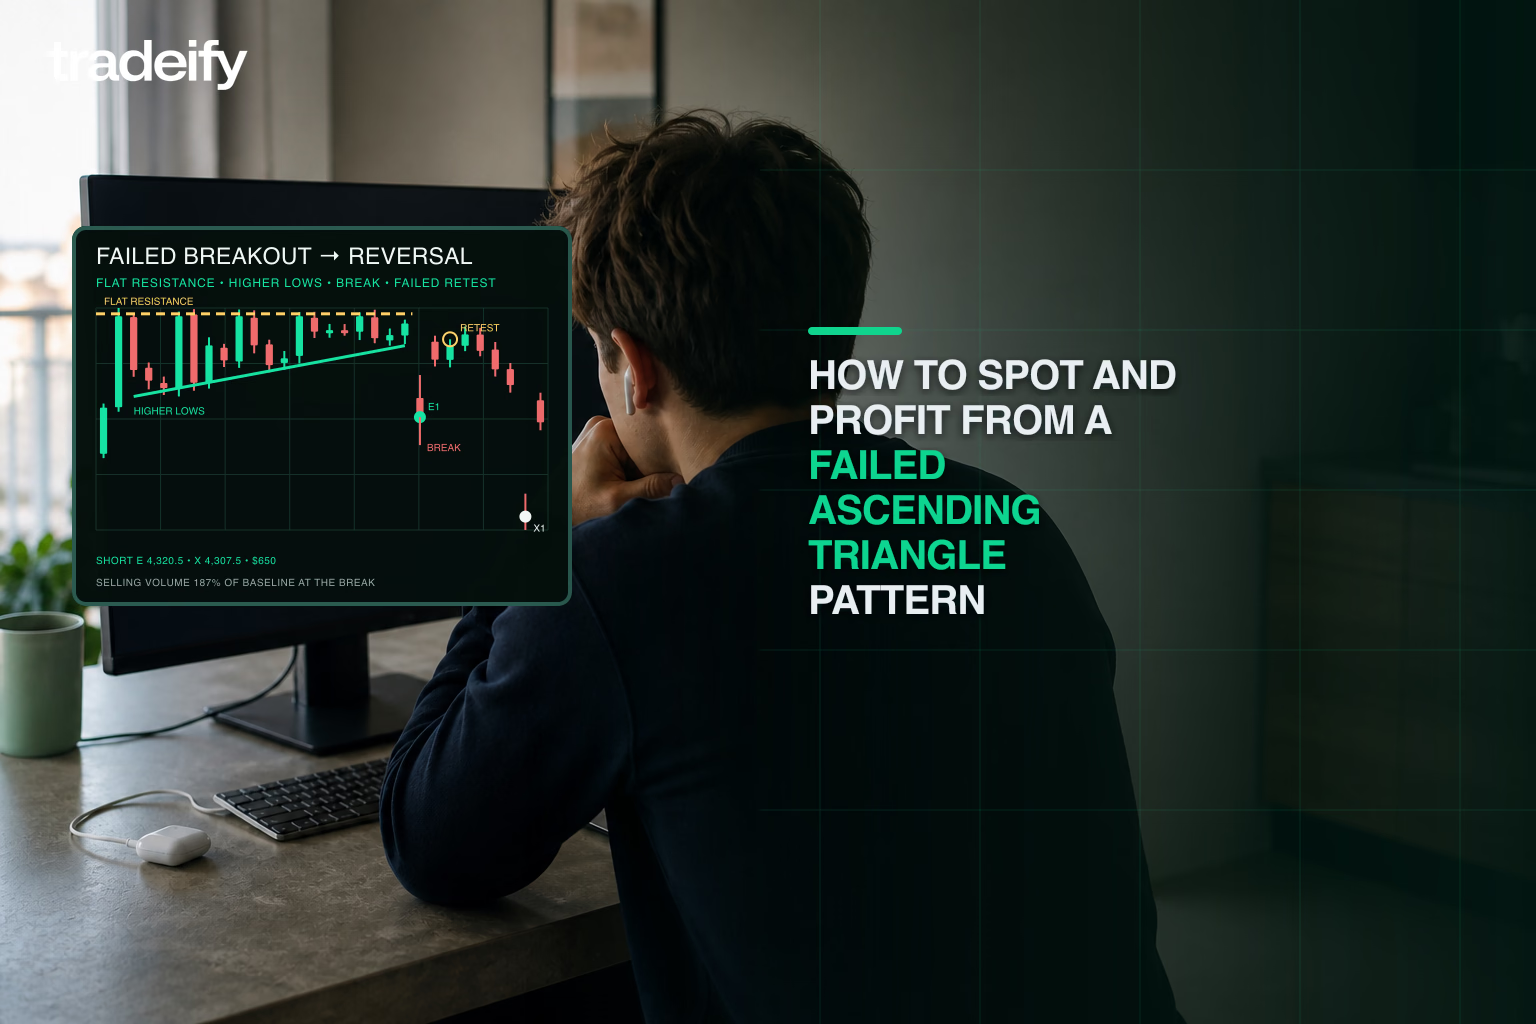
How to spot and trade a failed ascending triangle: breakdown confirmation, volume and divergence filters, triangle comparisons, and market psychology.
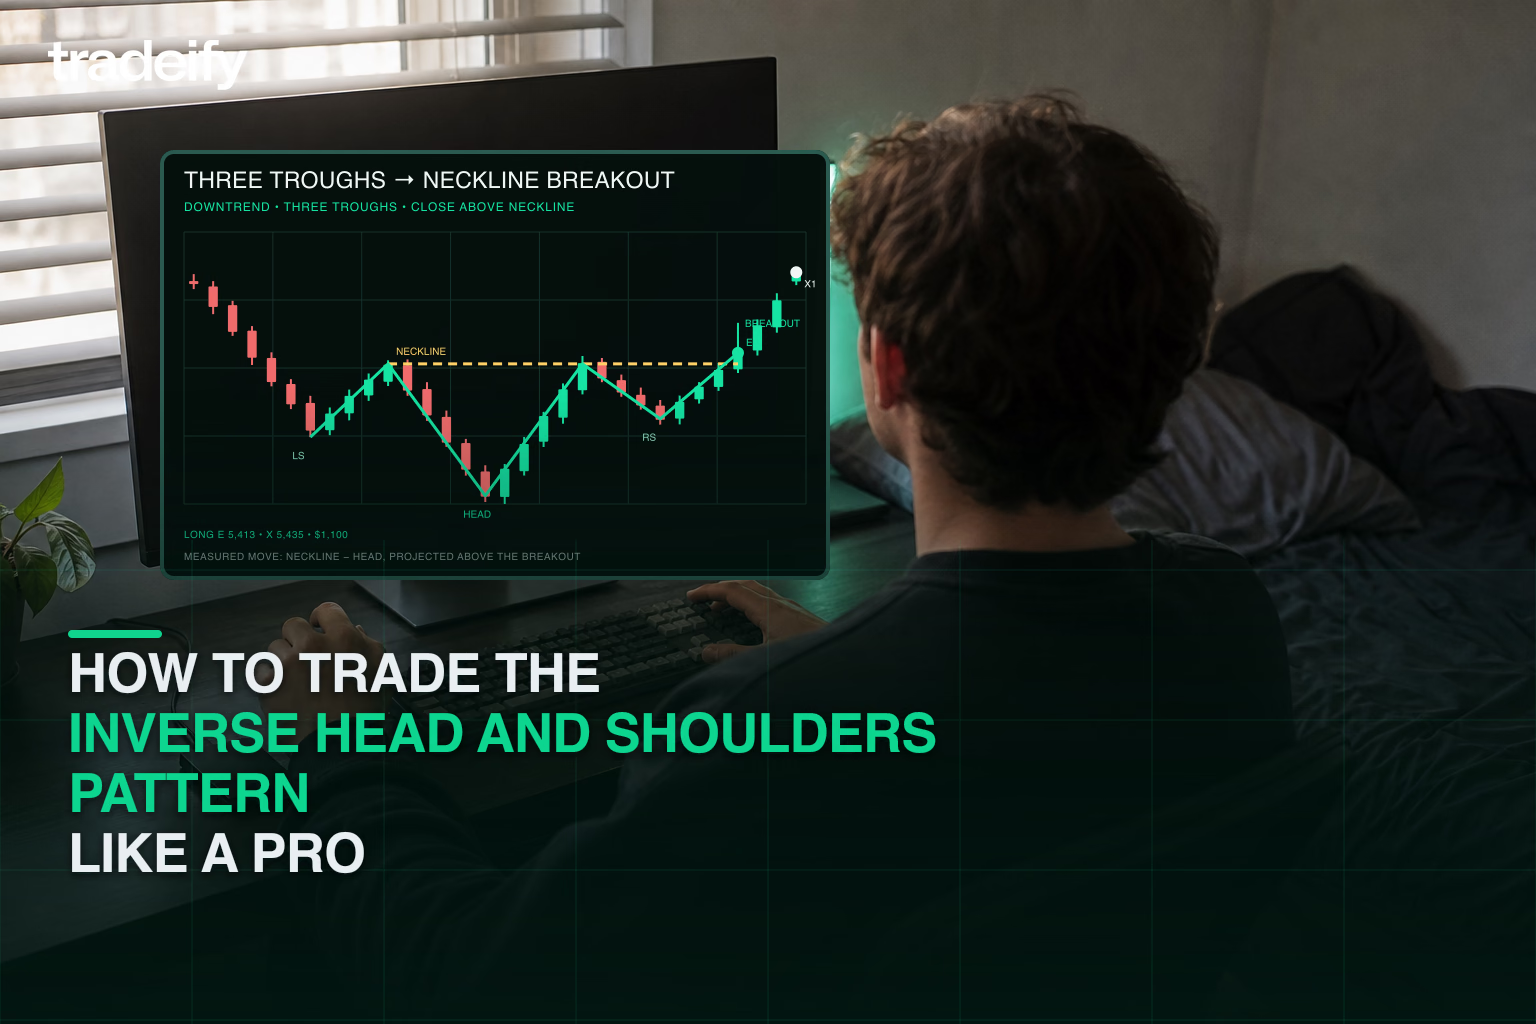
Inverse head and shoulders pattern guide with entry rules, stop-loss placement, profit targets, false breakout risks, and FAQ.

A workable crypto trading strategy defines the market condition, entry, invalidation, exit, position size, and daily risk limit before you place the trade.
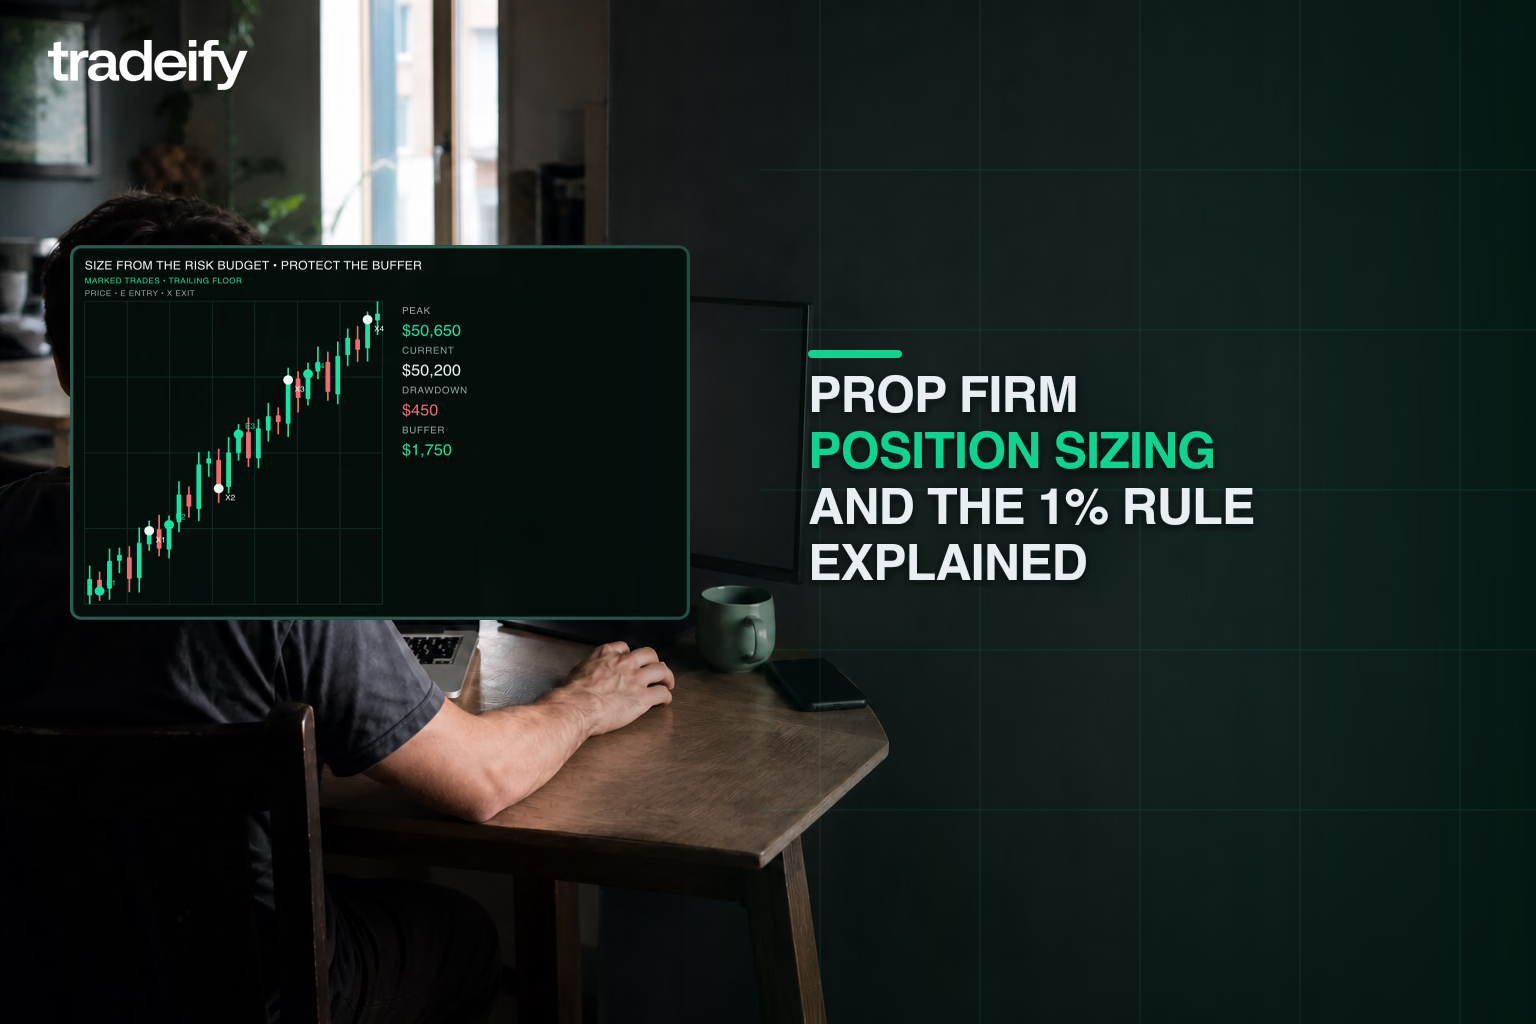
Learn how to apply the 1% rule in prop firm trading, calculate position size from stop distance, and keep risk aligned with your available loss buffer.
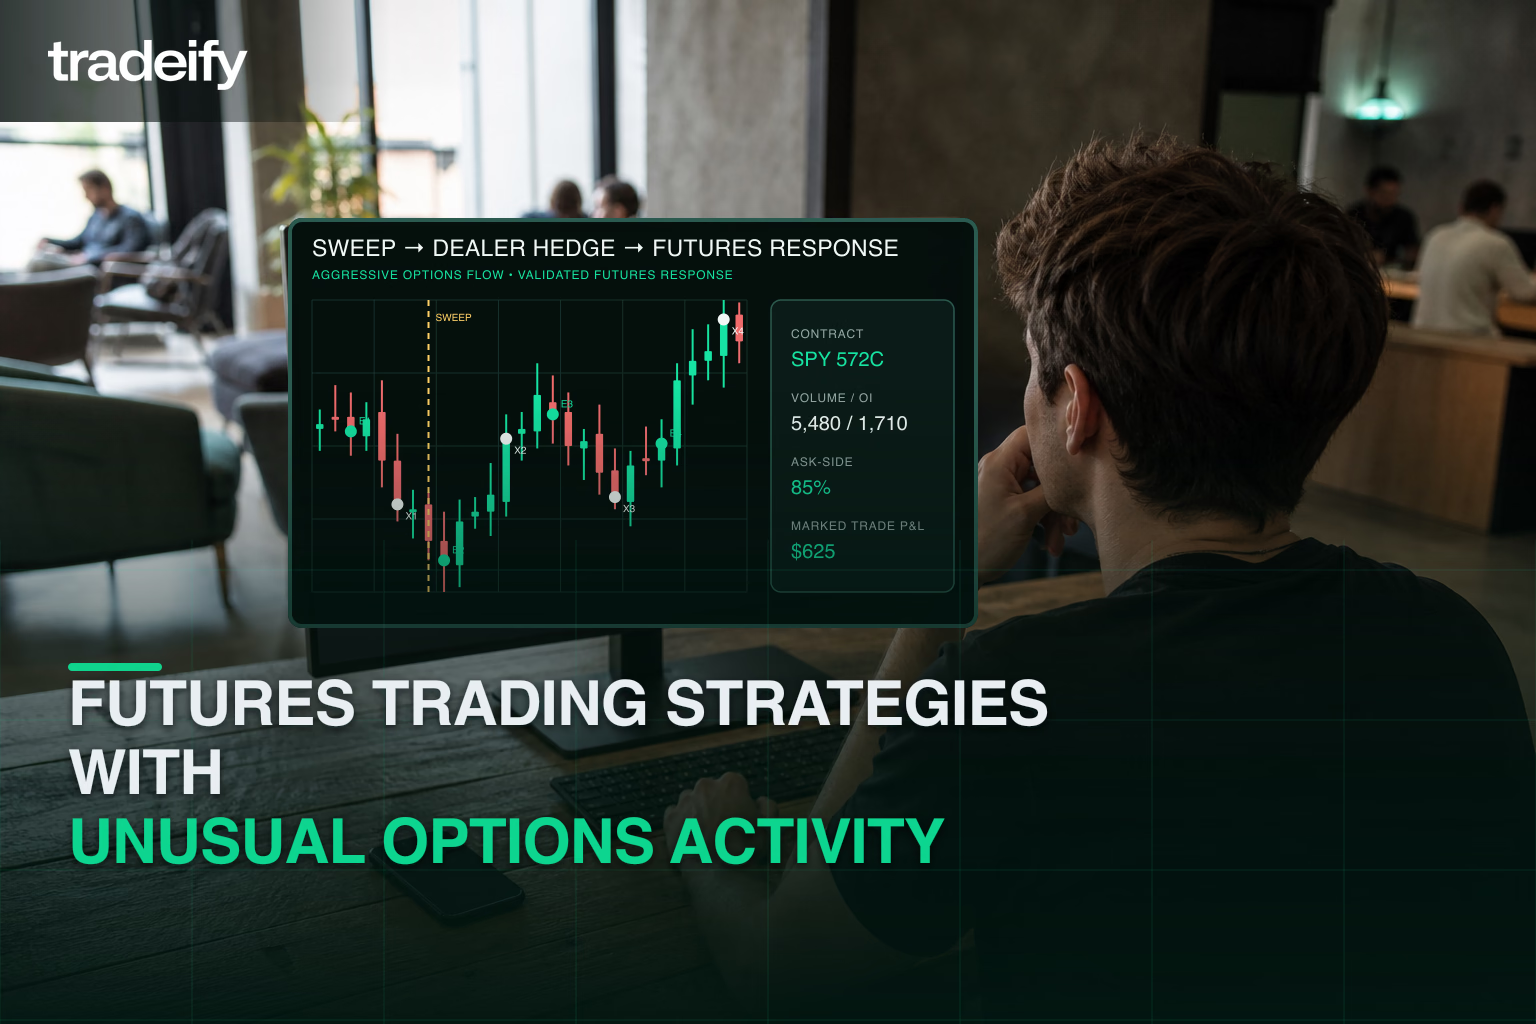
Use unusual options activity in SPY and QQQ to predict ES and NQ futures moves. Learn a Tradeify workflow for entries, risk management, and passing evaluations.
Learn how to stop overtrading in futures with Tradeify by spotting emotional triggers, managing EOD trailing drawdown risk, using Daily Loss Limits, and applying practical rules that protect funded accounts.
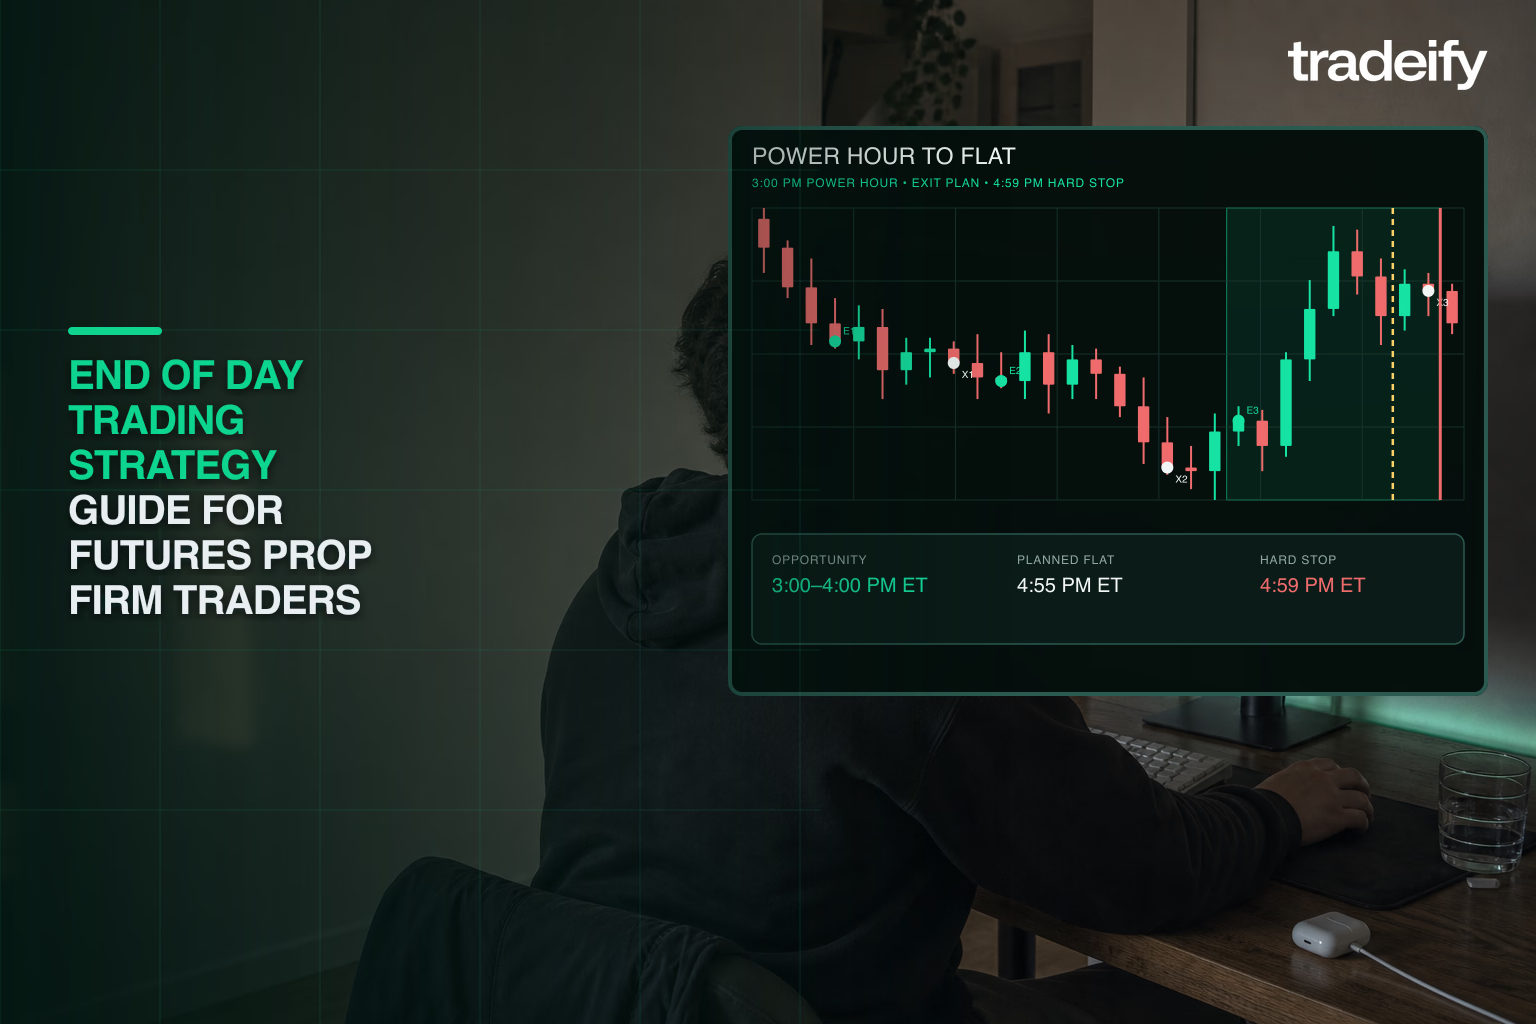
Learn how to trade futures at end of day with Tradeify by using Power Hour setups, exiting before 4:59 PM ET, and managing EOD trailing drawdown to protect your funded account.
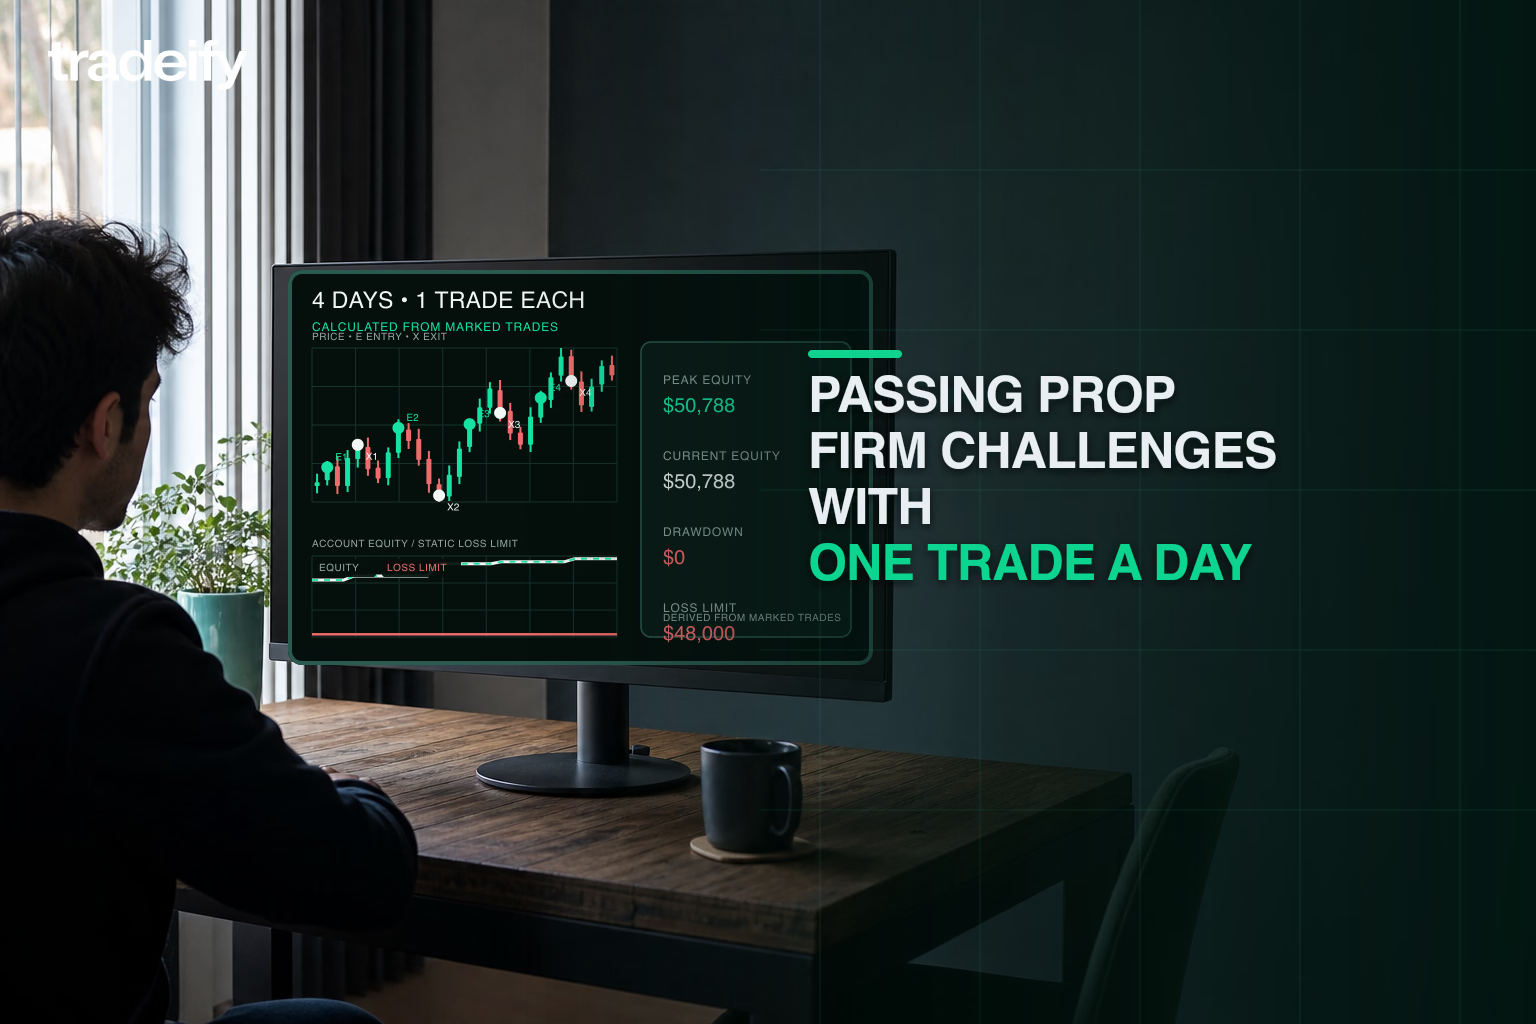
Can you pass a prop firm challenge in one day? Use this scan-first checklist to compare minimum days, consistency caps, drawdown rules, and payout timing.
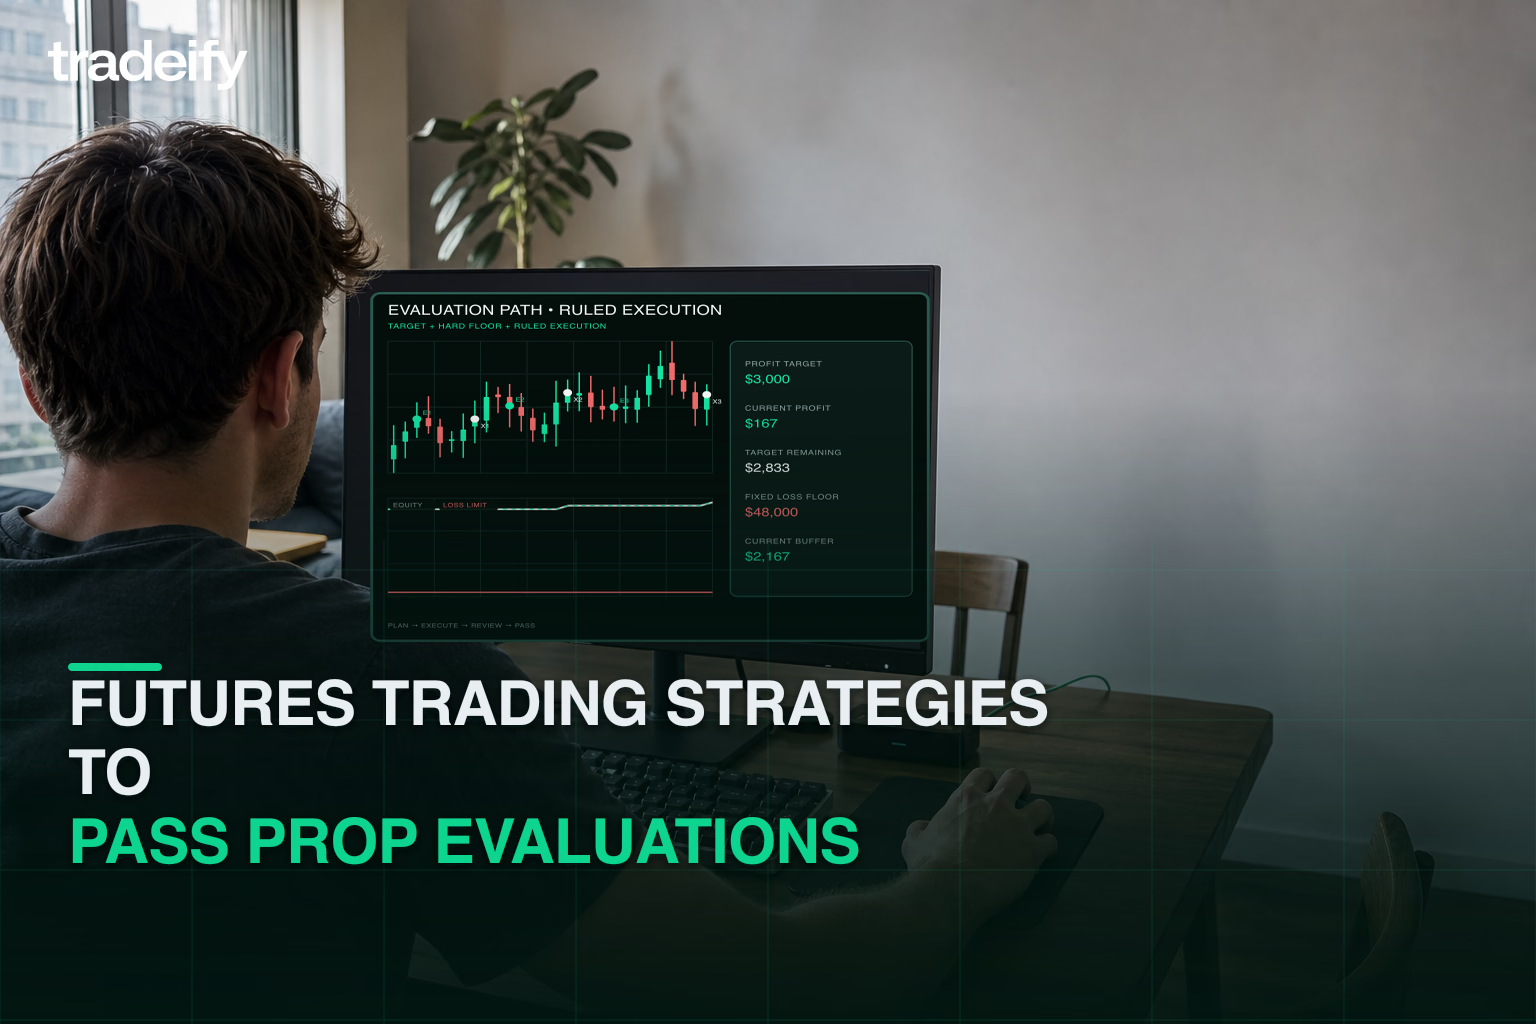
Mechanics-first guide to passing futures prop firm evaluations: consistency math, intraday vs EOD drawdown, day-1 psychology, and the rules that fail most traders.
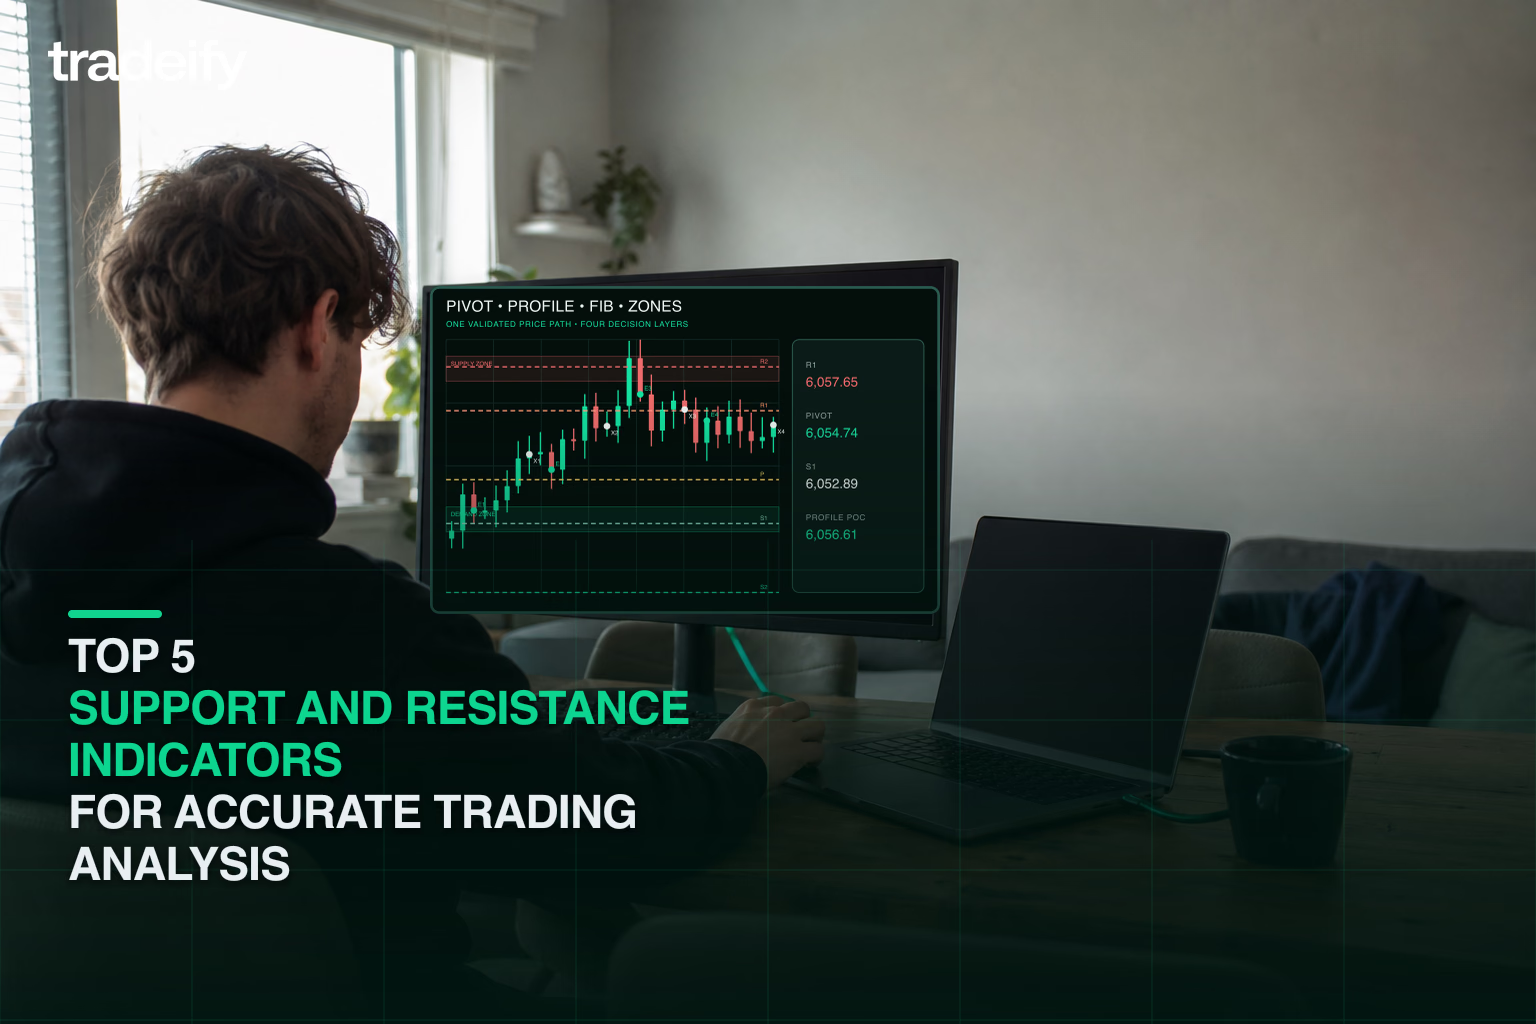
Support and resistance are foundational concepts in technical trading. Understanding where price might pause, reverse, or break through is critical for making informed trading decisions.
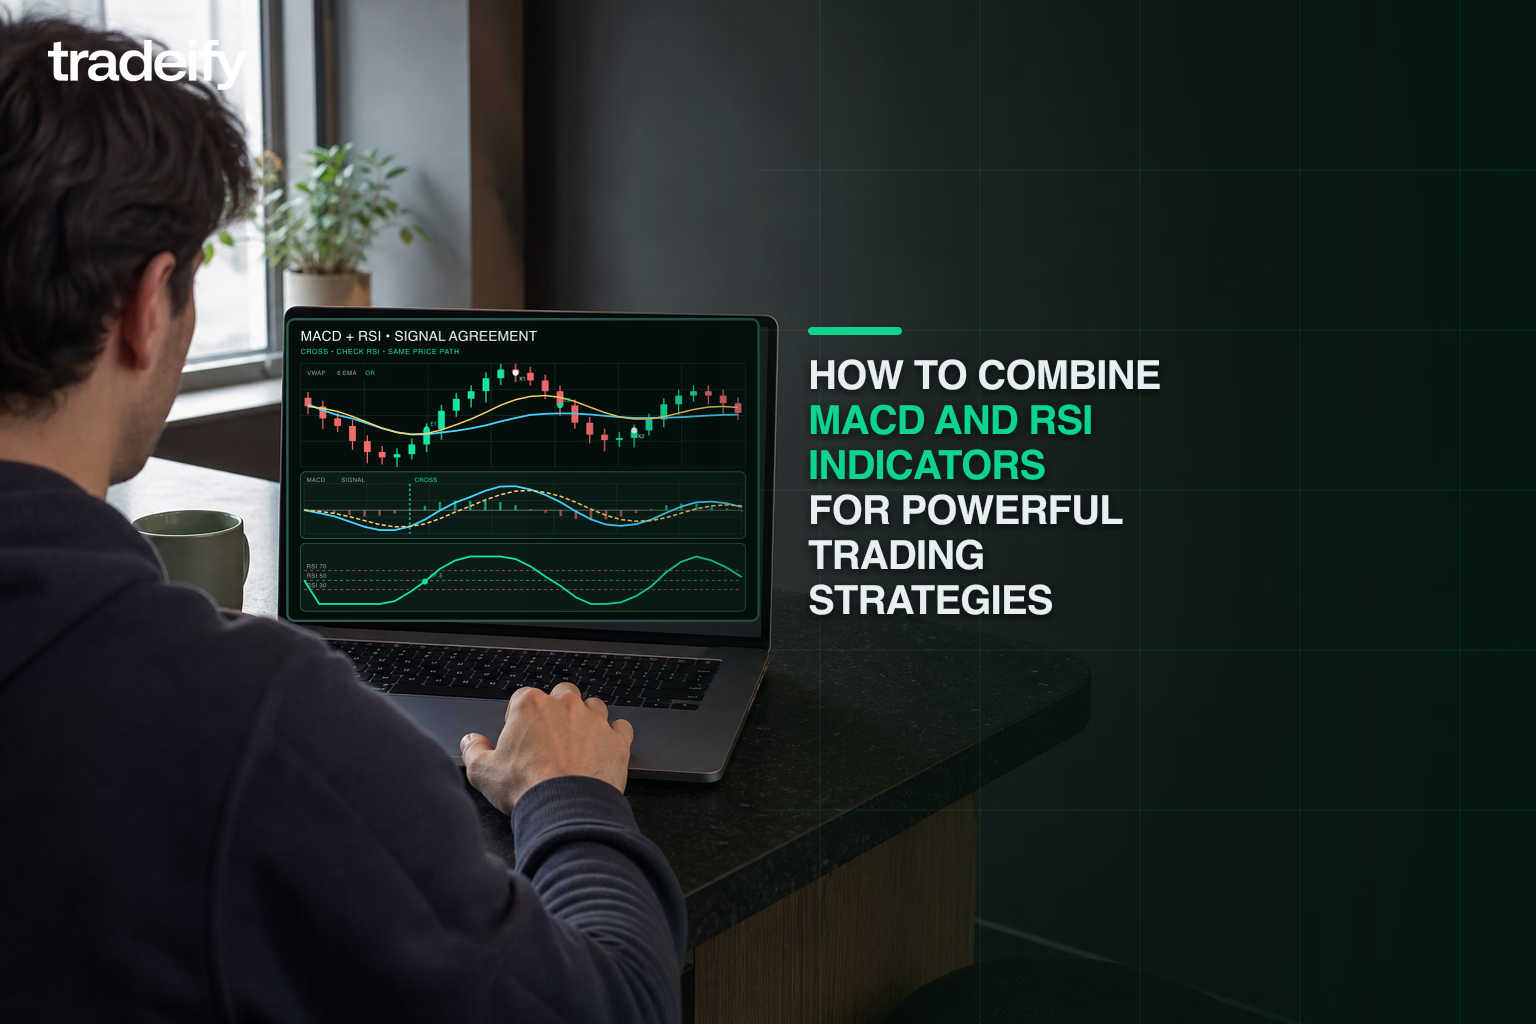
Two of the most widely respected indicators — the MACD and RSI — when used together, can form a powerful strategy for both forex and stock markets. The MACD RSI indicator combination is a proven way to identify trend strength, momentum shifts, and optimal entry and exit points.
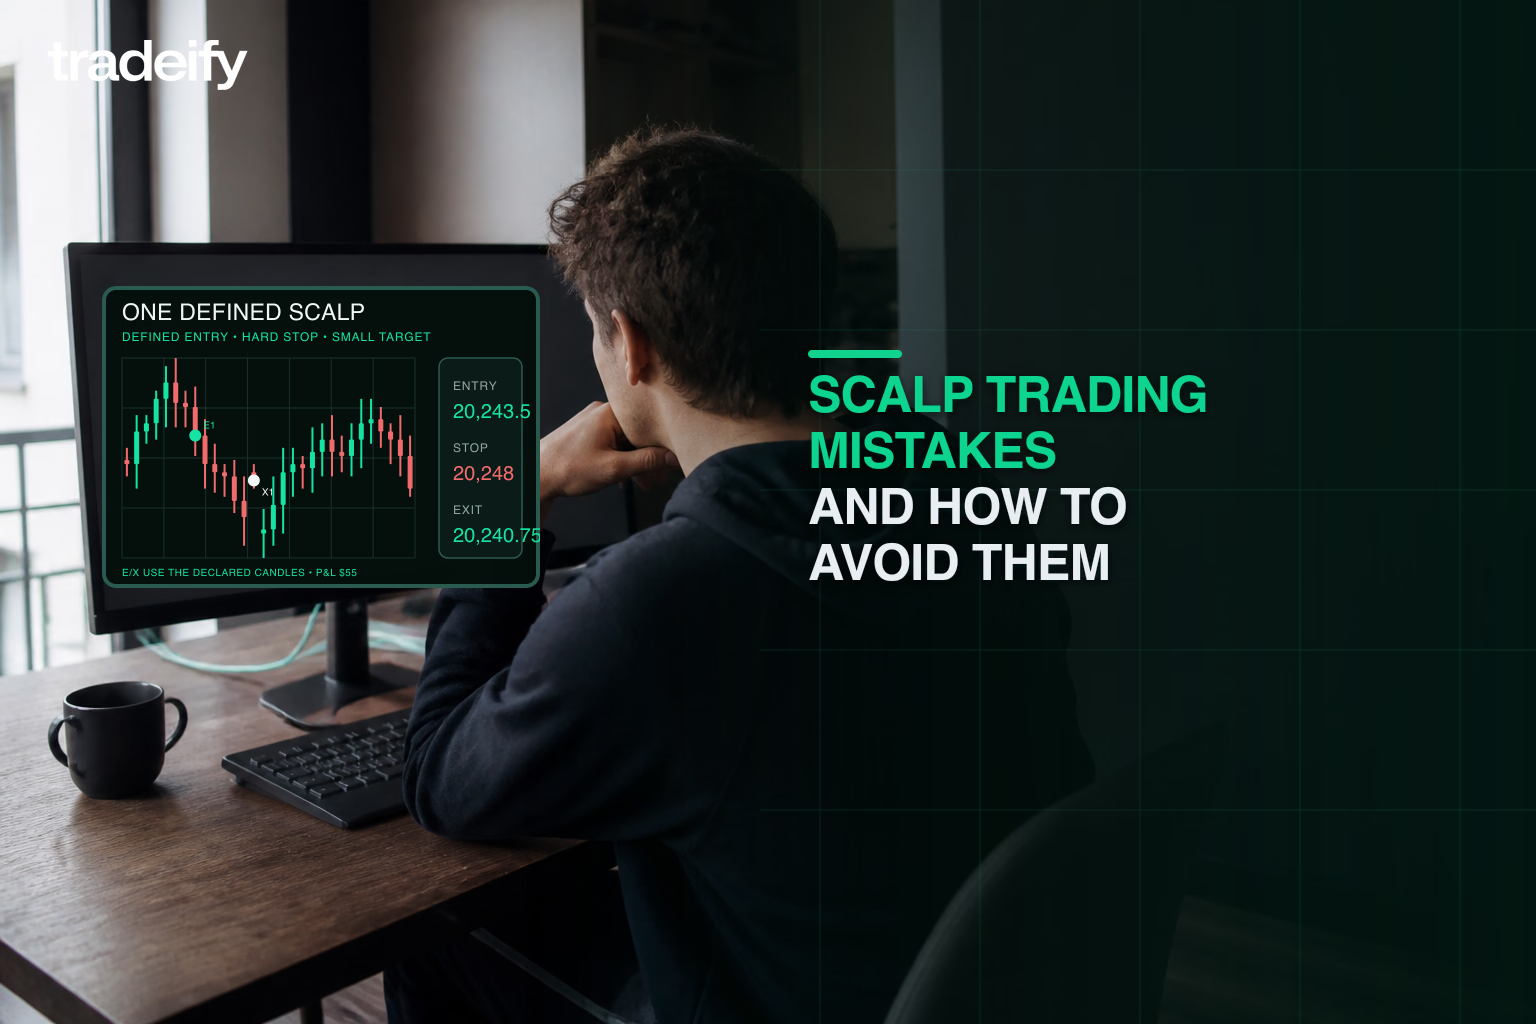
Micro scalping trading targets 1-3 ticks of profit in seconds. This guide covers the definition, how it differs from standard scalping, how prop firms treat it (FXIFY, FundedNext, Tradeify), a practical 1-minute setup, and the order-flow reads that make it work.
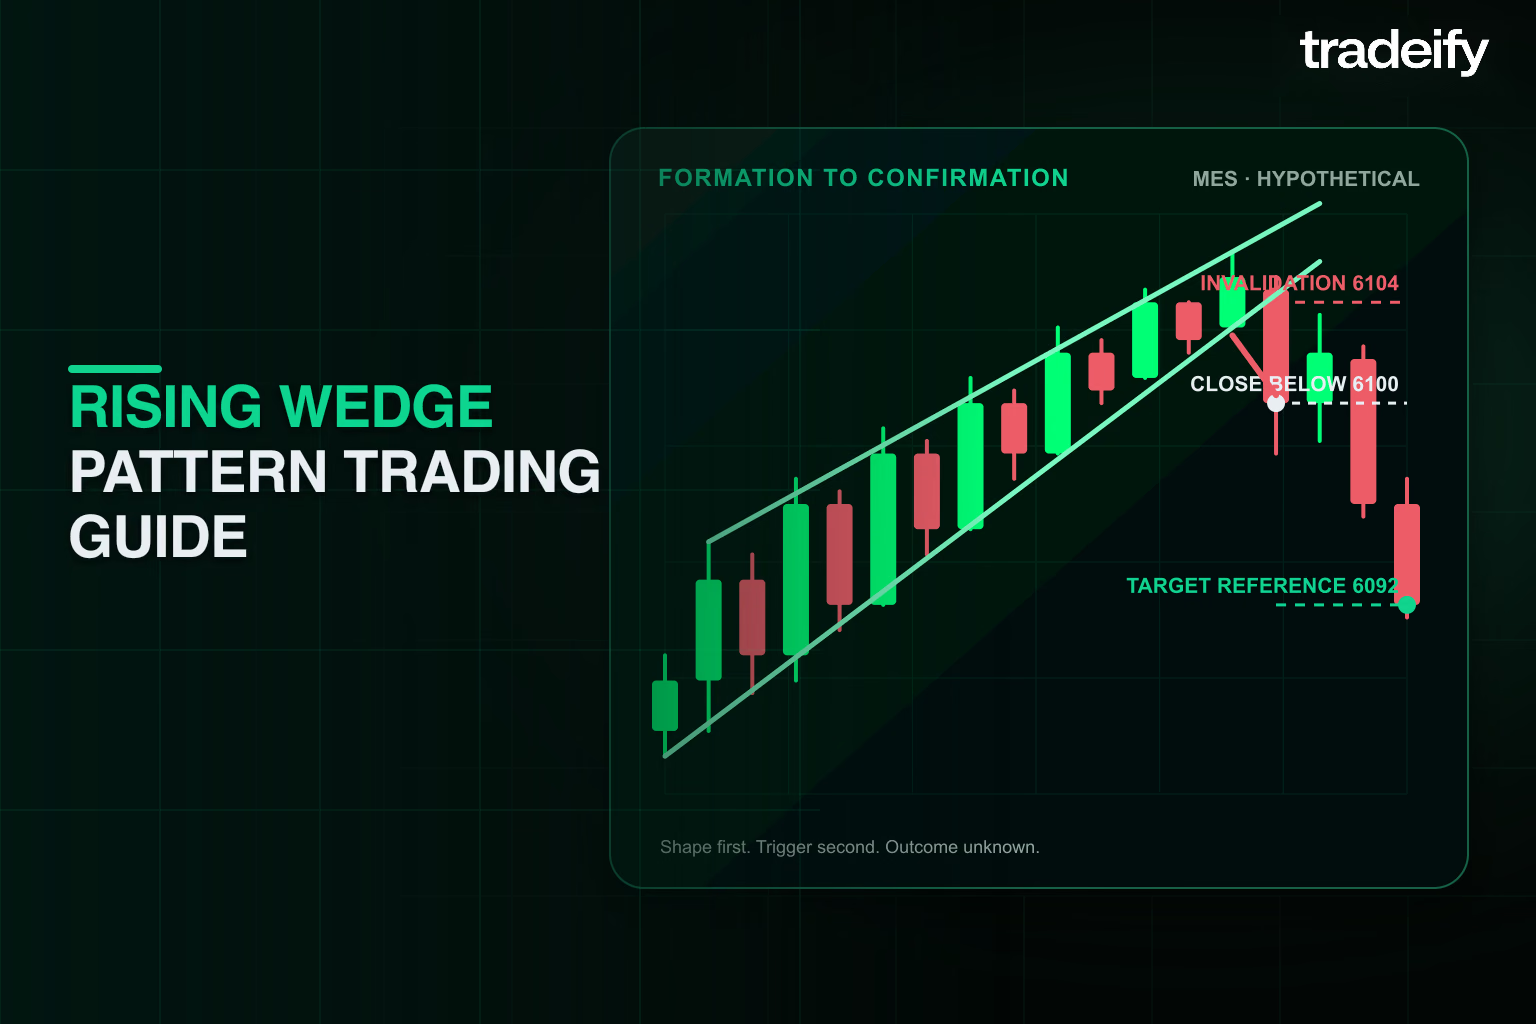
A practical guide to rising wedge geometry, confirmation, invalidation, entry methods, futures position sizing, targets, failed patterns, and backtesting.
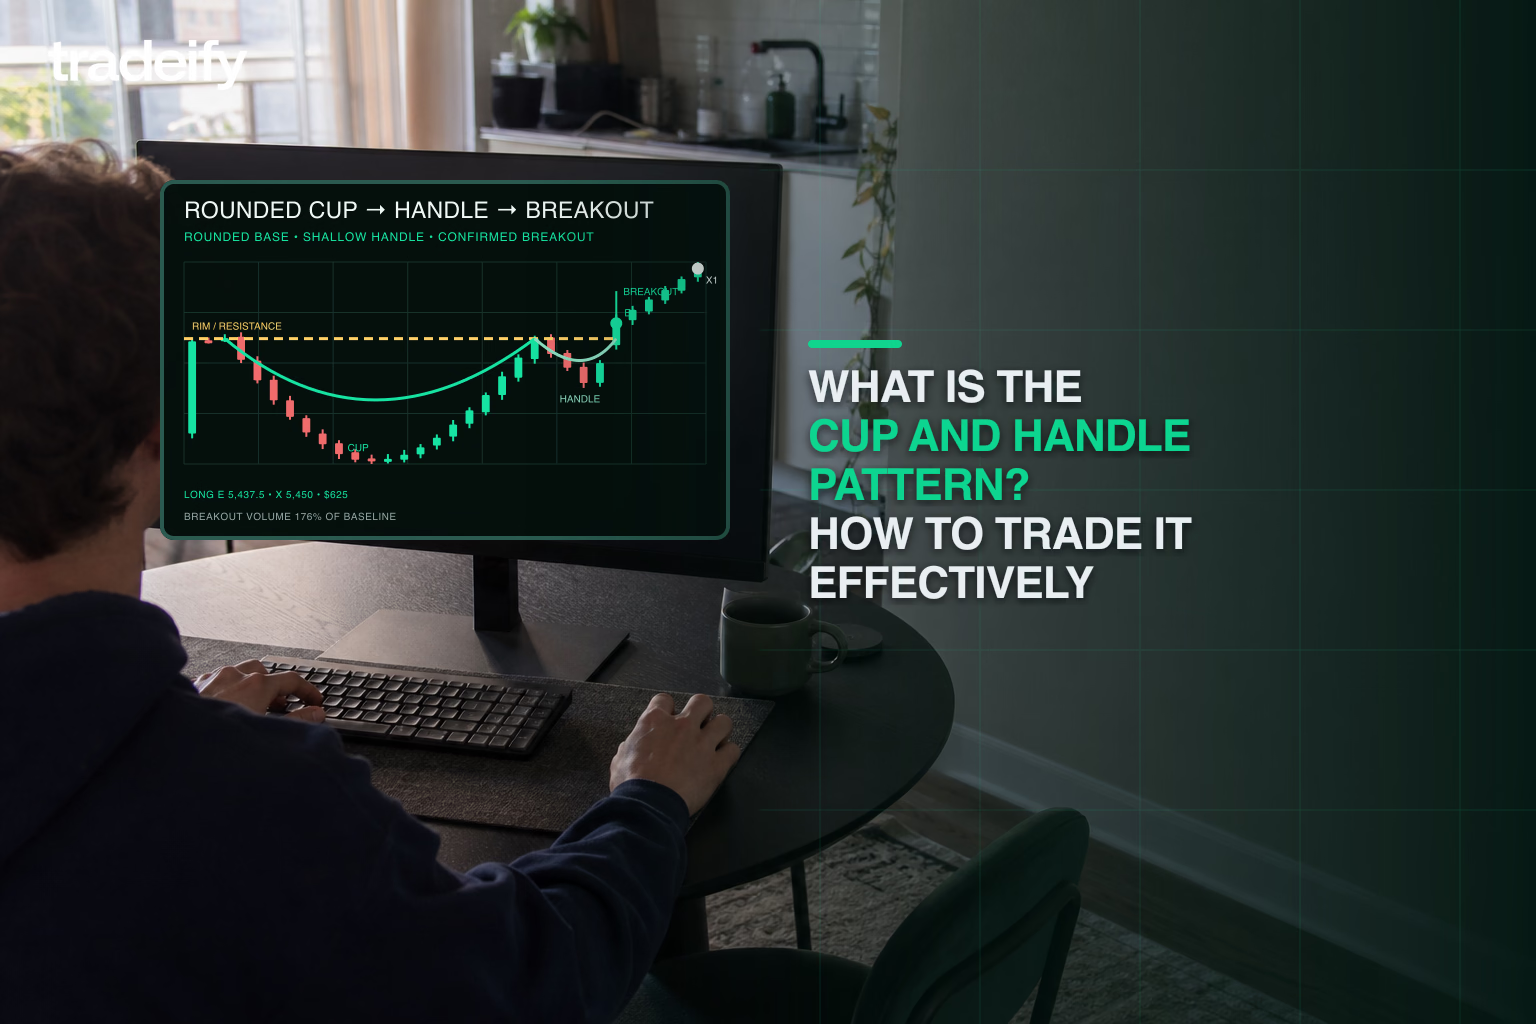
The cup and handle pattern is a bullish chart formation that signals a potential upward breakout. It looks like a smooth, rounded cup followed by a small dip—the handle—indicating a brief pause before the trend continues higher.

MES, MYM, and MCL are the Micro futures contracts that give beginners the best shot at passing a Tradeify Select or Growth prop firm evaluation.

How AI is reshaping prop trading for futures traders in 2026 — from institutional infrastructure and risk management to SEBI rules and Tradeify's funded path.
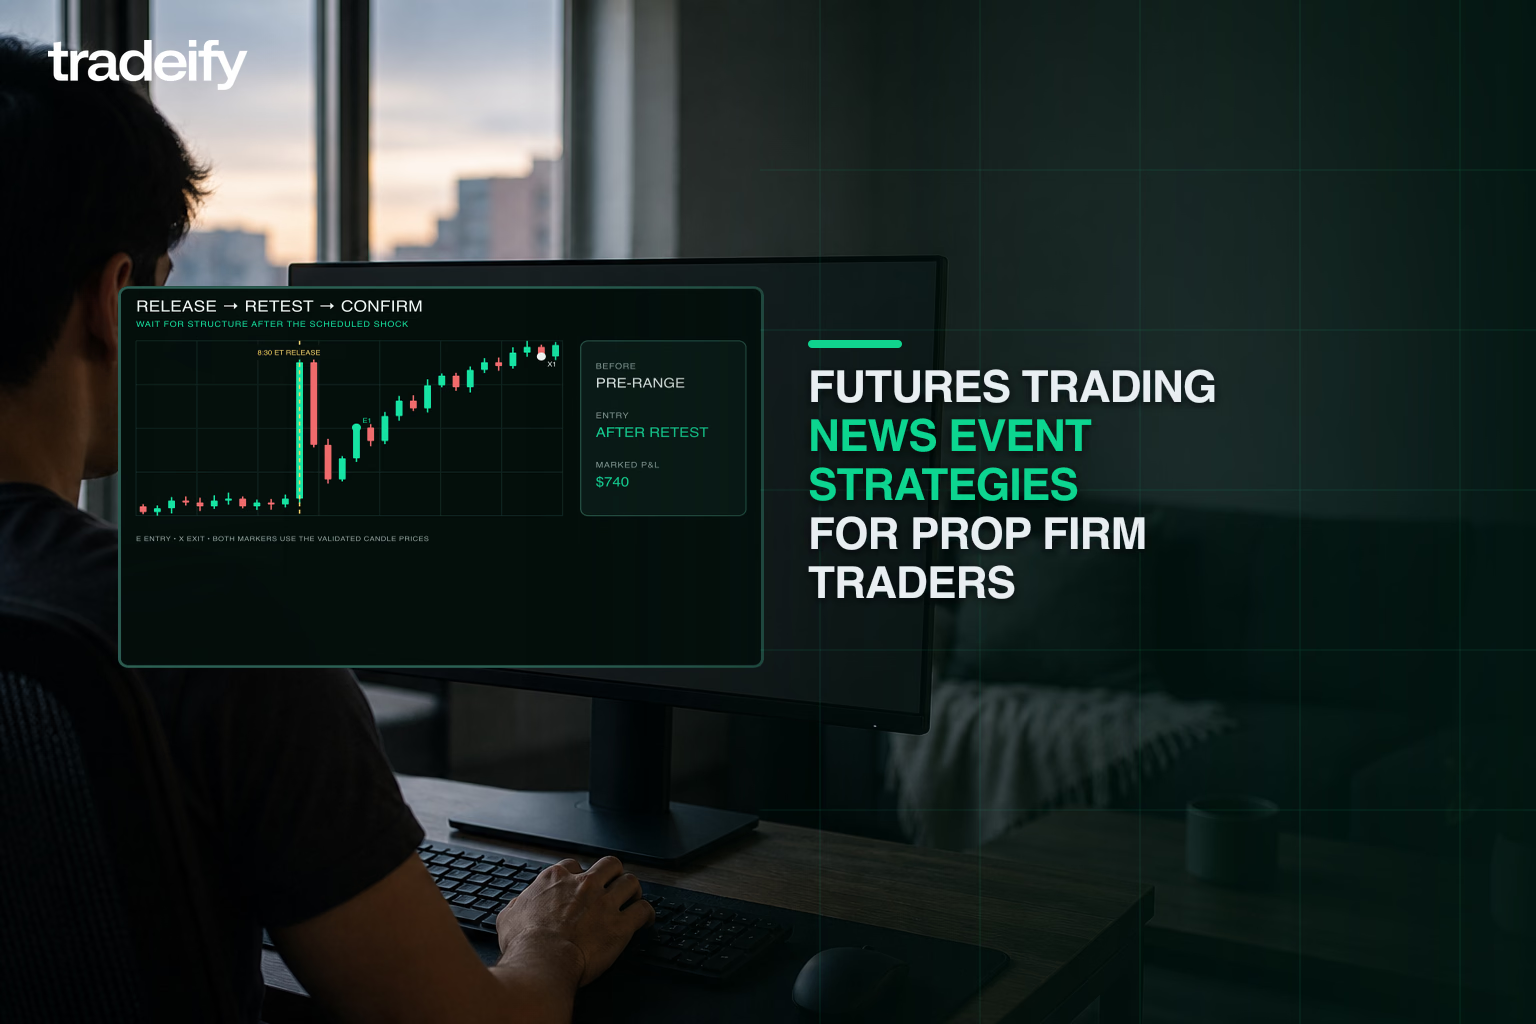
Tradeify allows full news event trading during FOMC, NFP, and CPI releases. A complete guide to rules, strategies, and risk management for prop traders.
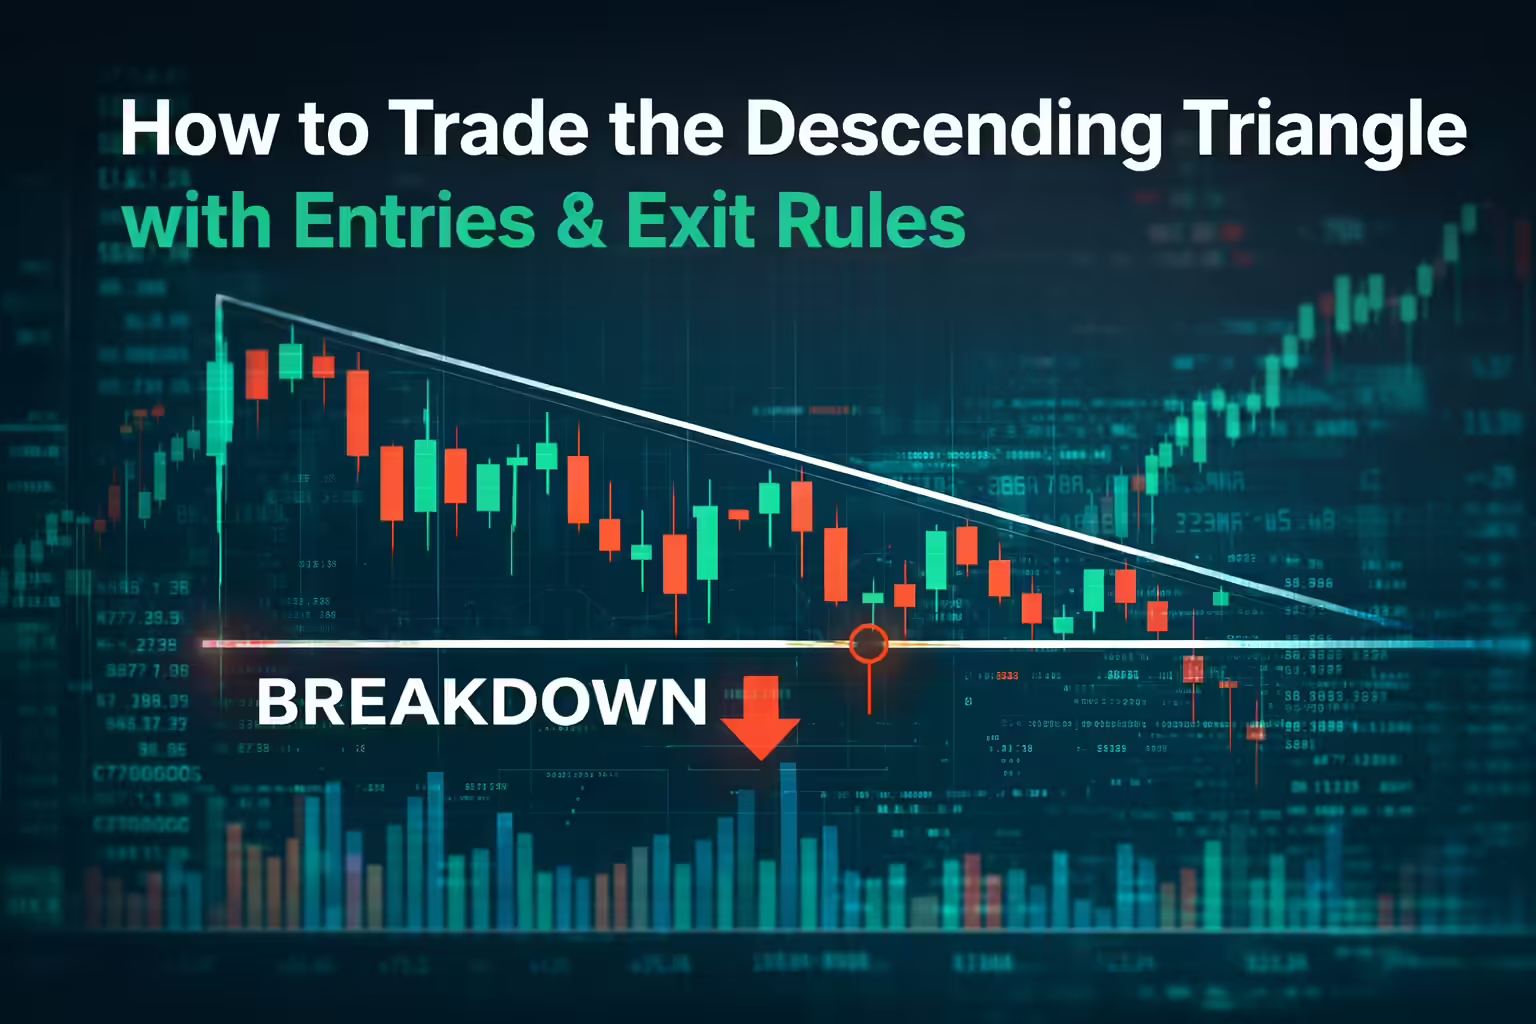
People always wonder how to make profits during bearish markets and instability - one way is by spotting and utilising the Descending Triangle Pattern. This pattern is one of the most reliable chart patterns used in technical analysis. Often it signals a potential bearish continuation, making it valuable for traders looking to short the market. In this guide, we explain what the descending triangle pattern is, how to spot it, and strategies to profit from it.